| Param | Original file | Final file |
|---|---|---|
| Filename | modeM0/AS1C09_003T01_9000006448_50710cztM0_level2.fits | modeM0/AS1C09_003T01_9000006448_50710cztM0_level2_quad_clean.evt |
| Size (bytes) | 535,901,760 | 89,510,400 |
| Size | 511.1 MB | 85.4 MB |
| Events in quadrant A | 3,448,346 | 598,334 |
| Events in quadrant B | 3,507,098 | 658,787 |
| Events in quadrant C | 6,374,038 | 523,034 |
| Events in quadrant D | 6,030,484 | 500,320 |
| Mode SS | |||
|---|---|---|---|
| Quadrant | BADHDUFLAG | Total packets | Discarded packets |
| A | 0 | 126 | 0 |
| B | 0 | 126 | 0 |
| C | 0 | 126 | 0 |
| D | 0 | 126 | 0 |
| Mode M9 | |||
|---|---|---|---|
| Quadrant | BADHDUFLAG | Total packets | Discarded packets |
| A | 0 | 11 | 0 |
| B | 0 | 11 | 0 |
| C | 0 | 11 | 0 |
| D | 0 | 11 | 0 |
| Mode M0 | |||
|---|---|---|---|
| Quadrant | BADHDUFLAG | Total packets | Discarded packets |
| A | 0 | 14221 | 1 |
| B | 0 | 14645 | 1 |
| C | 0 | 23167 | 1 |
| D | 0 | 22204 | 1 |
| Quadrant | Total seconds | Saturated seconds | Saturation percentage |
|---|---|---|---|
| A | 6152 | 117 | 1.901821% |
| B | 6152 | 120 | 1.950585% |
| C | 6152 | 918 | 14.921977% |
| D | 6152 | 727 | 11.817295% |
Noise dominated data is calculated using 1-second bins in cleaned event files. If a bin has >2000 counts, and if more than 50% of those come from <1% of pixels, then it is considered to be noise-dominated and hence unusable.
| Quadrant | # 1 sec bins | Bins with >0 counts | Bins with >2000 counts | High rate bins dominated by noise | Noise dominated (total time) | Noise dominated (detector-on time) | Marked lightcurve |
|---|---|---|---|---|---|---|---|
| A | 7322 | 6153 | 57 | 57 | 0.78% | 0.93% | 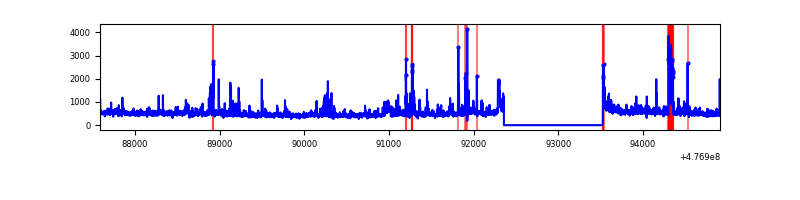 |
| B | 7322 | 6153 | 53 | 53 | 0.72% | 0.86% | 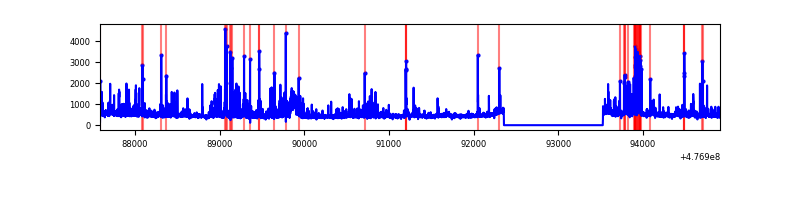 |
| C | 7322 | 6153 | 767 | 767 | 10.48% | 12.47% |  |
| D | 7322 | 6153 | 608 | 608 | 8.30% | 9.88% | 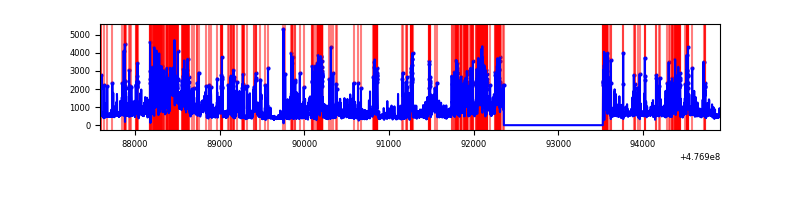 |
Top three noisy pixels from each quadrant. If the there are fewer than three noisy pixels in the level2.evt file, extra rows are filled as -1
| Pixel properties | Quadrant properties | ||||||
|---|---|---|---|---|---|---|---|
| Quadrant | DetID | PixID | Counts | Sigma | Mean | Median | Sigma |
| A | 4 | 3 | 200147 | 1225.88 | 656 | 641 | 162.7 |
| A | 4 | 249 | 126147 | 771.18 | 656 | 641 | 162.7 |
| A | 8 | 38 | 122749 | 750.3 | 656 | 641 | 162.7 |
| B | 0 | 229 | 180851 | 1303.19 | 658 | 634 | 138.3 |
| B | 6 | 51 | 159152 | 1146.28 | 658 | 634 | 138.3 |
| B | 8 | 128 | 91173 | 654.71 | 658 | 634 | 138.3 |
| C | 5 | 10 | 1974506 | 11725.82 | 614 | 612 | 168.3 |
| C | 4 | 5 | 548005 | 3251.76 | 614 | 612 | 168.3 |
| C | 15 | 1 | 441793 | 2620.82 | 614 | 612 | 168.3 |
| D | 8 | 176 | 2005184 | 11722.29 | 614 | 592 | 171.0 |
| D | 6 | 63 | 386242 | 2255.17 | 614 | 592 | 171.0 |
| D | 2 | 249 | 295126 | 1722.35 | 614 | 592 | 171.0 |
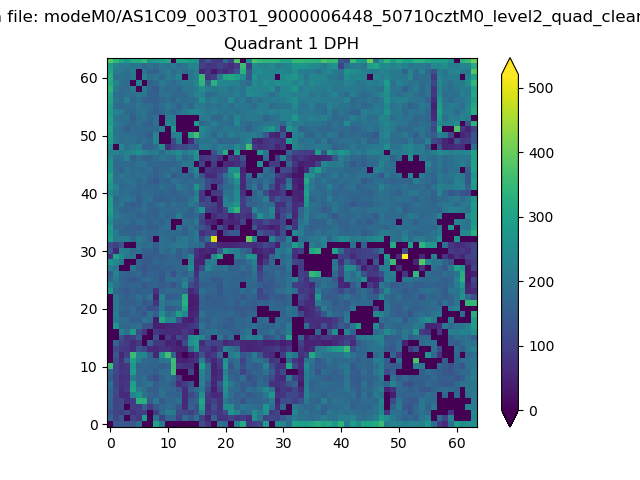
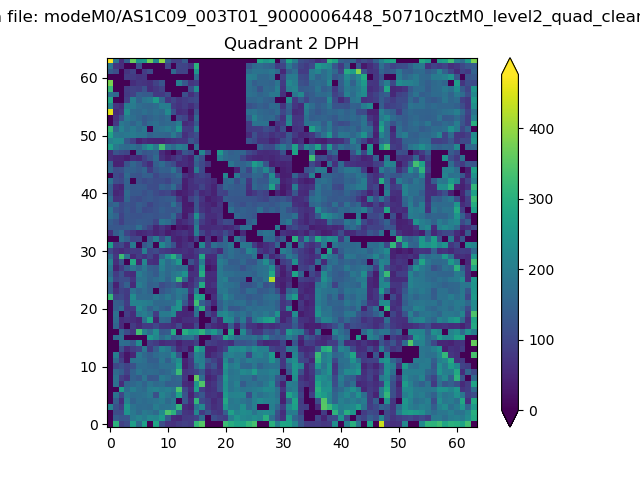
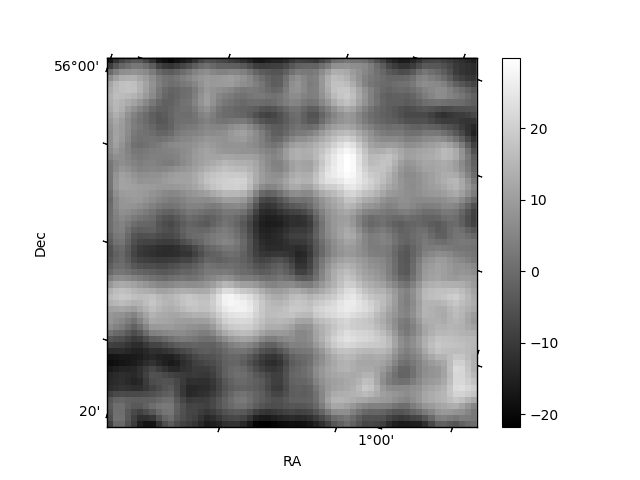
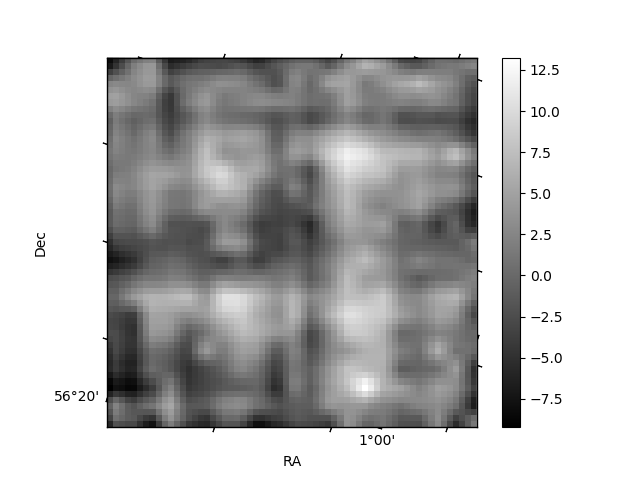
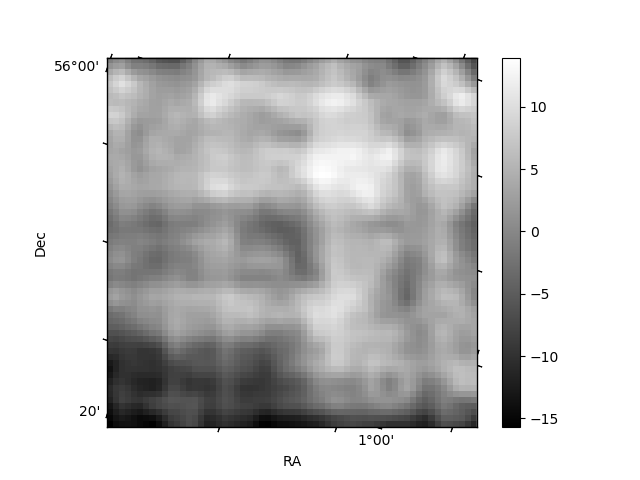
Histogram calculated using DETX and DETY for each event in the final _common_clean file
| Quadrant A | 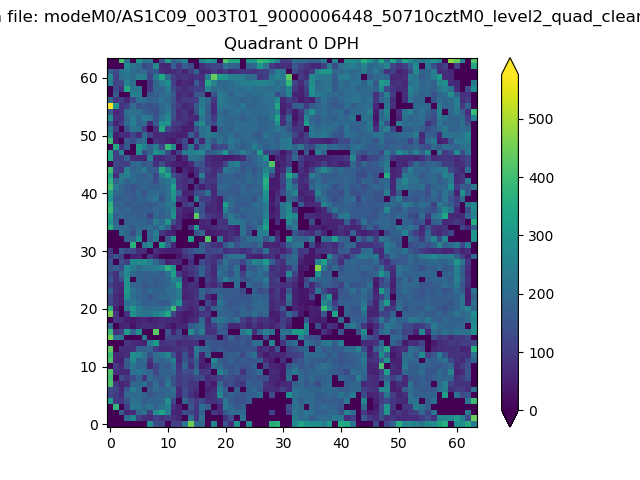 |
 |
Quadrant B |
|---|---|---|---|
| Quadrant D | 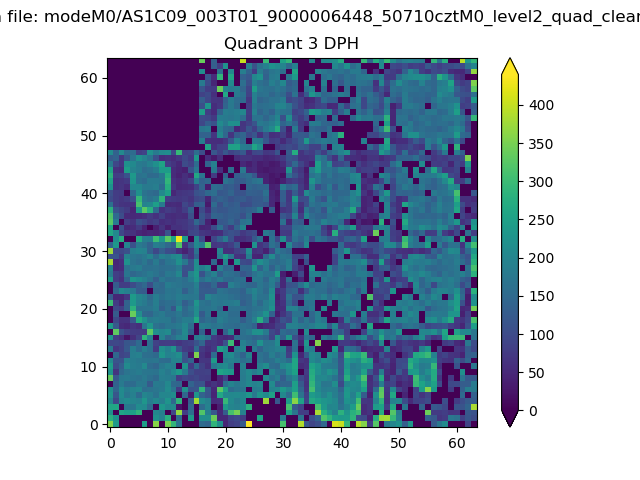 |
 |
Quadrant C |
| Plot type | Count rate plots | Images |
|---|---|---|
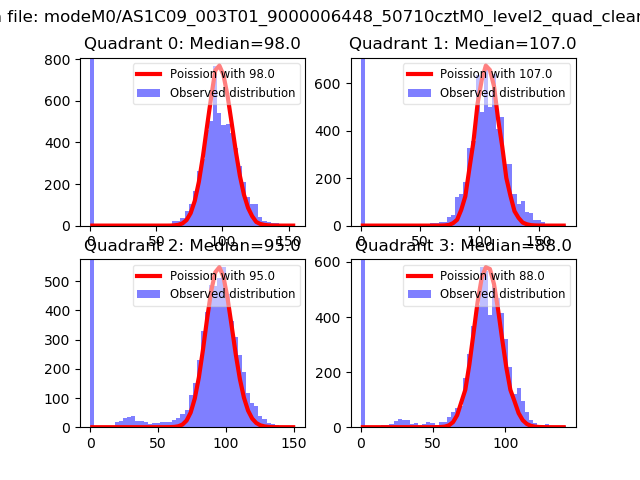
| Comparison with Poisson distribution Blue bars denote a histogram of data divided into 1 sec bins. Red curve is a Poisson curve with rate = median count rate of data. |
 |
 |
| Quadrant-wise count rates Data is divided into 100 sec bins |
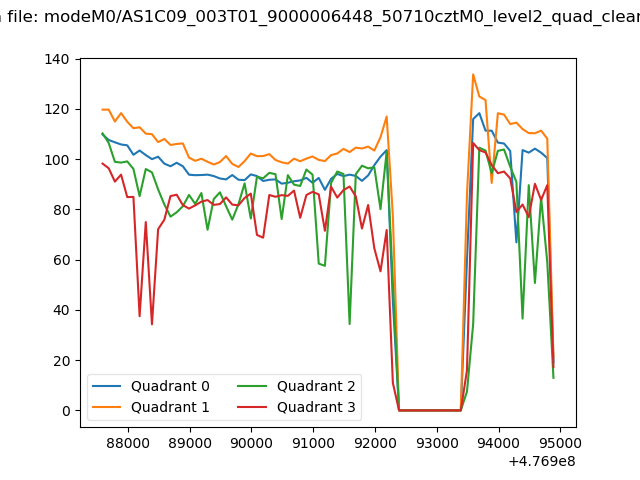 |
|
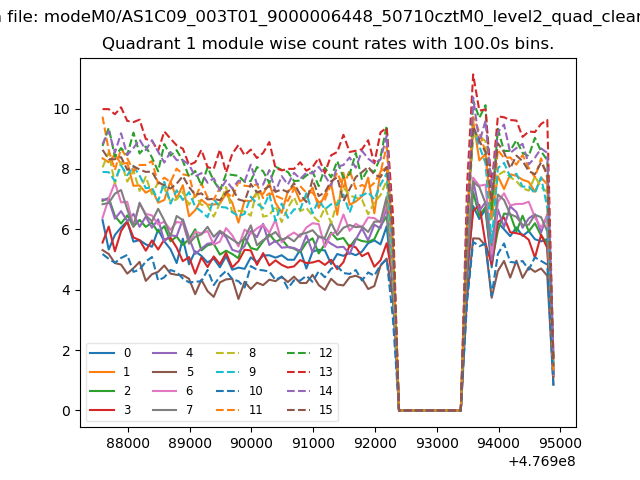
| Module-wise count rates for Quadrant A Data is divided into 100 sec bins |
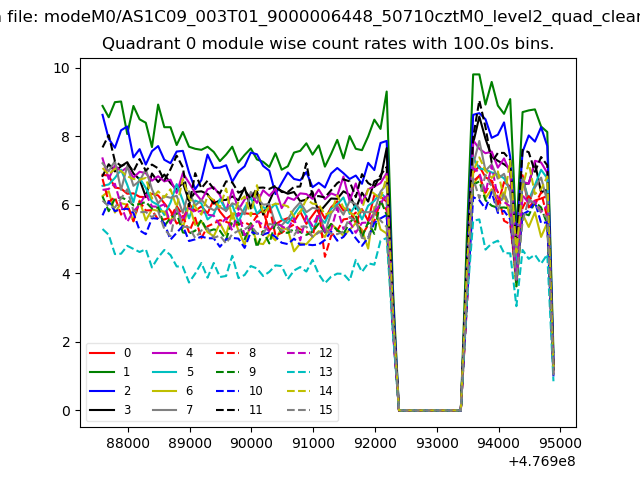 |
 |
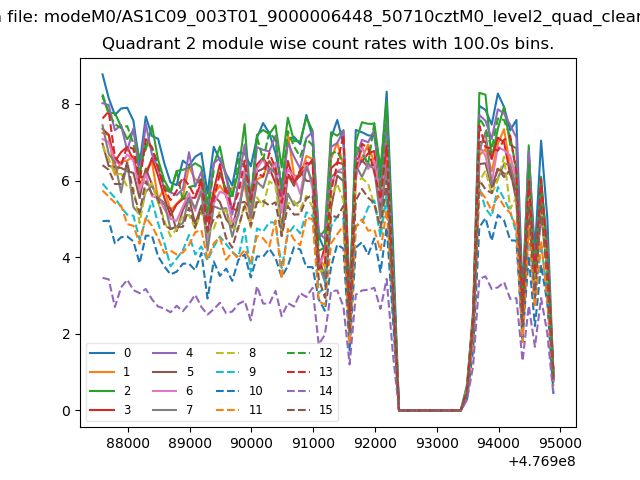
| Module-wise count rates for Quadrant B Data is divided into 100 sec bins |
 |
 |
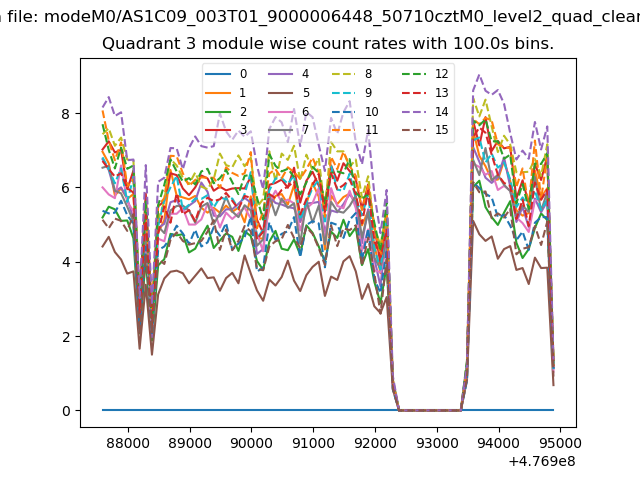
| Module-wise count rates for Quadrant C Data is divided into 100 sec bins |
 |
 |
| Module-wise count rates for Quadrant D Data is divided into 100 sec bins |
 |
 |
| Parameter | Plot |
|---|---|
| CZT HV Monitor | 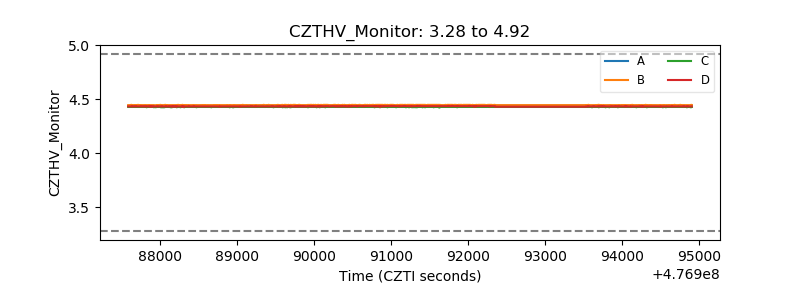 |
| D_VDD | 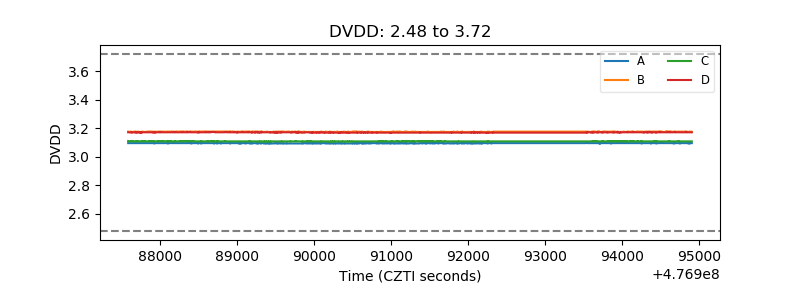 |
| Temperature 1 | 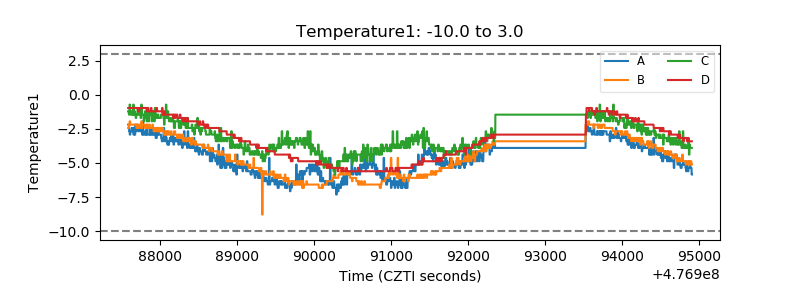 |
| Veto HV Monitor | 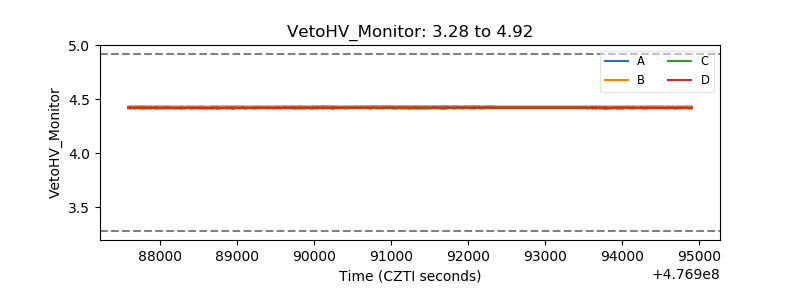 |
| Veto LLD | 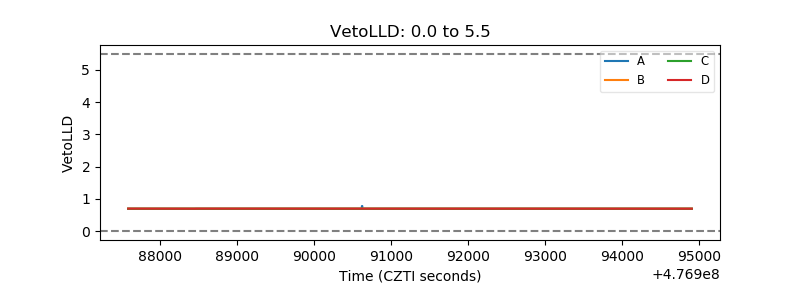 |
| Alpha Counter | 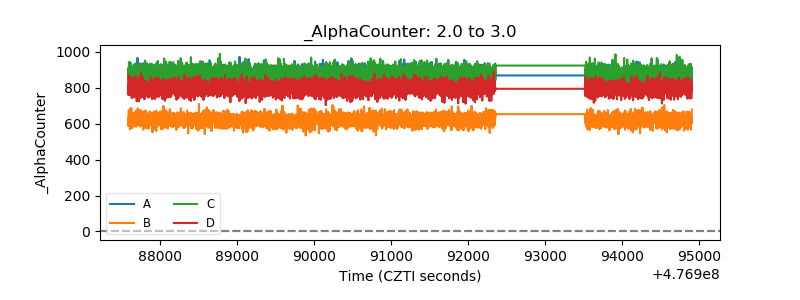 |
| _CPM_Rate | 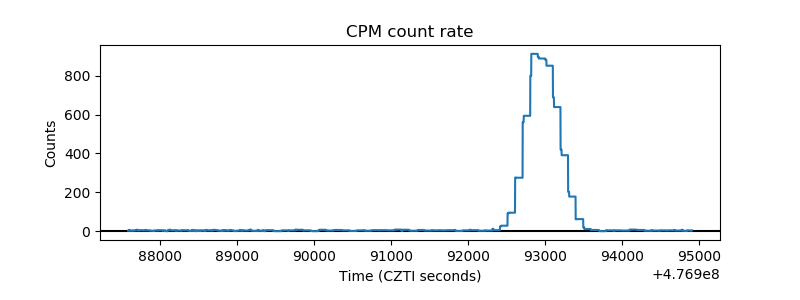 |
| CZT Counter | 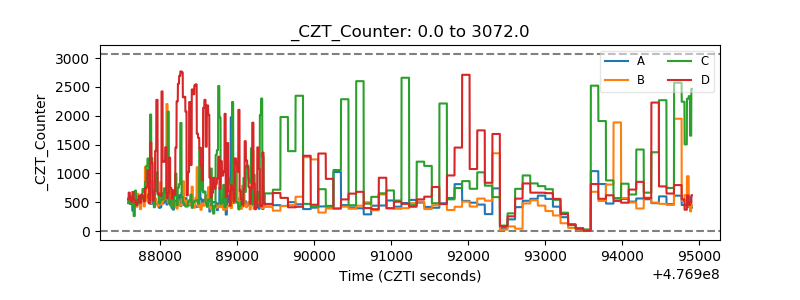 |
| +2.5 Volts monitor | 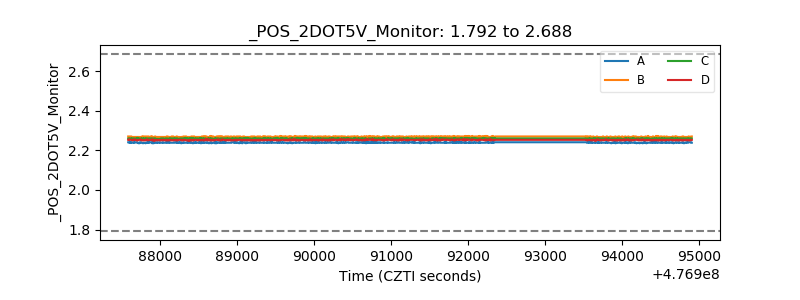 |
| +5 Volts monitor | 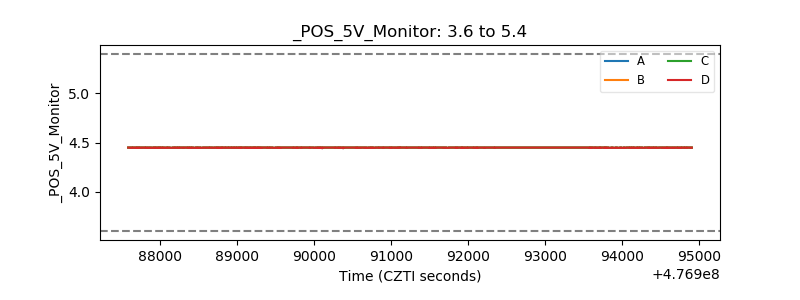 |
| _ROLL_ROT | 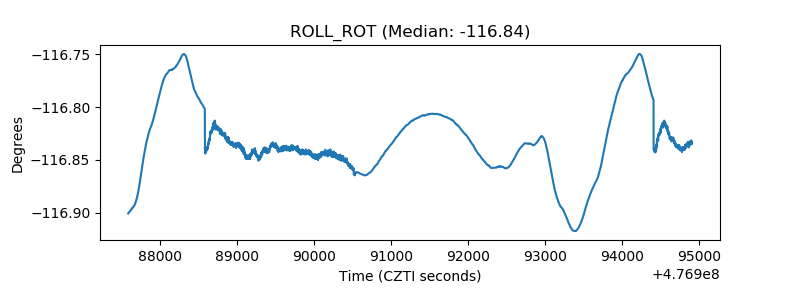 |
| _Roll_DEC | 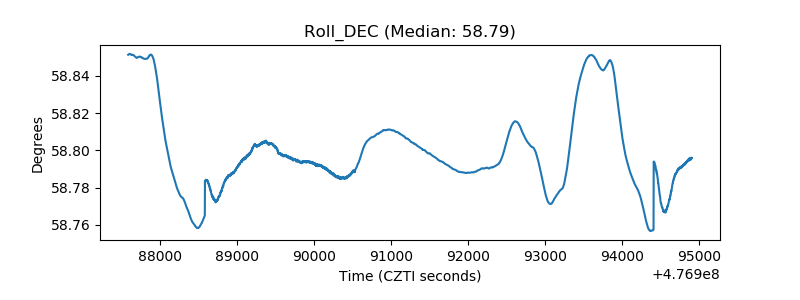 |
| _Roll_RA | 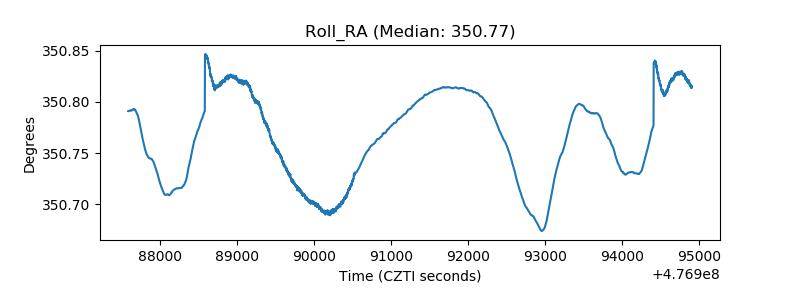 |
| Veto Counter | 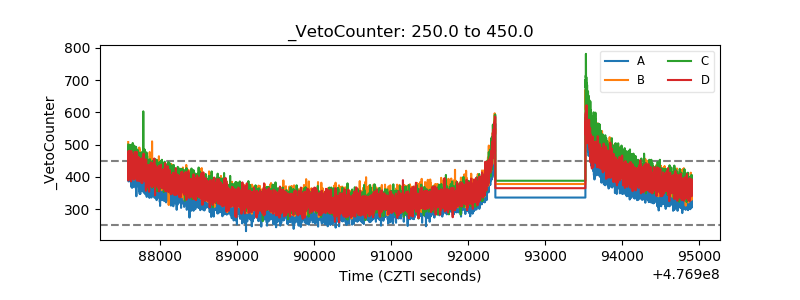 |