| Param | Original file | Final file |
|---|---|---|
| Filename | modeM0/AS1C09_003T01_9000006448_50711cztM0_level2.fits | modeM0/AS1C09_003T01_9000006448_50711cztM0_level2_quad_clean.evt |
| Size (bytes) | 556,303,680 | 92,597,760 |
| Size | 530.5 MB | 88.3 MB |
| Events in quadrant A | 3,905,316 | 609,419 |
| Events in quadrant B | 3,553,731 | 681,247 |
| Events in quadrant C | 7,452,996 | 519,646 |
| Events in quadrant D | 5,191,668 | 552,997 |
| Mode SS | |||
|---|---|---|---|
| Quadrant | BADHDUFLAG | Total packets | Discarded packets |
| A | 0 | 130 | 0 |
| B | 0 | 130 | 0 |
| C | 0 | 130 | 0 |
| D | 0 | 130 | 0 |
| Mode M9 | |||
|---|---|---|---|
| Quadrant | BADHDUFLAG | Total packets | Discarded packets |
| A | 0 | 12 | 0 |
| B | 0 | 12 | 0 |
| C | 0 | 13 | 0 |
| D | 0 | 13 | 0 |
| Mode M0 | |||
|---|---|---|---|
| Quadrant | BADHDUFLAG | Total packets | Discarded packets |
| A | 0 | 15858 | 2 |
| B | 0 | 15000 | 2 |
| C | 0 | 26496 | 2 |
| D | 0 | 19817 | 4 |
| Quadrant | Total seconds | Saturated seconds | Saturation percentage |
|---|---|---|---|
| A | 6304 | 228 | 3.616751% |
| B | 6304 | 151 | 2.395305% |
| C | 6304 | 1261 | 20.003173% |
| D | 6303 | 387 | 6.139933% |
Noise dominated data is calculated using 1-second bins in cleaned event files. If a bin has >2000 counts, and if more than 50% of those come from <1% of pixels, then it is considered to be noise-dominated and hence unusable.
| Quadrant | # 1 sec bins | Bins with >0 counts | Bins with >2000 counts | High rate bins dominated by noise | Noise dominated (total time) | Noise dominated (detector-on time) | Marked lightcurve |
|---|---|---|---|---|---|---|---|
| A | 7469 | 6305 | 148 | 148 | 1.98% | 2.35% | 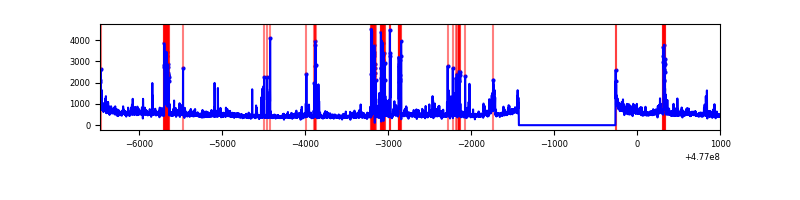 |
| B | 7469 | 6305 | 72 | 72 | 0.96% | 1.14% | 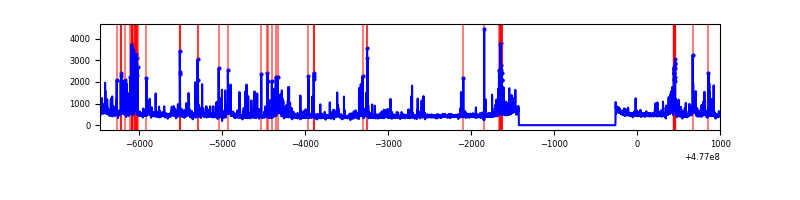 |
| C | 7469 | 6304 | 964 | 964 | 12.91% | 15.29% |  |
| D | 7468 | 6304 | 294 | 294 | 3.94% | 4.66% | 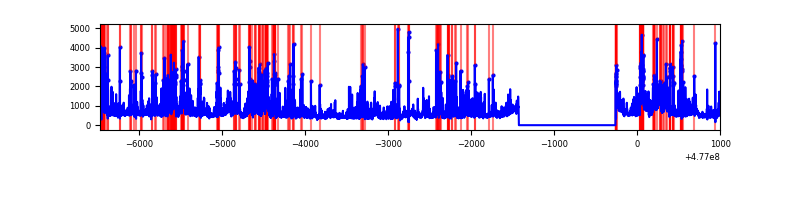 |
Top three noisy pixels from each quadrant. If the there are fewer than three noisy pixels in the level2.evt file, extra rows are filled as -1
| Pixel properties | Quadrant properties | ||||||
|---|---|---|---|---|---|---|---|
| Quadrant | DetID | PixID | Counts | Sigma | Mean | Median | Sigma |
| A | 4 | 249 | 262106 | 1563.68 | 674 | 658 | 167.2 |
| A | 9 | 191 | 231430 | 1380.21 | 674 | 658 | 167.2 |
| A | 8 | 38 | 185655 | 1106.44 | 674 | 658 | 167.2 |
| B | 6 | 51 | 161314 | 1111.59 | 682 | 658 | 144.5 |
| B | 7 | 0 | 133311 | 917.83 | 682 | 658 | 144.5 |
| B | 0 | 213 | 118125 | 812.76 | 682 | 658 | 144.5 |
| C | 5 | 10 | 1700924 | 9862.8 | 625 | 620 | 172.4 |
| C | 0 | 193 | 1126378 | 6530.08 | 625 | 620 | 172.4 |
| C | 15 | 1 | 1055830 | 6120.86 | 625 | 620 | 172.4 |
| D | 8 | 176 | 1045001 | 5747.83 | 655 | 631 | 181.7 |
| D | 10 | 98 | 319153 | 1753.03 | 655 | 631 | 181.7 |
| D | 2 | 249 | 236399 | 1297.58 | 655 | 631 | 181.7 |
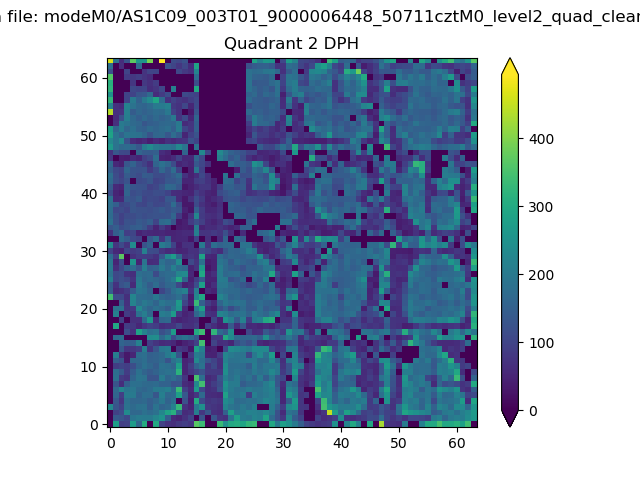
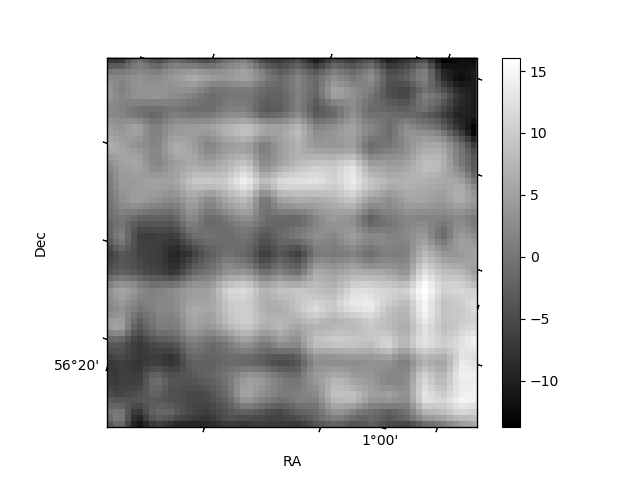
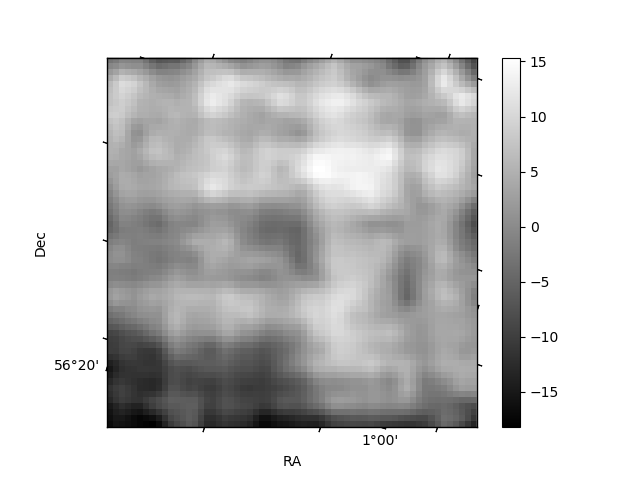
Histogram calculated using DETX and DETY for each event in the final _common_clean file
| Quadrant A | 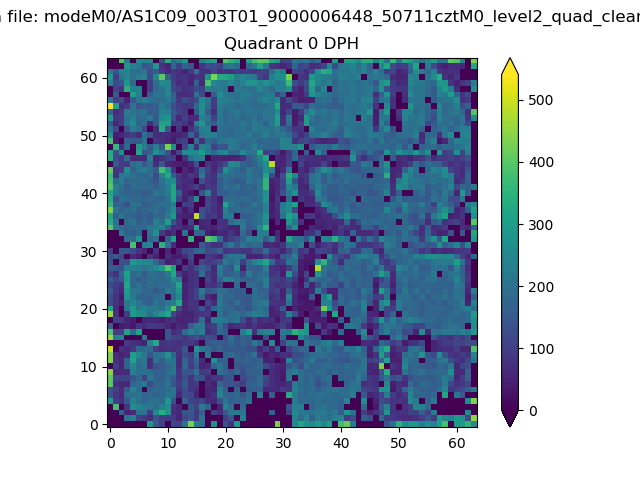 |
 |
Quadrant B |
|---|---|---|---|
| Quadrant D | 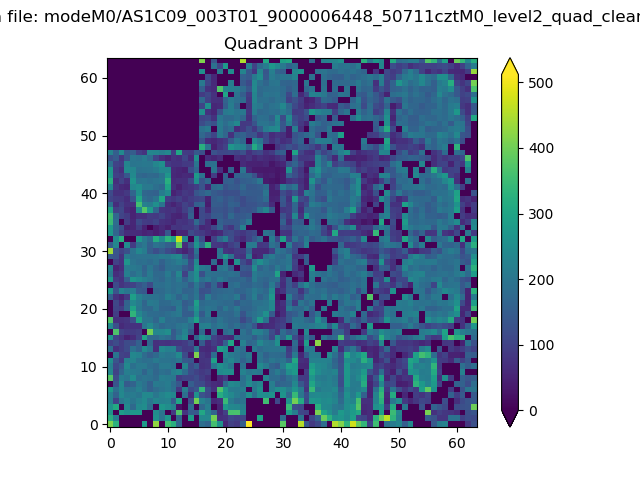 |
 |
Quadrant C |
| Plot type | Count rate plots | Images |
|---|---|---|
| Comparison with Poisson distribution Blue bars denote a histogram of data divided into 1 sec bins. Red curve is a Poisson curve with rate = median count rate of data. |
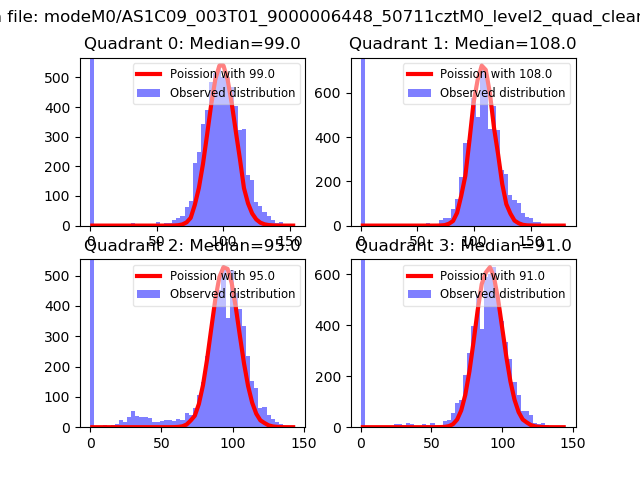 |
 |
| Quadrant-wise count rates Data is divided into 100 sec bins |
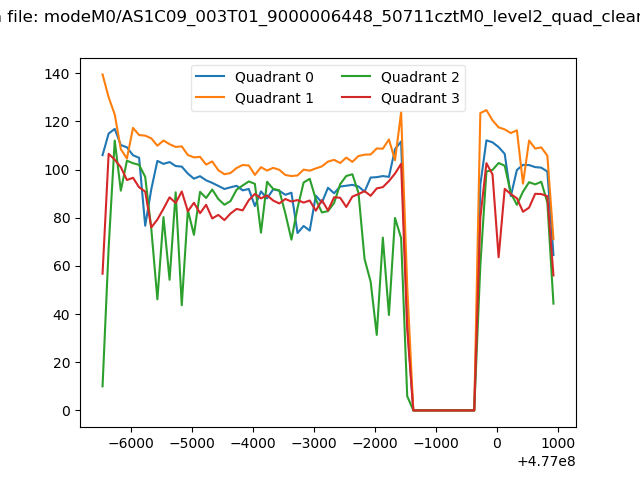 |
|
| Module-wise count rates for Quadrant A Data is divided into 100 sec bins |
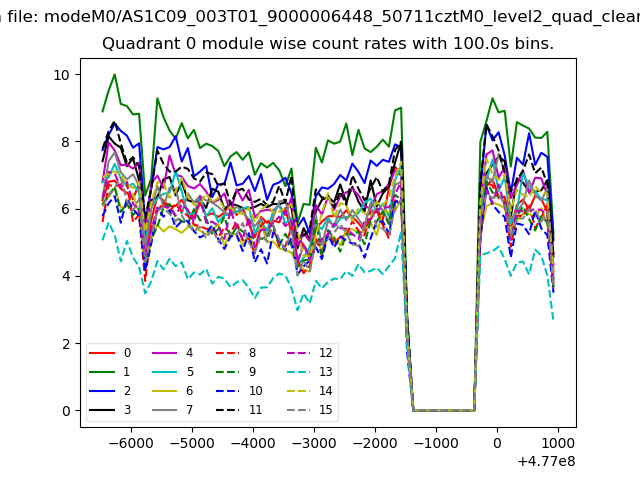 |
 |
| Module-wise count rates for Quadrant B Data is divided into 100 sec bins |
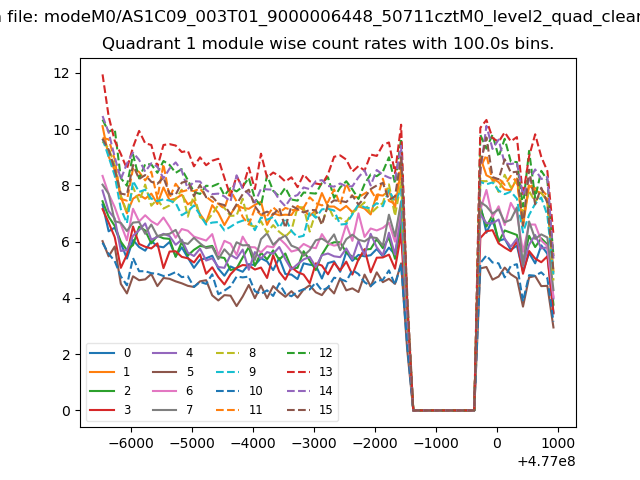 |
 |
| Module-wise count rates for Quadrant C Data is divided into 100 sec bins |
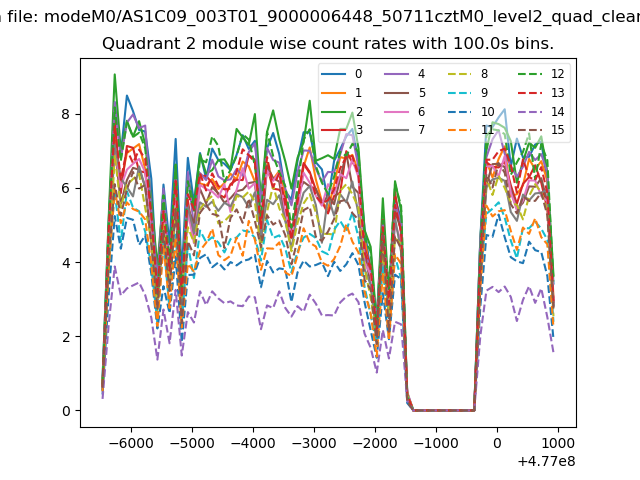 |
 |
| Module-wise count rates for Quadrant D Data is divided into 100 sec bins |
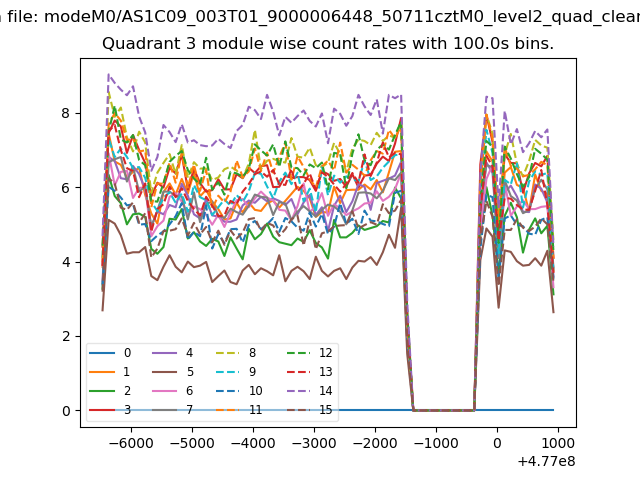 |
 |
| Parameter | Plot |
|---|---|
| CZT HV Monitor | 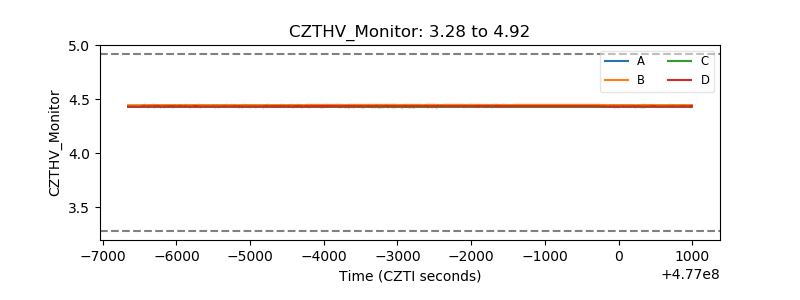 |
| D_VDD | 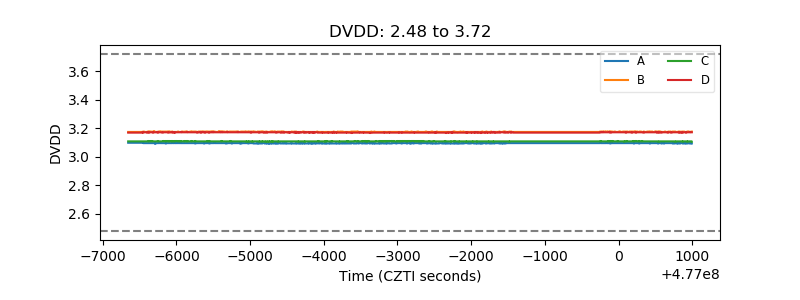 |
| Temperature 1 | 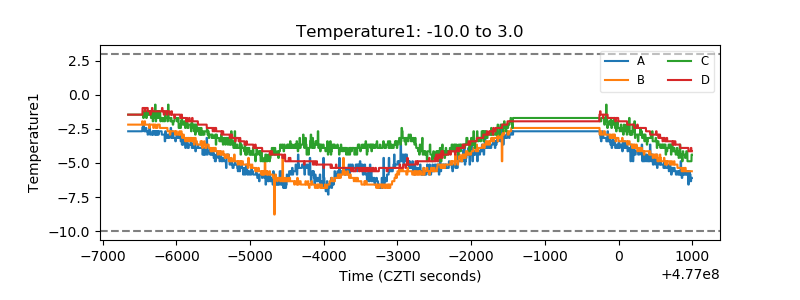 |
| Veto HV Monitor | 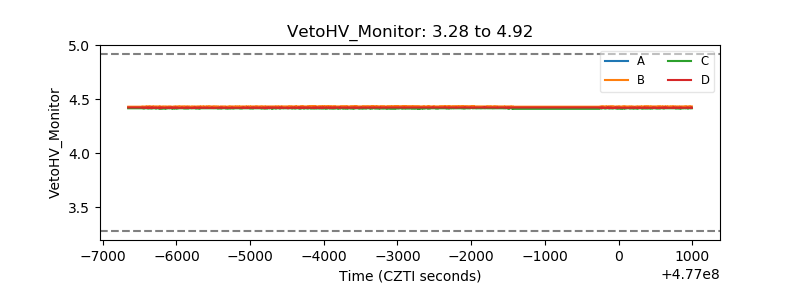 |
| Veto LLD | 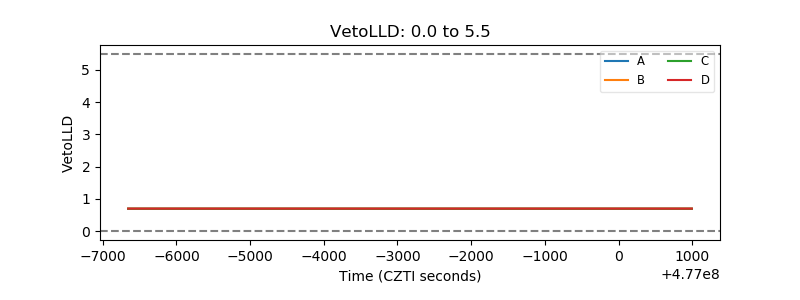 |
| Alpha Counter | 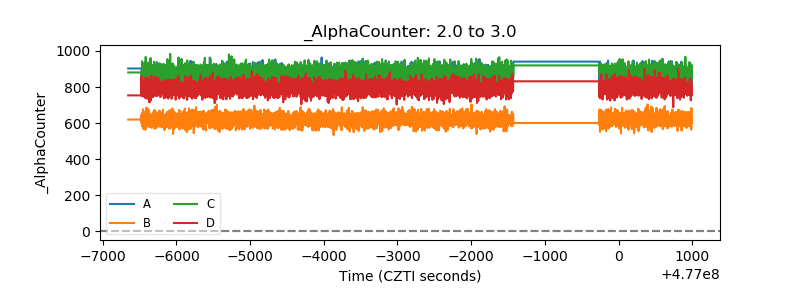 |
| _CPM_Rate | 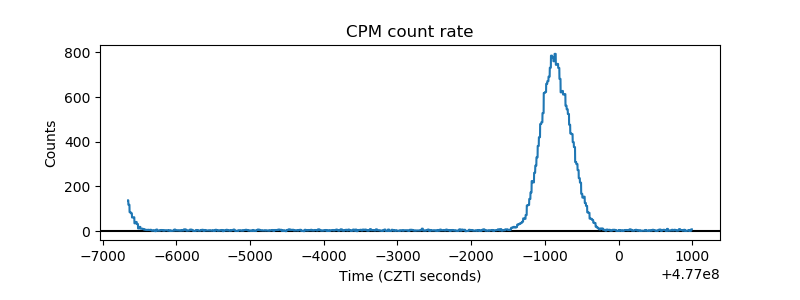 |
| CZT Counter | 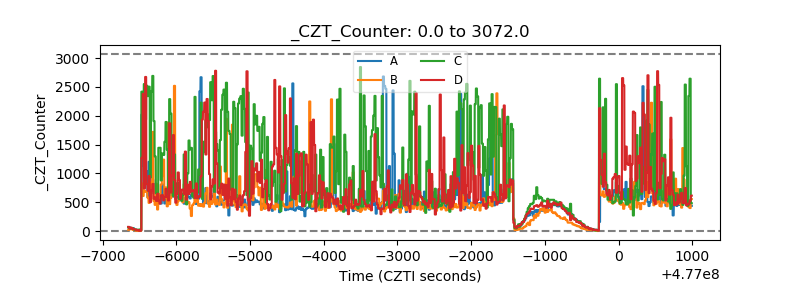 |
| +2.5 Volts monitor | 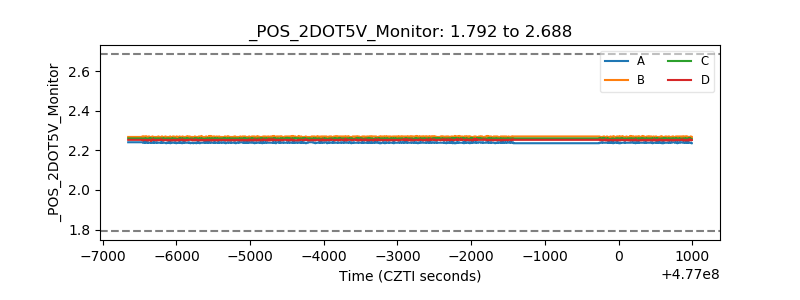 |
| +5 Volts monitor | 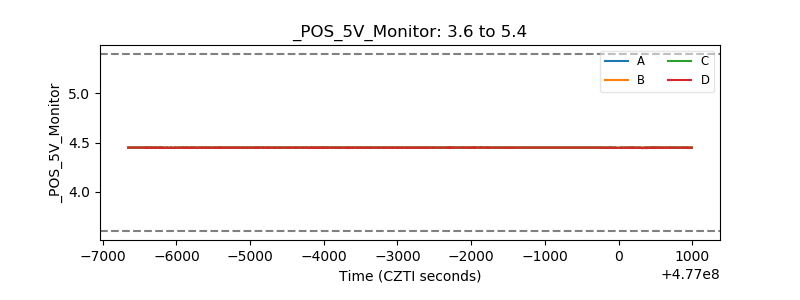 |
| _ROLL_ROT | 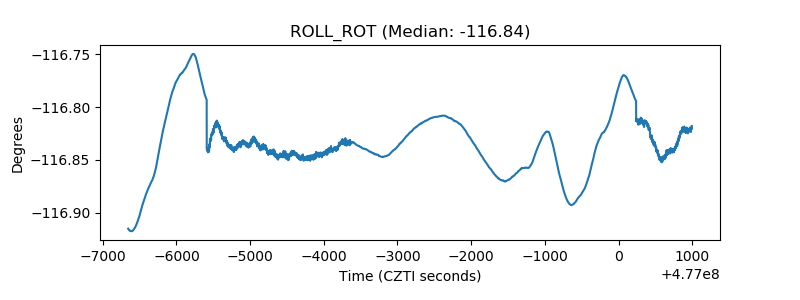 |
| _Roll_DEC | 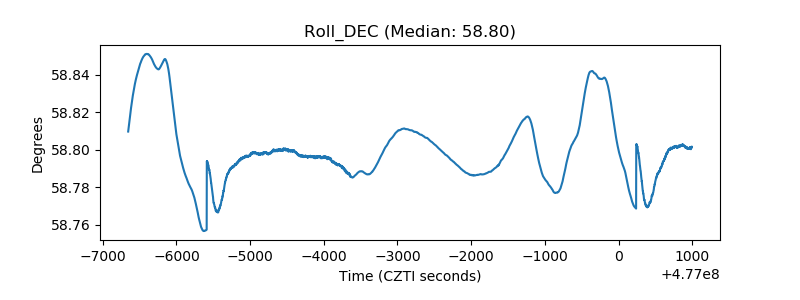 |
| _Roll_RA | 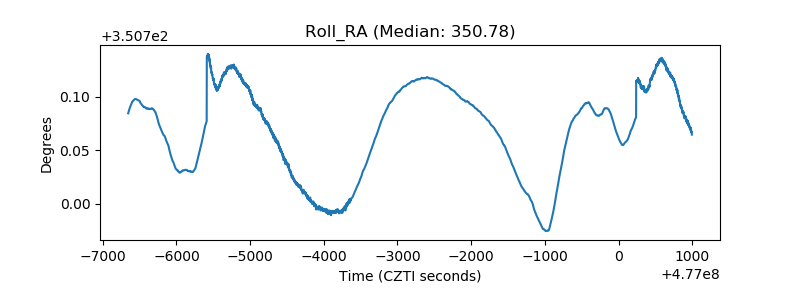 |
| Veto Counter | 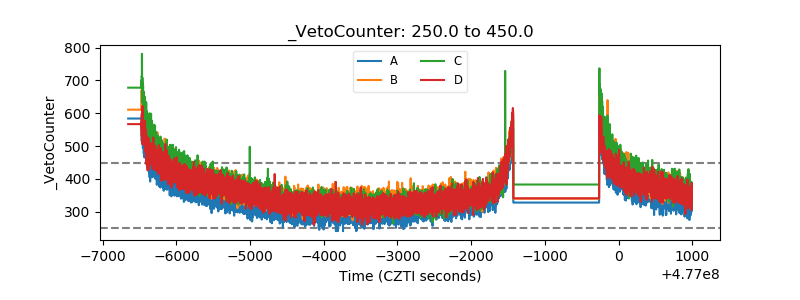 |