| Param | Original file | Final file |
|---|---|---|
| Filename | modeM0/AS1C09_003T01_9000006448_50712cztM0_level2.fits | modeM0/AS1C09_003T01_9000006448_50712cztM0_level2_quad_clean.evt |
| Size (bytes) | 563,031,360 | 93,769,920 |
| Size | 536.9 MB | 89.4 MB |
| Events in quadrant A | 4,243,214 | 616,804 |
| Events in quadrant B | 3,985,826 | 682,475 |
| Events in quadrant C | 6,105,627 | 550,081 |
| Events in quadrant D | 6,000,742 | 534,264 |
| Mode SS | |||
|---|---|---|---|
| Quadrant | BADHDUFLAG | Total packets | Discarded packets |
| A | 0 | 134 | 0 |
| B | 0 | 134 | 0 |
| C | 0 | 134 | 0 |
| D | 0 | 134 | 0 |
| Mode M9 | |||
|---|---|---|---|
| Quadrant | BADHDUFLAG | Total packets | Discarded packets |
| A | 0 | 19 | 0 |
| B | 0 | 20 | 0 |
| C | 0 | 20 | 0 |
| D | 0 | 20 | 0 |
| Mode M0 | |||
|---|---|---|---|
| Quadrant | BADHDUFLAG | Total packets | Discarded packets |
| A | 0 | 16888 | 2 |
| B | 0 | 16463 | 2 |
| C | 0 | 22738 | 2 |
| D | 0 | 22410 | 2 |
| Quadrant | Total seconds | Saturated seconds | Saturation percentage |
|---|---|---|---|
| A | 6526 | 282 | 4.321177% |
| B | 6526 | 231 | 3.539687% |
| C | 6526 | 963 | 14.756359% |
| D | 6526 | 710 | 10.879559% |
Noise dominated data is calculated using 1-second bins in cleaned event files. If a bin has >2000 counts, and if more than 50% of those come from <1% of pixels, then it is considered to be noise-dominated and hence unusable.
| Quadrant | # 1 sec bins | Bins with >0 counts | Bins with >2000 counts | High rate bins dominated by noise | Noise dominated (total time) | Noise dominated (detector-on time) | Marked lightcurve |
|---|---|---|---|---|---|---|---|
| A | 7646 | 6527 | 194 | 194 | 2.54% | 2.97% | 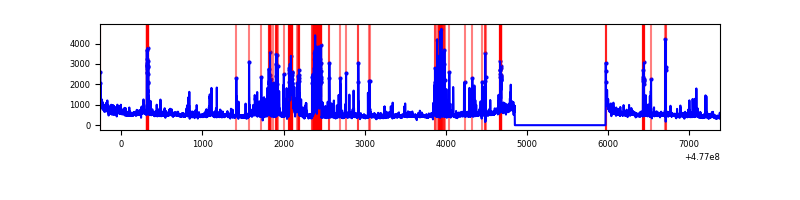 |
| B | 7646 | 6527 | 125 | 125 | 1.63% | 1.92% |  |
| C | 7646 | 6527 | 709 | 709 | 9.27% | 10.86% | 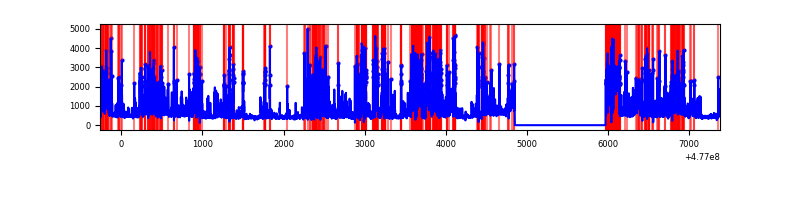 |
| D | 7646 | 6527 | 580 | 580 | 7.59% | 8.89% | 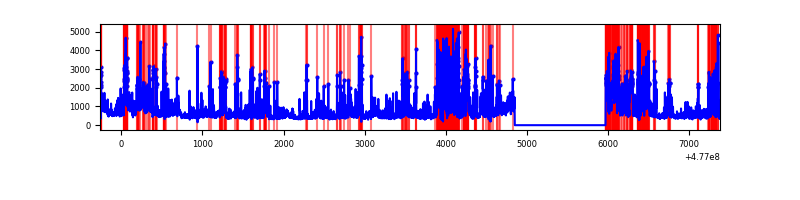 |
Top three noisy pixels from each quadrant. If the there are fewer than three noisy pixels in the level2.evt file, extra rows are filled as -1
| Pixel properties | Quadrant properties | ||||||
|---|---|---|---|---|---|---|---|
| Quadrant | DetID | PixID | Counts | Sigma | Mean | Median | Sigma |
| A | 9 | 191 | 295529 | 1680.14 | 695 | 675 | 175.5 |
| A | 4 | 249 | 285758 | 1624.46 | 695 | 675 | 175.5 |
| A | 8 | 62 | 219893 | 1249.15 | 695 | 675 | 175.5 |
| B | 7 | 0 | 490517 | 3327.0 | 697 | 673 | 147.2 |
| B | 6 | 51 | 179242 | 1212.83 | 697 | 673 | 147.2 |
| B | 0 | 213 | 139969 | 946.09 | 697 | 673 | 147.2 |
| C | 5 | 10 | 1779387 | 9931.97 | 647 | 642 | 179.1 |
| C | 0 | 193 | 564437 | 3148.06 | 647 | 642 | 179.1 |
| C | 13 | 3 | 243877 | 1358.15 | 647 | 642 | 179.1 |
| D | 8 | 176 | 1756063 | 9640.94 | 656 | 630 | 182.1 |
| D | 11 | 245 | 303477 | 1663.25 | 656 | 630 | 182.1 |
| D | 2 | 226 | 216705 | 1186.7 | 656 | 630 | 182.1 |
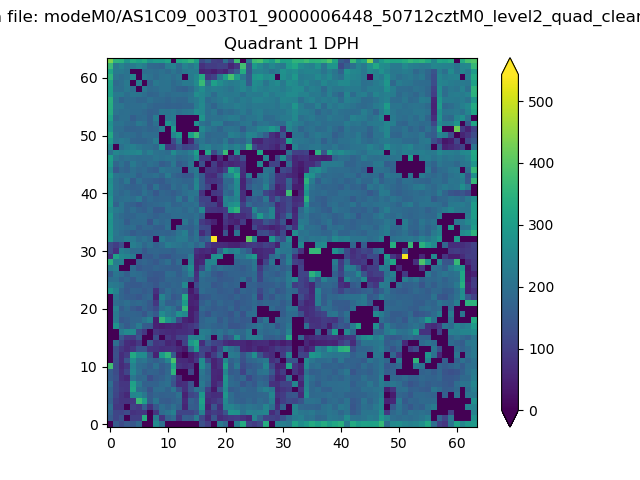
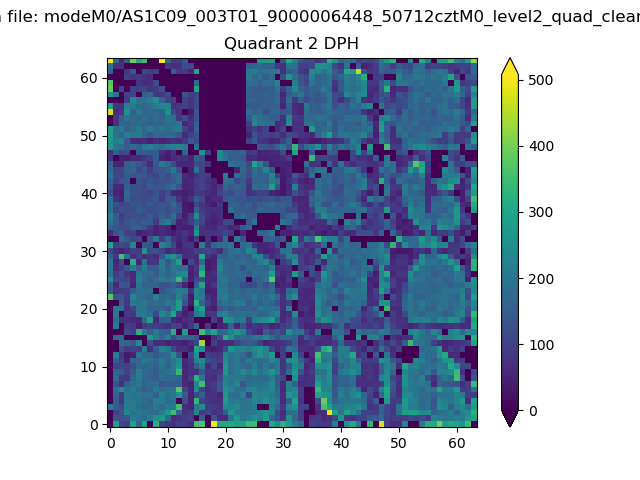
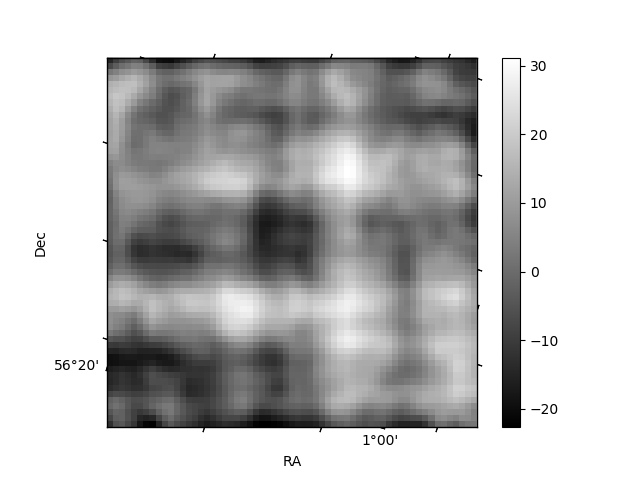
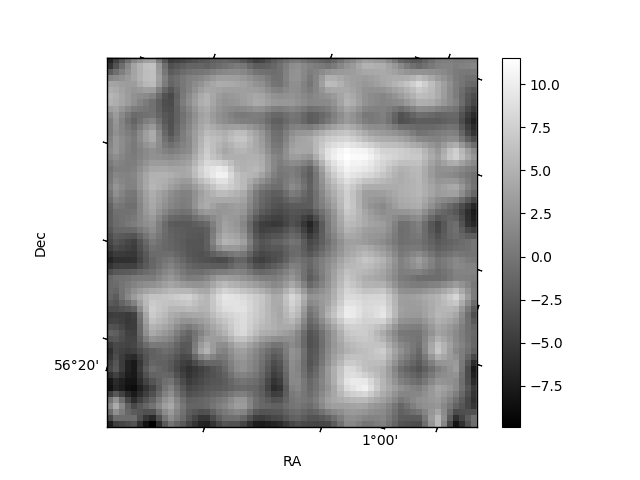
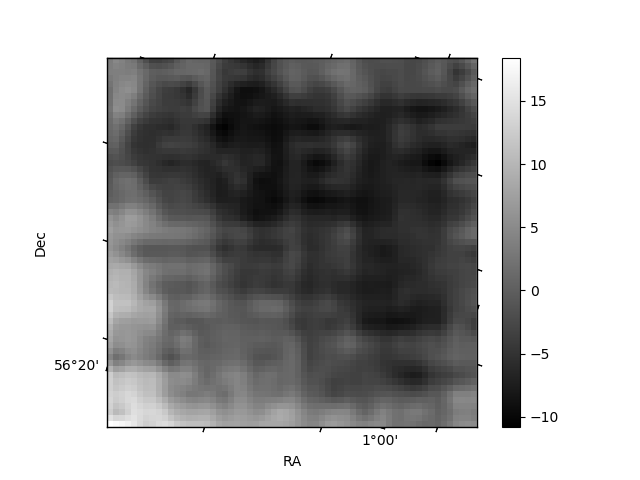
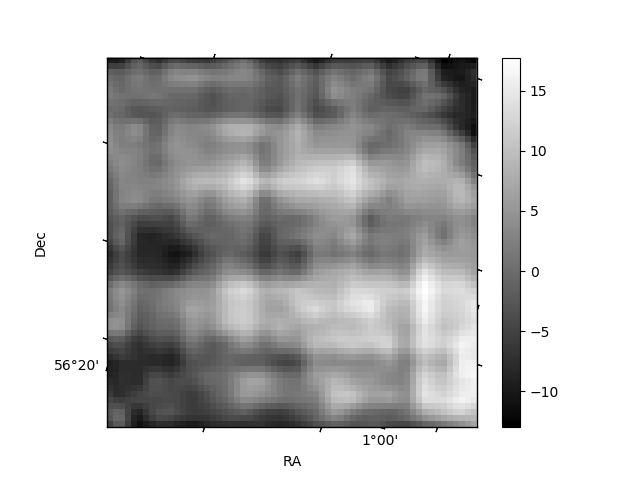
Histogram calculated using DETX and DETY for each event in the final _common_clean file
| Quadrant A | 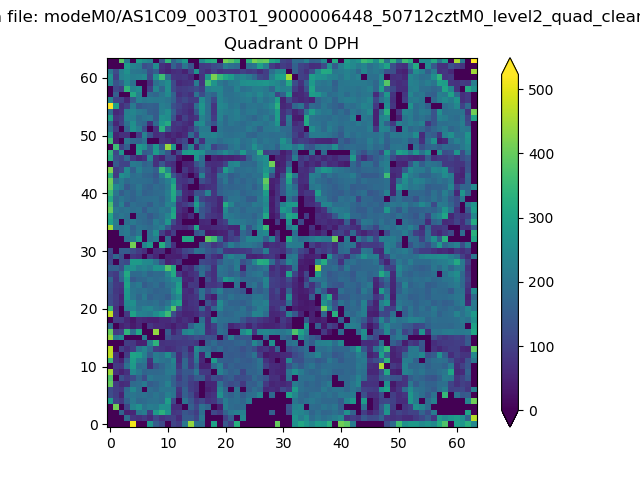 |
 |
Quadrant B |
|---|---|---|---|
| Quadrant D | 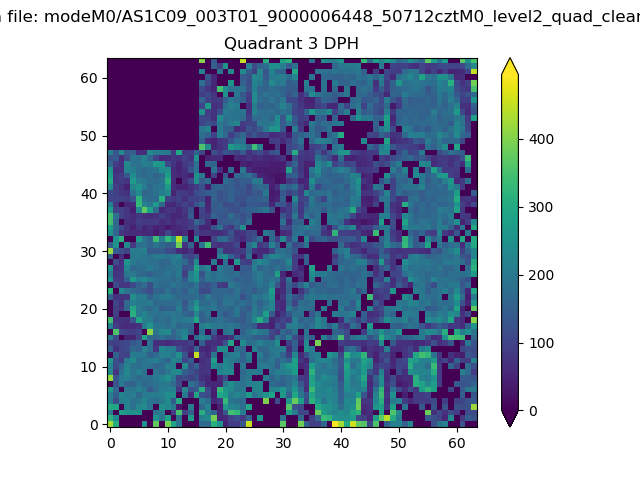 |
 |
Quadrant C |
| Plot type | Count rate plots | Images |
|---|---|---|
| Comparison with Poisson distribution Blue bars denote a histogram of data divided into 1 sec bins. Red curve is a Poisson curve with rate = median count rate of data. |
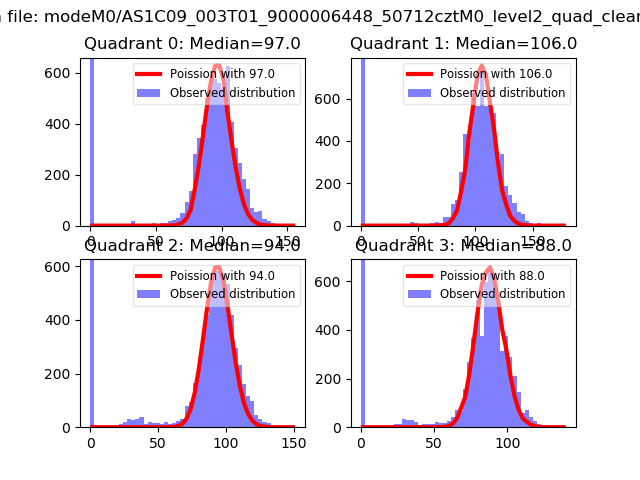 |
 |
| Quadrant-wise count rates Data is divided into 100 sec bins |
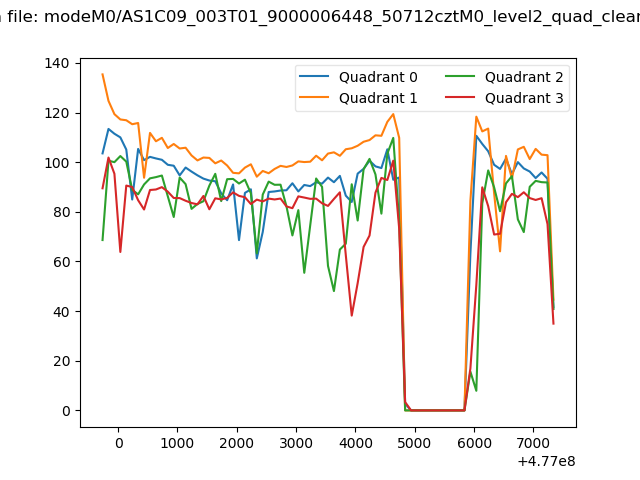 |
|
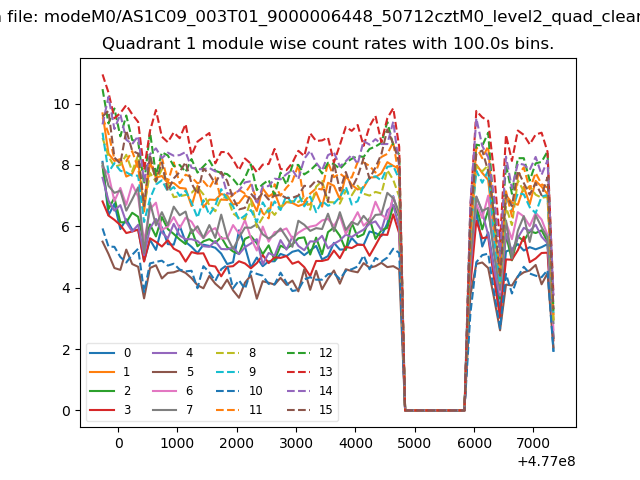
| Module-wise count rates for Quadrant A Data is divided into 100 sec bins |
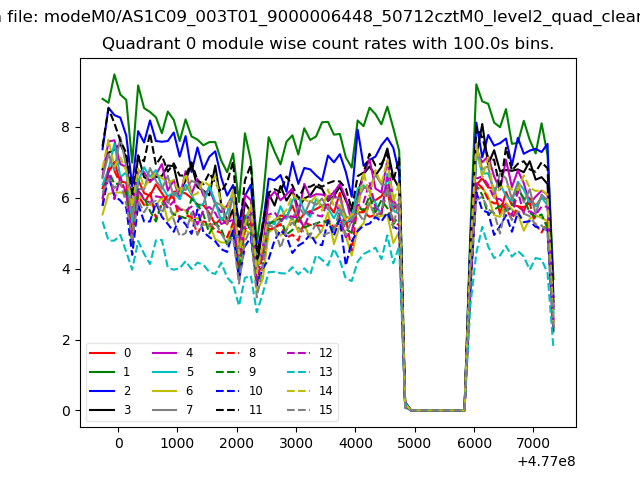 |
 |
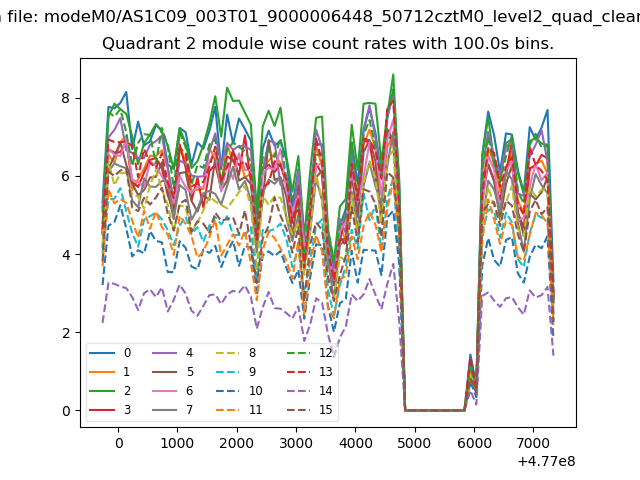
| Module-wise count rates for Quadrant B Data is divided into 100 sec bins |
 |
 |
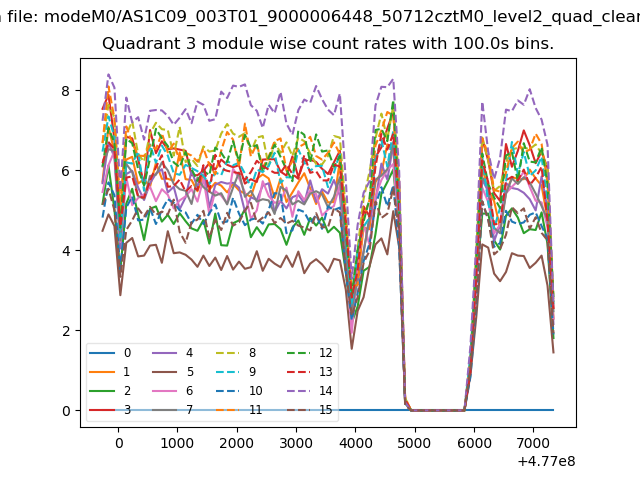
| Module-wise count rates for Quadrant C Data is divided into 100 sec bins |
 |
 |
| Module-wise count rates for Quadrant D Data is divided into 100 sec bins |
 |
 |
| Parameter | Plot |
|---|---|
| CZT HV Monitor | 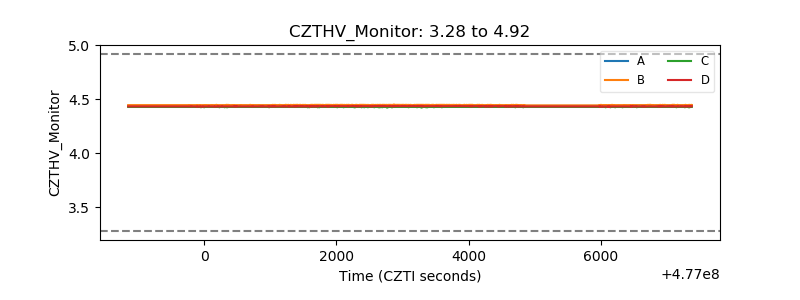 |
| D_VDD | 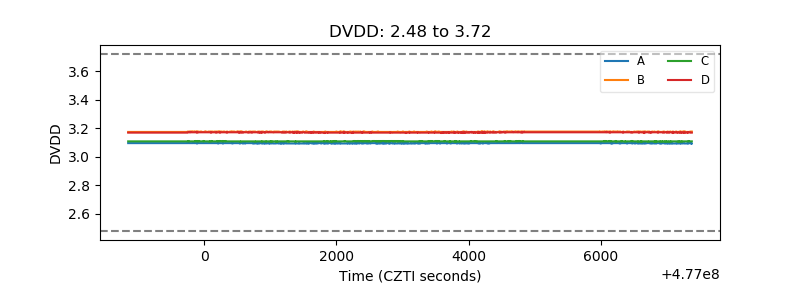 |
| Temperature 1 | 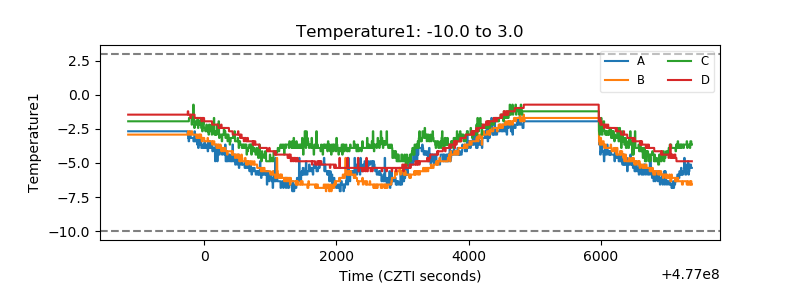 |
| Veto HV Monitor | 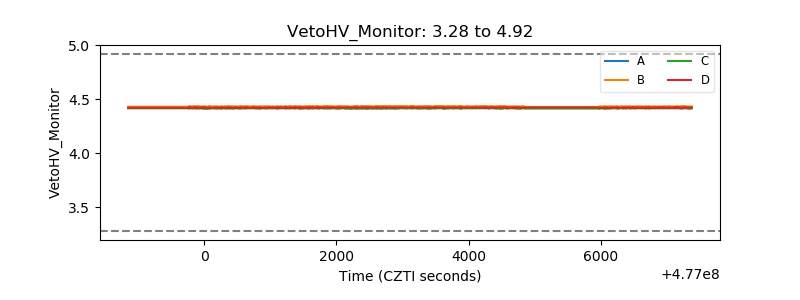 |
| Veto LLD | 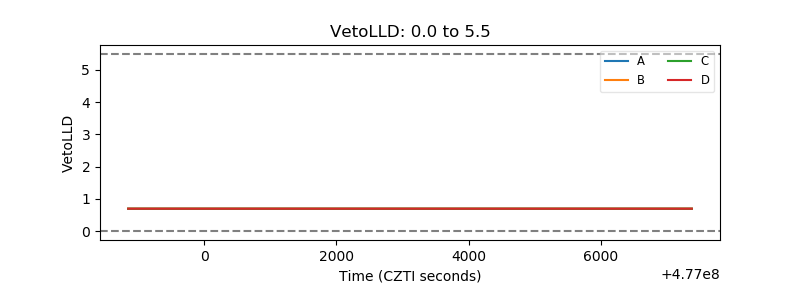 |
| Alpha Counter | 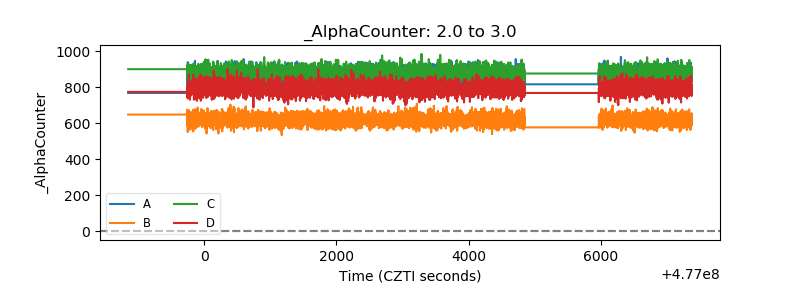 |
| _CPM_Rate | 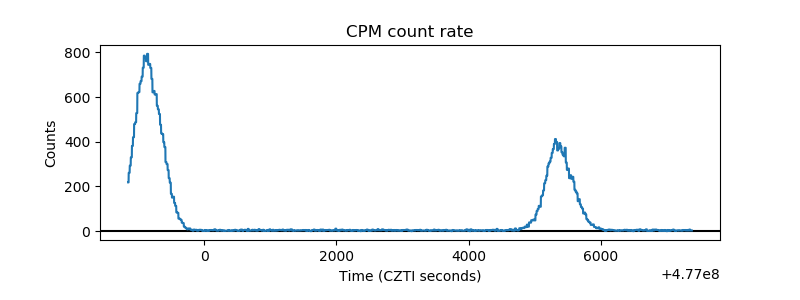 |
| CZT Counter | 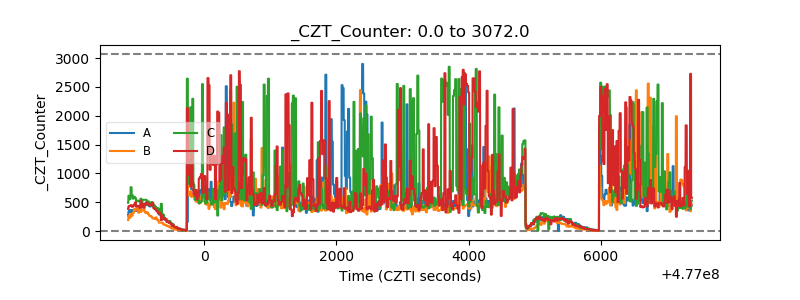 |
| +2.5 Volts monitor | 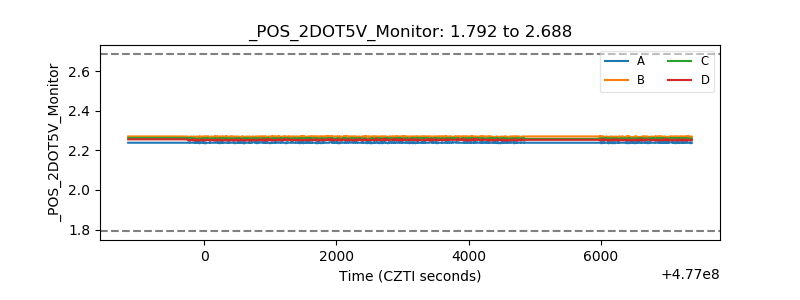 |
| +5 Volts monitor | 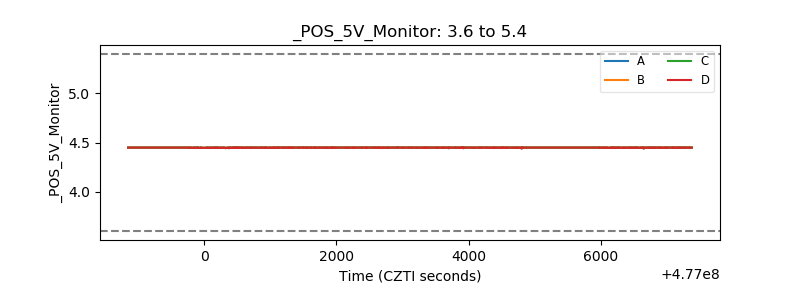 |
| _ROLL_ROT | 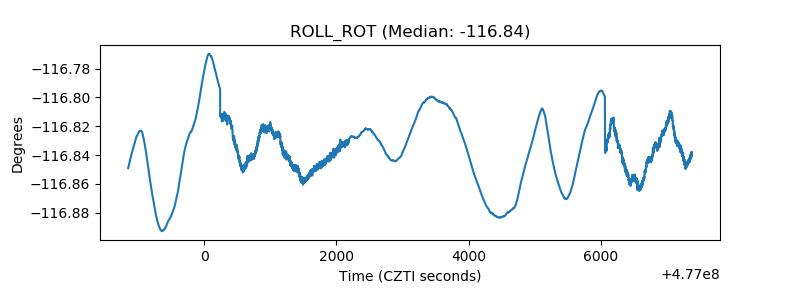 |
| _Roll_DEC | 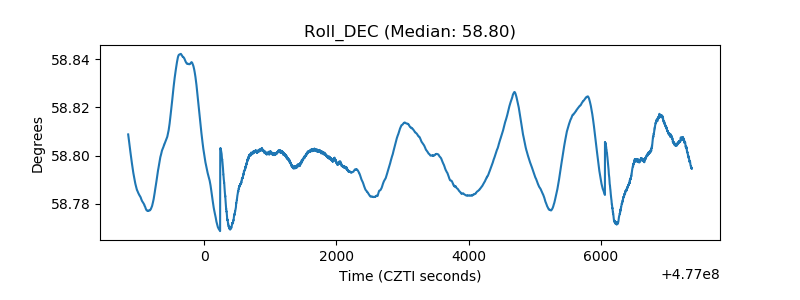 |
| _Roll_RA | 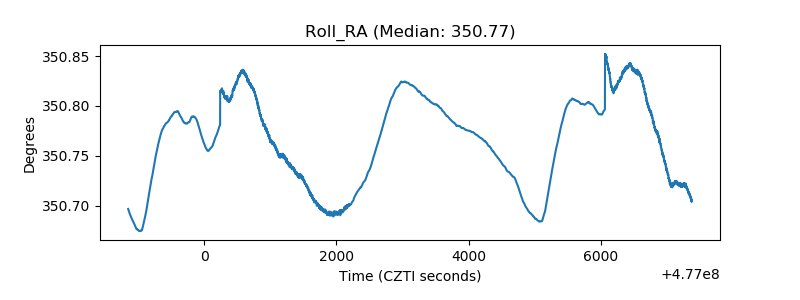 |
| Veto Counter | 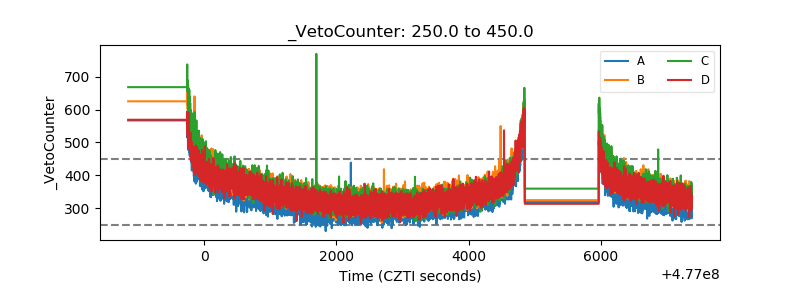 |