| Param | Original file | Final file |
|---|---|---|
| Filename | modeM0/AS1C09_003T01_9000006448_50713cztM0_level2.fits | modeM0/AS1C09_003T01_9000006448_50713cztM0_level2_quad_clean.evt |
| Size (bytes) | 697,599,360 | 92,672,640 |
| Size | 665.3 MB | 88.4 MB |
| Events in quadrant A | 4,013,164 | 649,039 |
| Events in quadrant B | 4,325,674 | 704,750 |
| Events in quadrant C | 8,730,801 | 476,931 |
| Events in quadrant D | 8,213,830 | 490,563 |
| Mode SS | |||
|---|---|---|---|
| Quadrant | BADHDUFLAG | Total packets | Discarded packets |
| A | 0 | 140 | 0 |
| B | 0 | 140 | 0 |
| C | 0 | 140 | 0 |
| D | 0 | 140 | 0 |
| Mode M9 | |||
|---|---|---|---|
| Quadrant | BADHDUFLAG | Total packets | Discarded packets |
| A | 0 | 14 | 0 |
| B | 0 | 15 | 0 |
| C | 0 | 15 | 0 |
| D | 0 | 15 | 0 |
| Mode M0 | |||
|---|---|---|---|
| Quadrant | BADHDUFLAG | Total packets | Discarded packets |
| A | 0 | 16482 | 2 |
| B | 0 | 17817 | 4 |
| C | 0 | 30792 | 2 |
| D | 0 | 29296 | 2 |
| Quadrant | Total seconds | Saturated seconds | Saturation percentage |
|---|---|---|---|
| A | 6959 | 159 | 2.284811% |
| B | 6958 | 278 | 3.995401% |
| C | 6958 | 2143 | 30.799080% |
| D | 6958 | 1512 | 21.730382% |
Noise dominated data is calculated using 1-second bins in cleaned event files. If a bin has >2000 counts, and if more than 50% of those come from <1% of pixels, then it is considered to be noise-dominated and hence unusable.
| Quadrant | # 1 sec bins | Bins with >0 counts | Bins with >2000 counts | High rate bins dominated by noise | Noise dominated (total time) | Noise dominated (detector-on time) | Marked lightcurve |
|---|---|---|---|---|---|---|---|
| A | 7914 | 6960 | 82 | 82 | 1.04% | 1.18% | 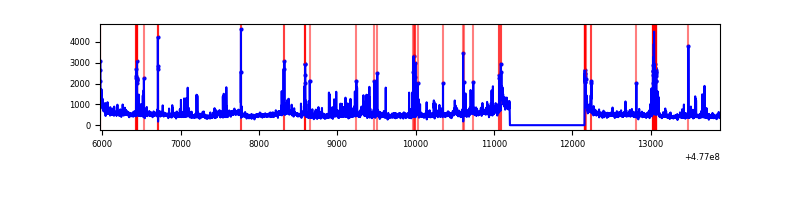 |
| B | 7913 | 6959 | 153 | 153 | 1.93% | 2.20% | 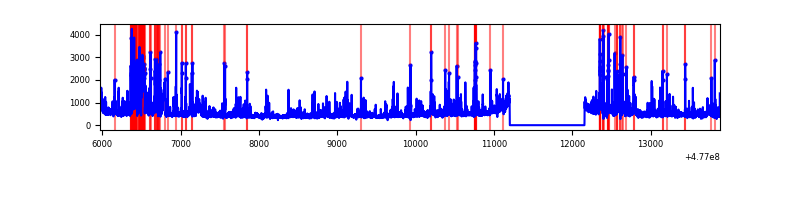 |
| C | 7913 | 6959 | 1495 | 1495 | 18.89% | 21.48% | 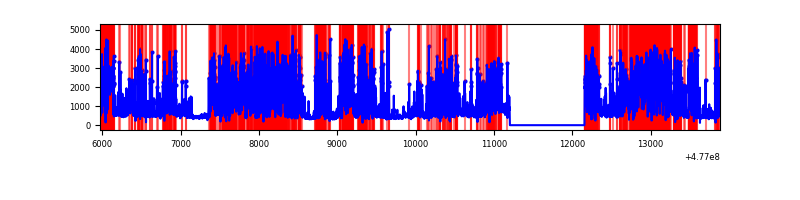 |
| D | 7913 | 6959 | 1331 | 1331 | 16.82% | 19.13% | 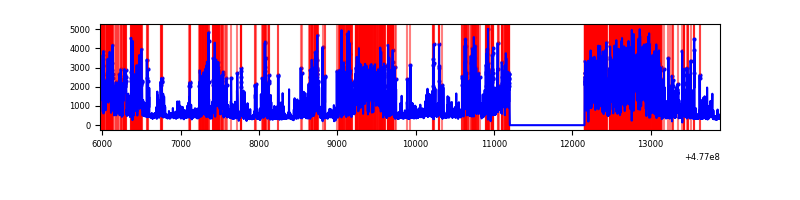 |
Top three noisy pixels from each quadrant. If the there are fewer than three noisy pixels in the level2.evt file, extra rows are filled as -1
| Pixel properties | Quadrant properties | ||||||
|---|---|---|---|---|---|---|---|
| Quadrant | DetID | PixID | Counts | Sigma | Mean | Median | Sigma |
| A | 4 | 3 | 322161 | 1775.04 | 731 | 710 | 181.1 |
| A | 9 | 191 | 254332 | 1400.49 | 731 | 710 | 181.1 |
| A | 5 | 240 | 121140 | 665.01 | 731 | 710 | 181.1 |
| B | 7 | 0 | 346562 | 2239.52 | 729 | 703 | 154.4 |
| B | 0 | 229 | 170115 | 1096.98 | 729 | 703 | 154.4 |
| B | 5 | 185 | 156354 | 1007.88 | 729 | 703 | 154.4 |
| C | 5 | 10 | 5520610 | 32584.72 | 606 | 600 | 169.4 |
| C | 4 | 5 | 164131 | 965.33 | 606 | 600 | 169.4 |
| C | 13 | 3 | 117073 | 687.54 | 606 | 600 | 169.4 |
| D | 8 | 176 | 4213301 | 23867.38 | 633 | 611 | 176.5 |
| D | 11 | 245 | 335023 | 1894.64 | 633 | 611 | 176.5 |
| D | 1 | 47 | 308876 | 1746.5 | 633 | 611 | 176.5 |
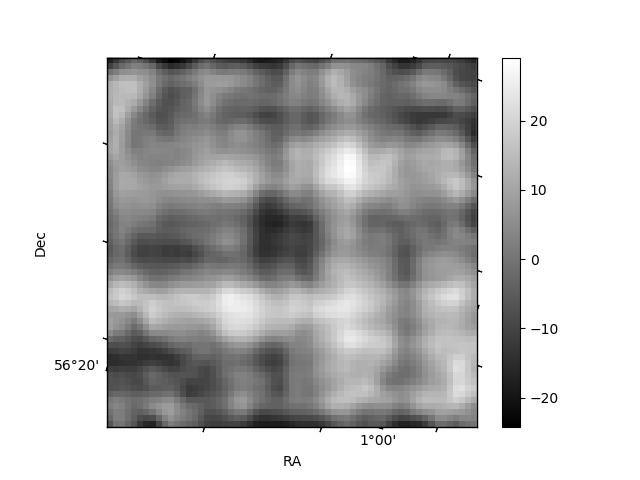
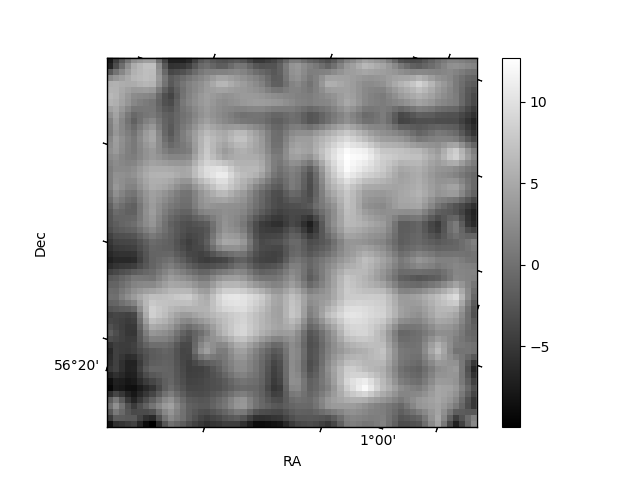
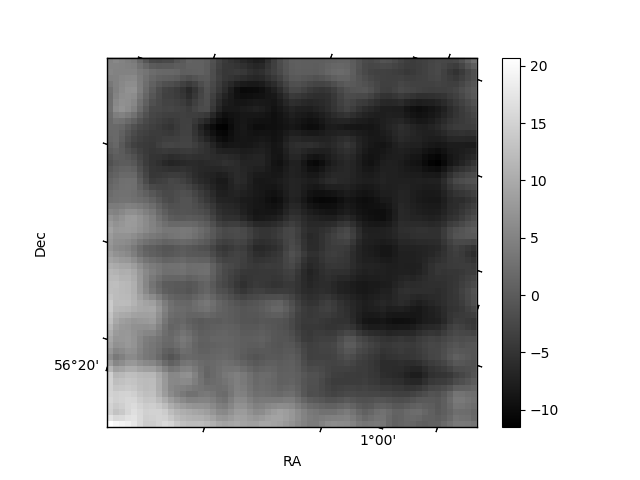
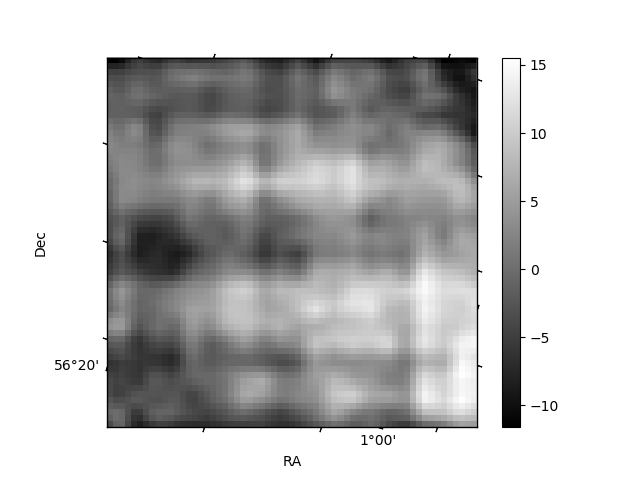
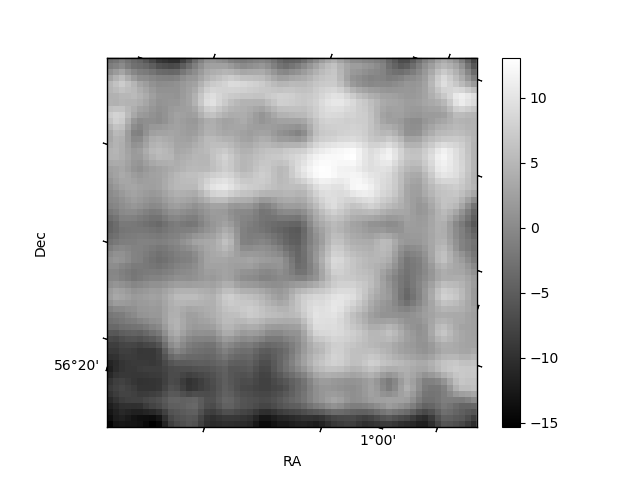
Histogram calculated using DETX and DETY for each event in the final _common_clean file
| Quadrant A | 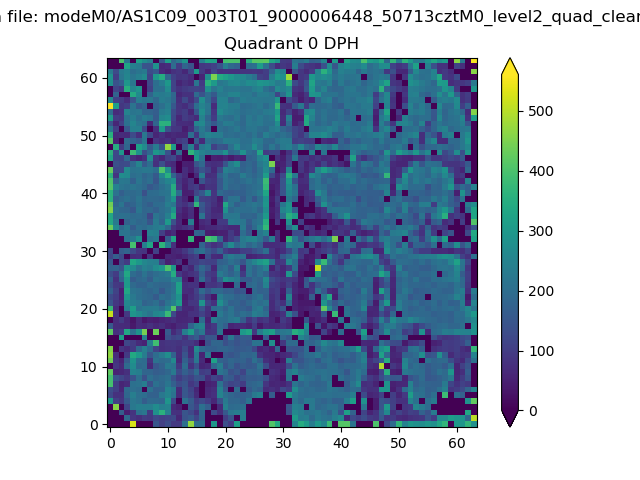 |
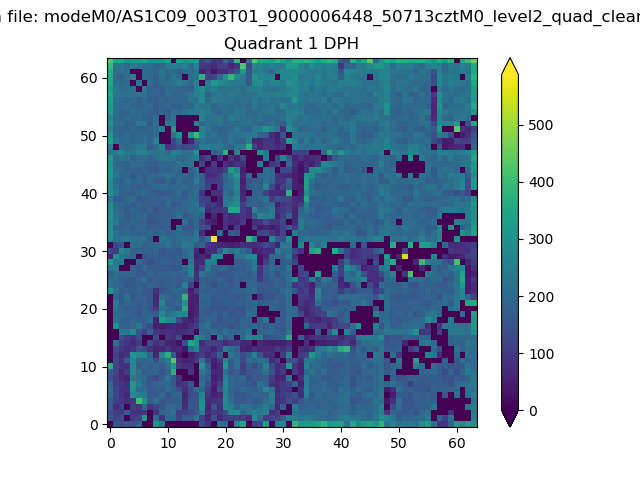 |
Quadrant B |
|---|---|---|---|
| Quadrant D | 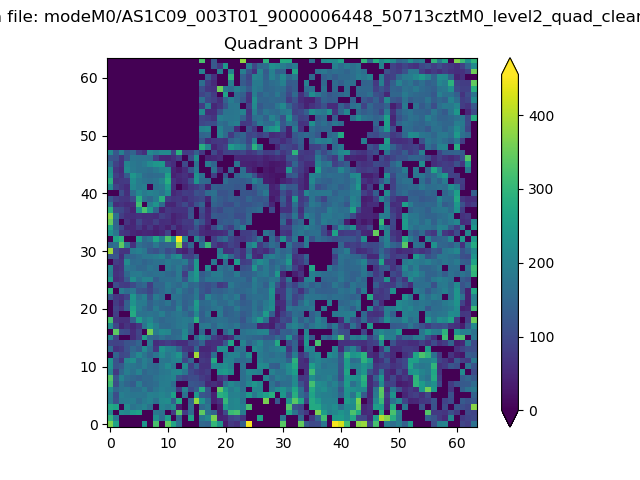 |
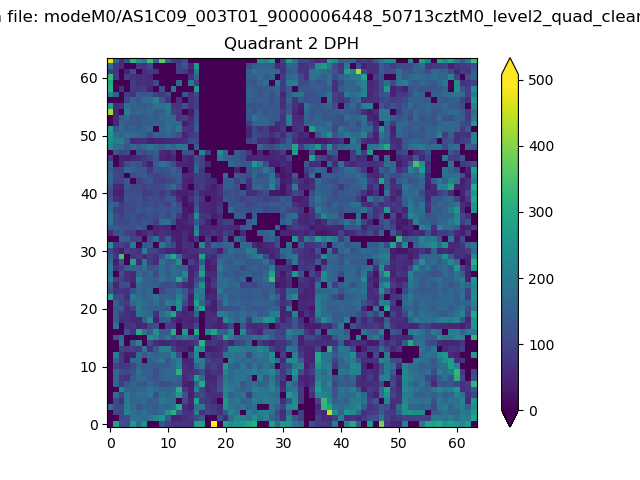 |
Quadrant C |
| Plot type | Count rate plots | Images |
|---|---|---|
| Comparison with Poisson distribution Blue bars denote a histogram of data divided into 1 sec bins. Red curve is a Poisson curve with rate = median count rate of data. |
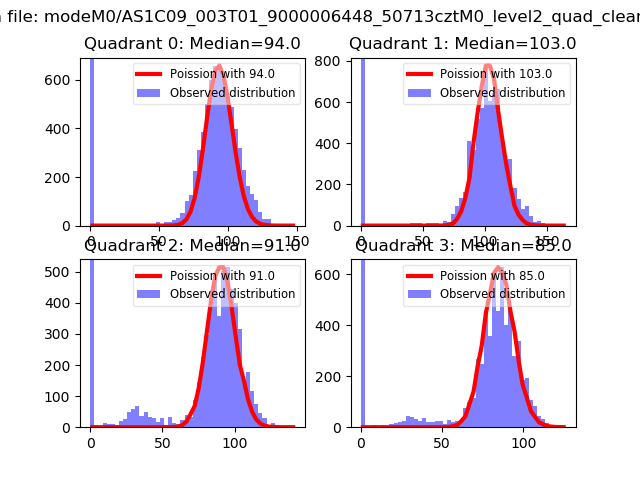 |
 |
| Quadrant-wise count rates Data is divided into 100 sec bins |
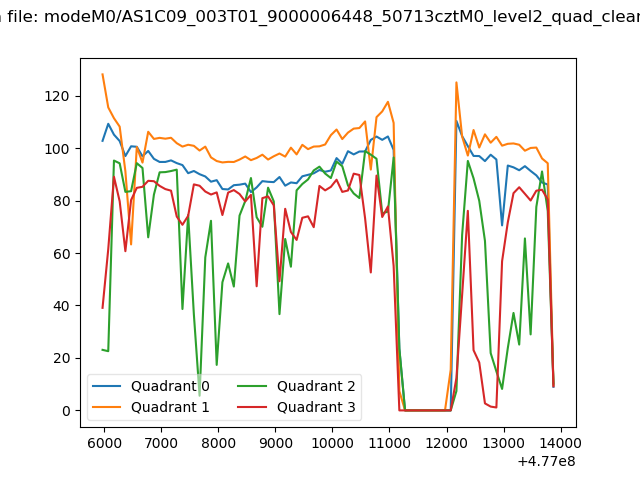 |
|
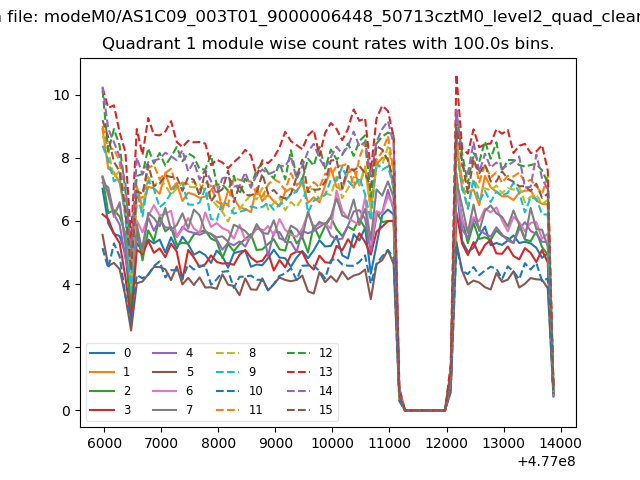
| Module-wise count rates for Quadrant A Data is divided into 100 sec bins |
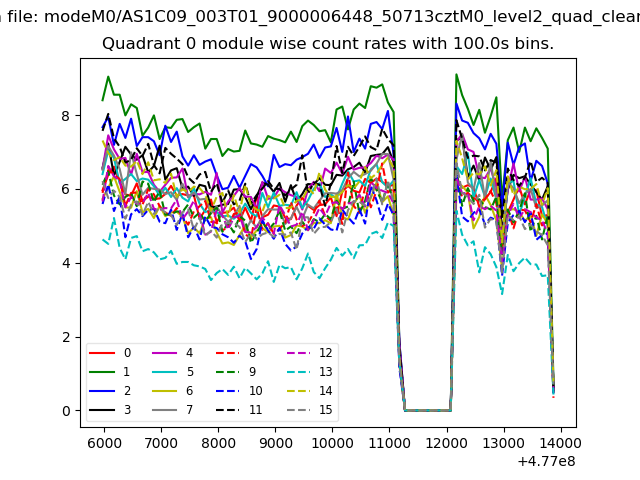 |
 |
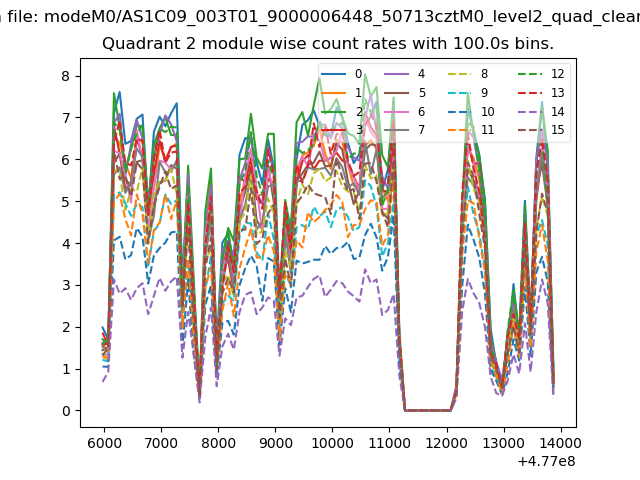
| Module-wise count rates for Quadrant B Data is divided into 100 sec bins |
 |
 |
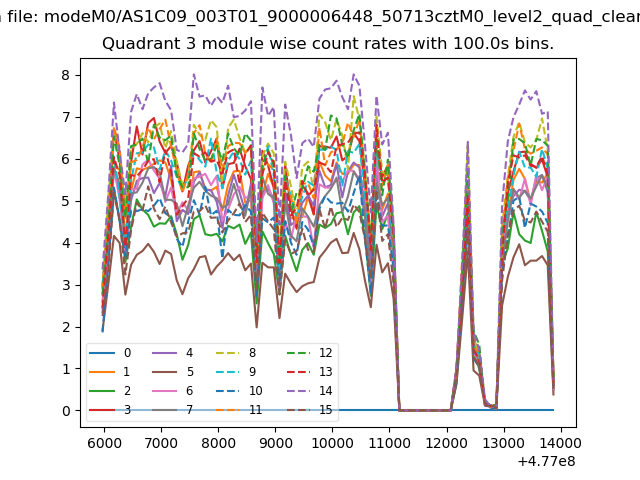
| Module-wise count rates for Quadrant C Data is divided into 100 sec bins |
 |
 |
| Module-wise count rates for Quadrant D Data is divided into 100 sec bins |
 |
 |
| Parameter | Plot |
|---|---|
| CZT HV Monitor | 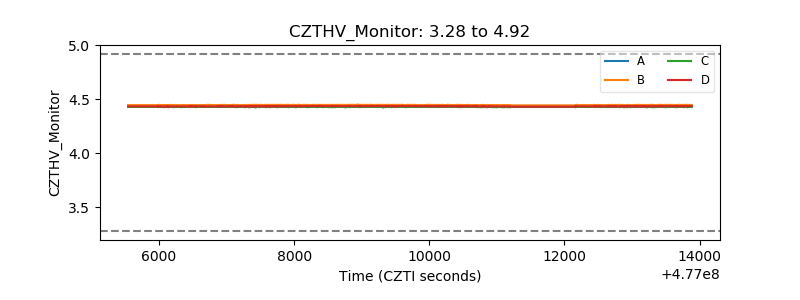 |
| D_VDD | 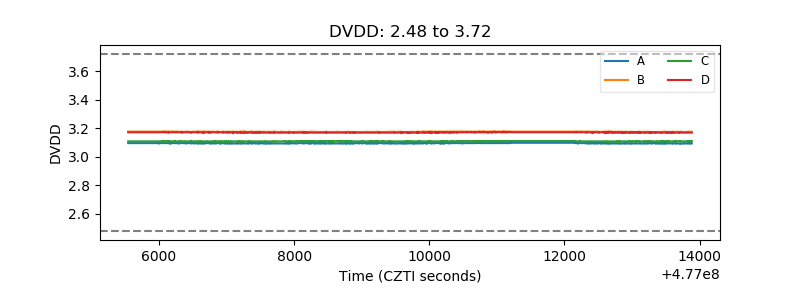 |
| Temperature 1 | 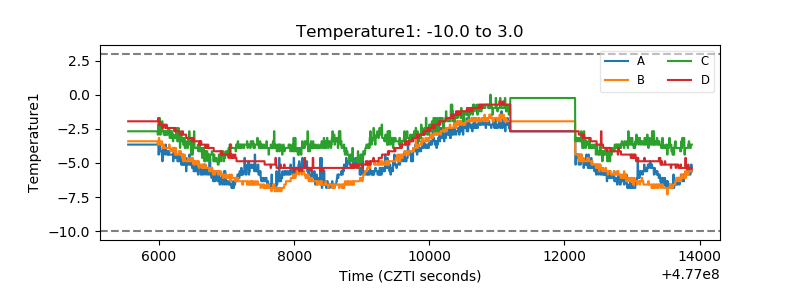 |
| Veto HV Monitor | 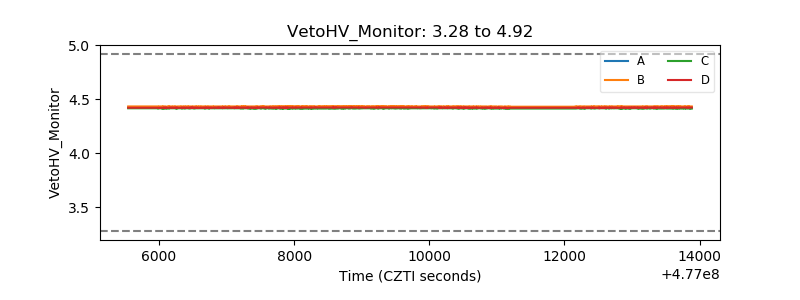 |
| Veto LLD | 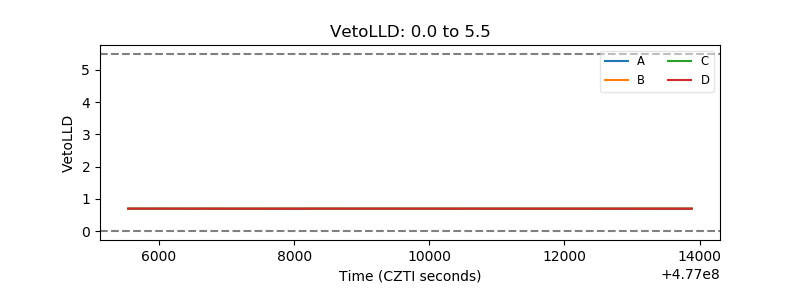 |
| Alpha Counter | 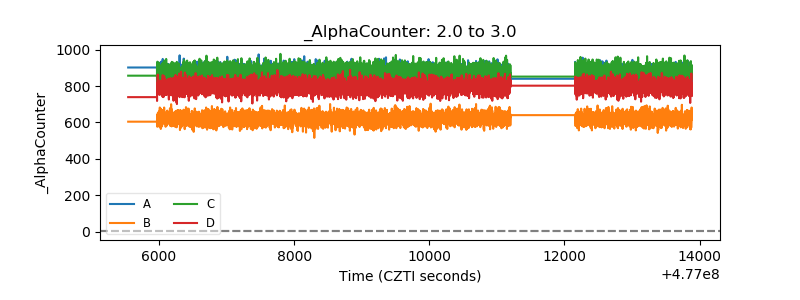 |
| _CPM_Rate | 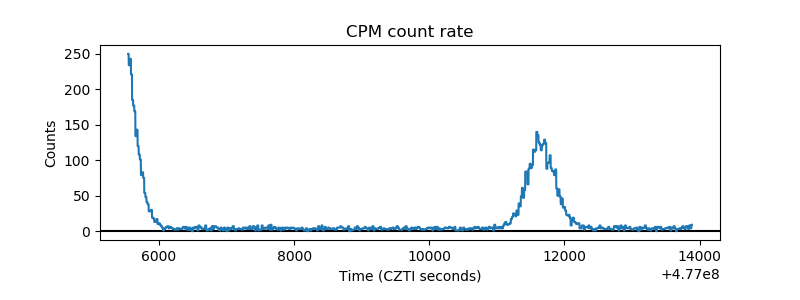 |
| CZT Counter | 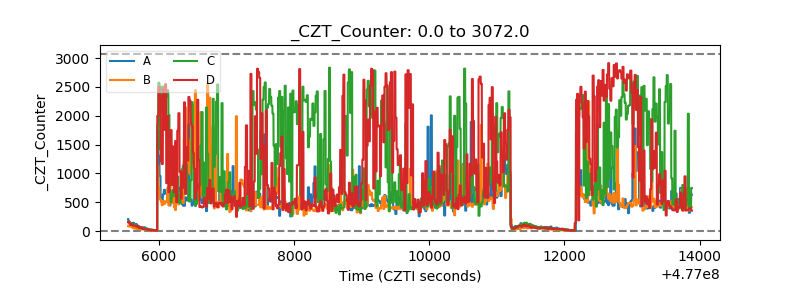 |
| +2.5 Volts monitor | 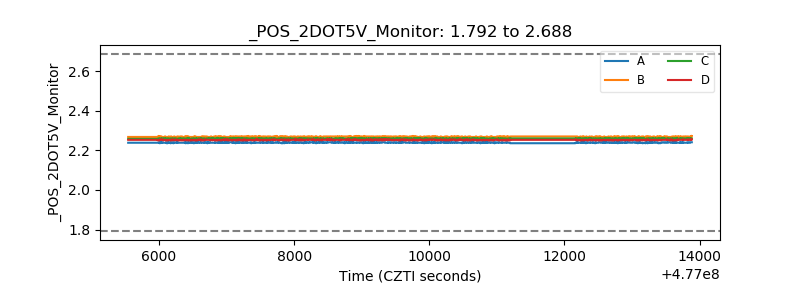 |
| +5 Volts monitor | 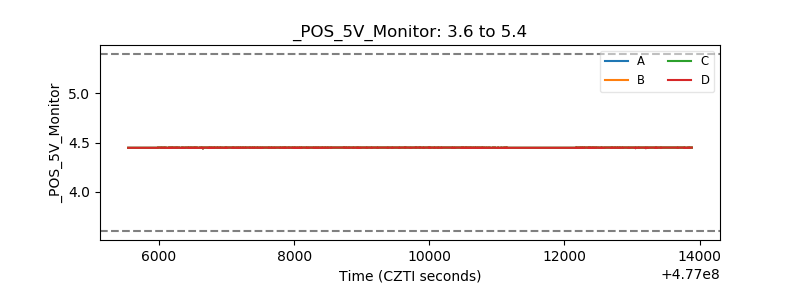 |
| _ROLL_ROT | 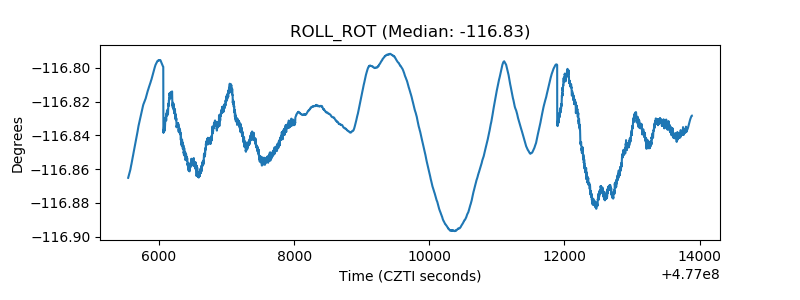 |
| _Roll_DEC | 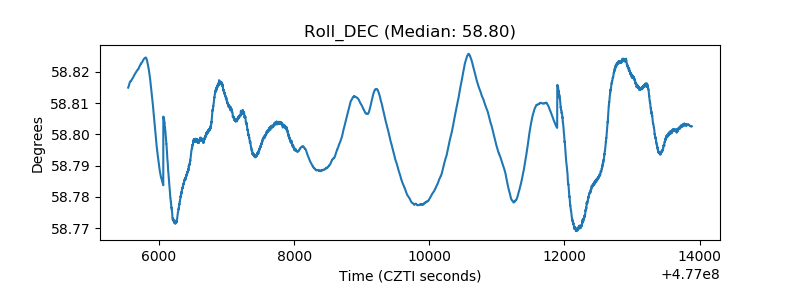 |
| _Roll_RA | 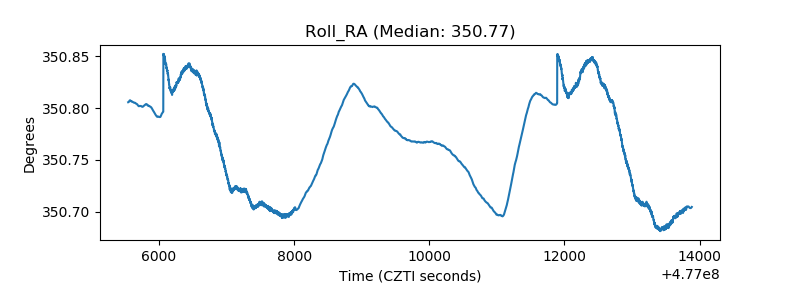 |
| Veto Counter | 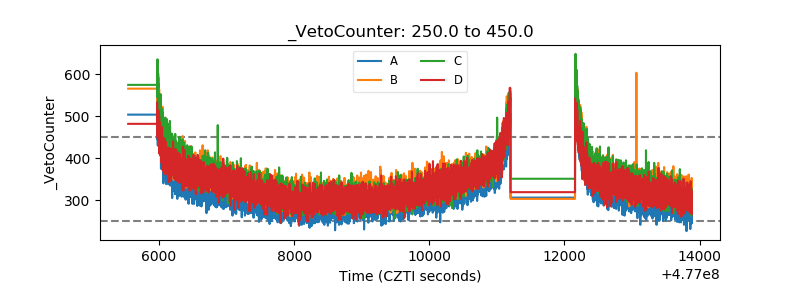 |