| Param | Original file | Final file |
|---|---|---|
| Filename | modeM0/AS1C09_003T01_9000006448_50714cztM0_level2.fits | modeM0/AS1C09_003T01_9000006448_50714cztM0_level2_quad_clean.evt |
| Size (bytes) | 658,272,960 | 96,154,560 |
| Size | 627.8 MB | 91.7 MB |
| Events in quadrant A | 5,036,956 | 626,290 |
| Events in quadrant B | 4,123,692 | 722,621 |
| Events in quadrant C | 6,584,299 | 560,176 |
| Events in quadrant D | 8,061,891 | 499,253 |
| Mode SS | |||
|---|---|---|---|
| Quadrant | BADHDUFLAG | Total packets | Discarded packets |
| A | 0 | 148 | 2 |
| B | 0 | 147 | 1 |
| C | 0 | 148 | 0 |
| D | 0 | 149 | 1 |
| Mode M9 | |||
|---|---|---|---|
| Quadrant | BADHDUFLAG | Total packets | Discarded packets |
| A | 0 | 5 | 0 |
| B | 0 | 5 | 0 |
| C | 0 | 5 | 0 |
| D | 0 | 5 | 0 |
| Mode M0 | |||
|---|---|---|---|
| Quadrant | BADHDUFLAG | Total packets | Discarded packets |
| A | 0 | 20159 | 304 |
| B | 0 | 17754 | 342 |
| C | 0 | 25276 | 582 |
| D | 0 | 29443 | 300 |
| Quadrant | Total seconds | Saturated seconds | Saturation percentage |
|---|---|---|---|
| A | 7222 | 537 | 7.435613% |
| B | 7216 | 236 | 3.270510% |
| C | 7214 | 1326 | 18.380926% |
| D | 7229 | 1542 | 21.330751% |
Noise dominated data is calculated using 1-second bins in cleaned event files. If a bin has >2000 counts, and if more than 50% of those come from <1% of pixels, then it is considered to be noise-dominated and hence unusable.
| Quadrant | # 1 sec bins | Bins with >0 counts | Bins with >2000 counts | High rate bins dominated by noise | Noise dominated (total time) | Noise dominated (detector-on time) | Marked lightcurve |
|---|---|---|---|---|---|---|---|
| A | 7915 | 7279 | 334 | 334 | 4.22% | 4.59% | 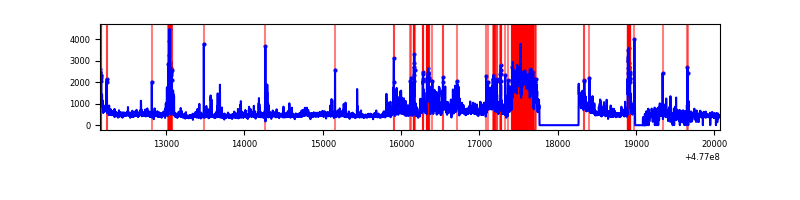 |
| B | 7915 | 7267 | 93 | 93 | 1.17% | 1.28% | 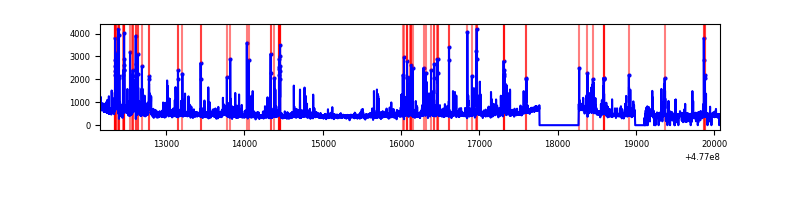 |
| C | 7915 | 7270 | 841 | 841 | 10.63% | 11.57% | 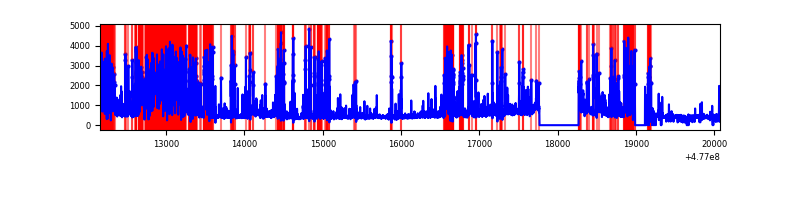 |
| D | 7914 | 7282 | 1279 | 1279 | 16.16% | 17.56% | 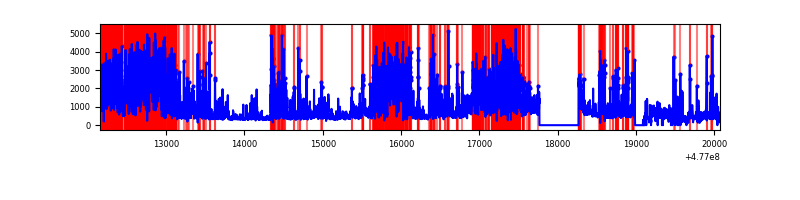 |
Top three noisy pixels from each quadrant. If the there are fewer than three noisy pixels in the level2.evt file, extra rows are filled as -1
| Pixel properties | Quadrant properties | ||||||
|---|---|---|---|---|---|---|---|
| Quadrant | DetID | PixID | Counts | Sigma | Mean | Median | Sigma |
| A | 12 | 80 | 865218 | 4615.94 | 752 | 732 | 187.3 |
| A | 9 | 191 | 306305 | 1631.61 | 752 | 732 | 187.3 |
| A | 4 | 3 | 166193 | 883.48 | 752 | 732 | 187.3 |
| B | 0 | 229 | 181352 | 1117.89 | 766 | 739 | 161.6 |
| B | 1 | 207 | 113769 | 699.59 | 766 | 739 | 161.6 |
| B | 0 | 213 | 106141 | 652.38 | 766 | 739 | 161.6 |
| C | 5 | 10 | 2879423 | 15290.95 | 680 | 673 | 188.3 |
| C | 13 | 3 | 126259 | 667.07 | 680 | 673 | 188.3 |
| C | 15 | 231 | 107113 | 565.37 | 680 | 673 | 188.3 |
| D | 8 | 176 | 3782931 | 20572.75 | 668 | 646 | 183.8 |
| D | 2 | 249 | 867475 | 4714.89 | 668 | 646 | 183.8 |
| D | 11 | 245 | 230249 | 1248.87 | 668 | 646 | 183.8 |
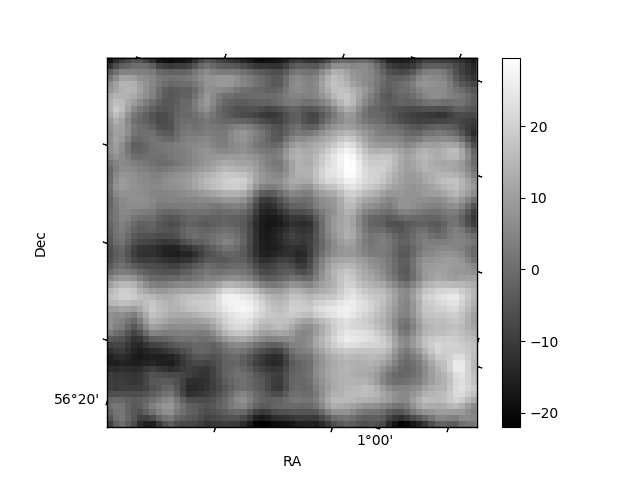
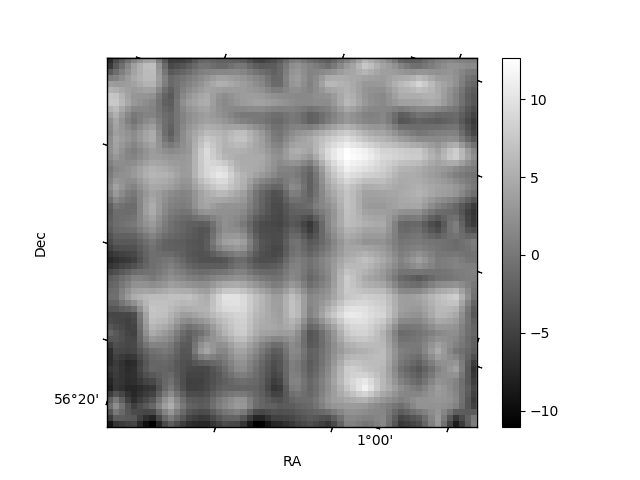
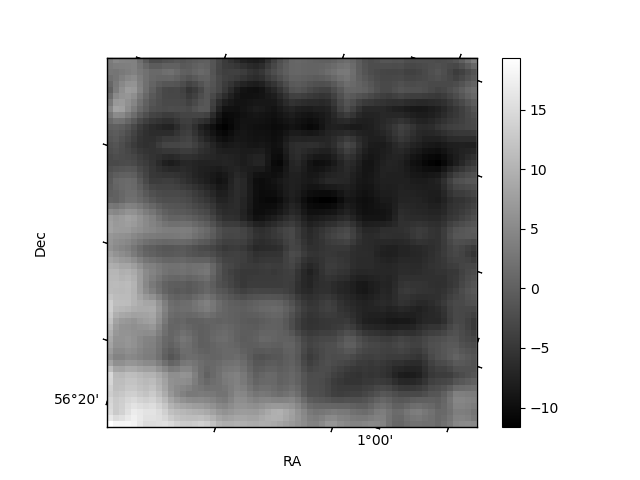
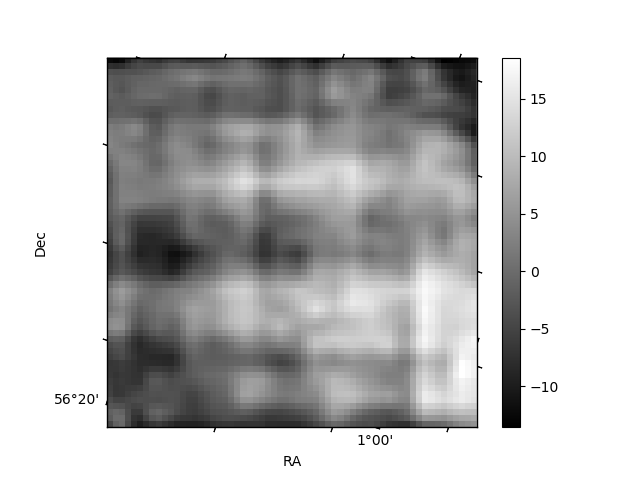
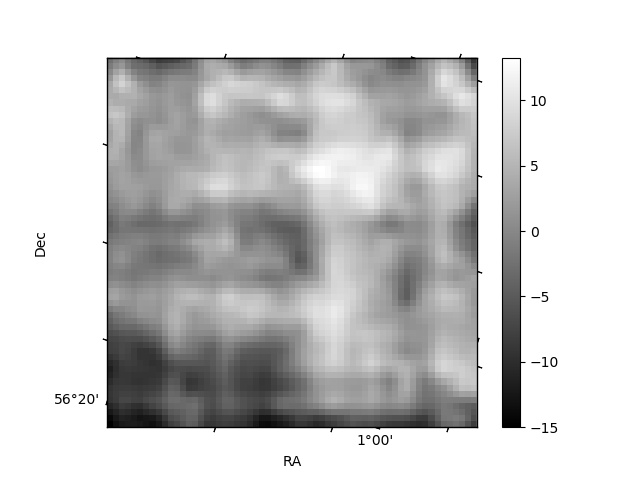
Histogram calculated using DETX and DETY for each event in the final _common_clean file
| Quadrant A | 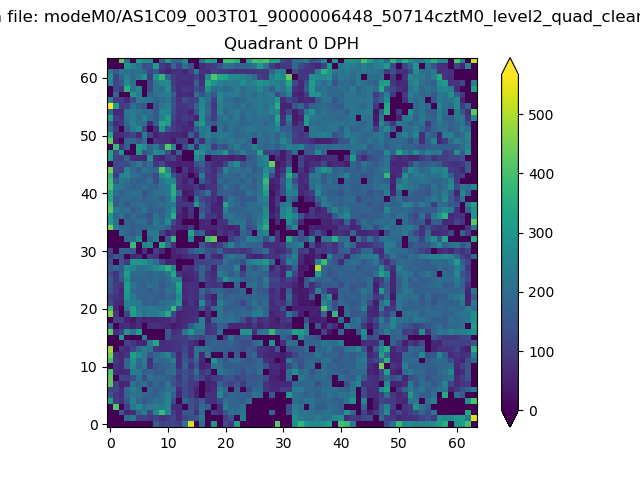 |
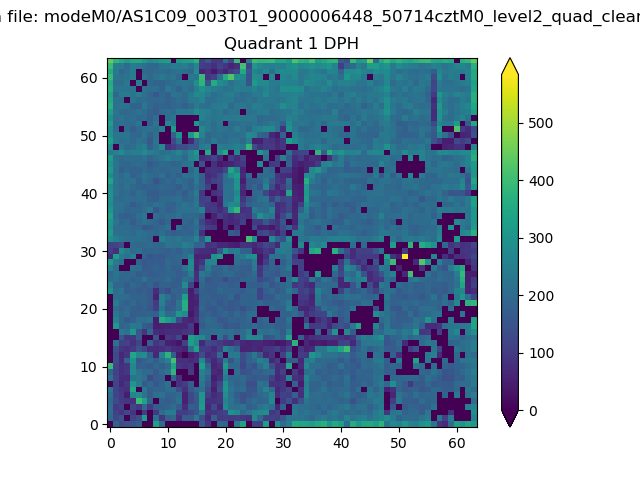 |
Quadrant B |
|---|---|---|---|
| Quadrant D | 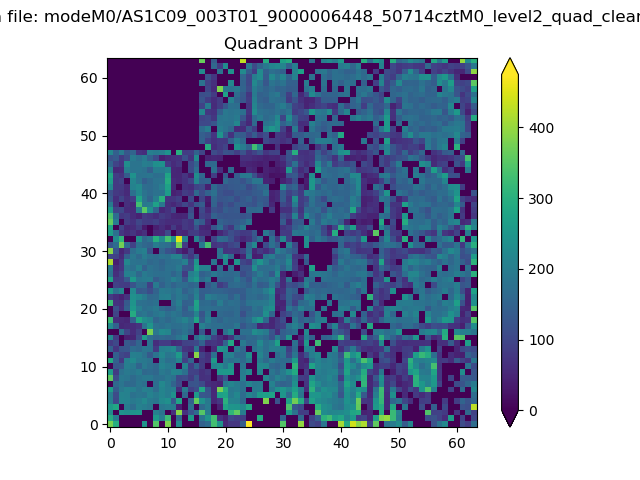 |
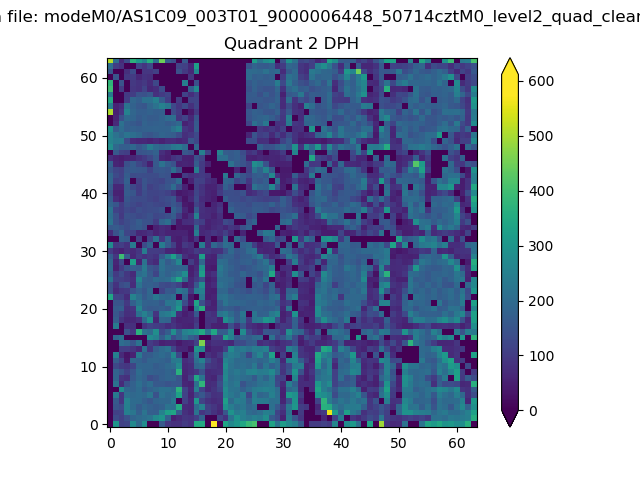 |
Quadrant C |
| Plot type | Count rate plots | Images |
|---|---|---|
| Comparison with Poisson distribution Blue bars denote a histogram of data divided into 1 sec bins. Red curve is a Poisson curve with rate = median count rate of data. |
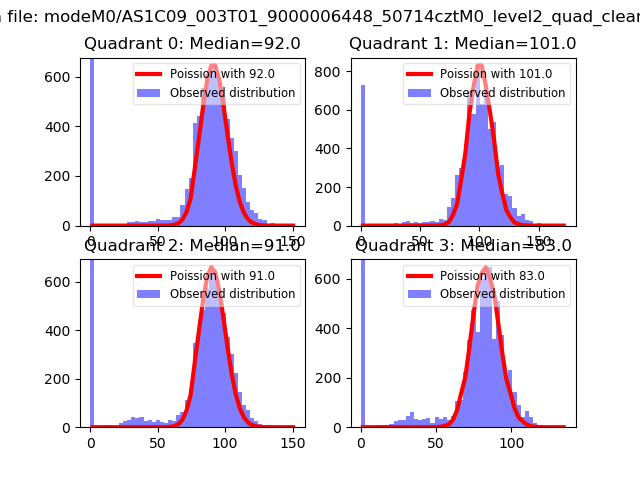 |
 |
| Quadrant-wise count rates Data is divided into 100 sec bins |
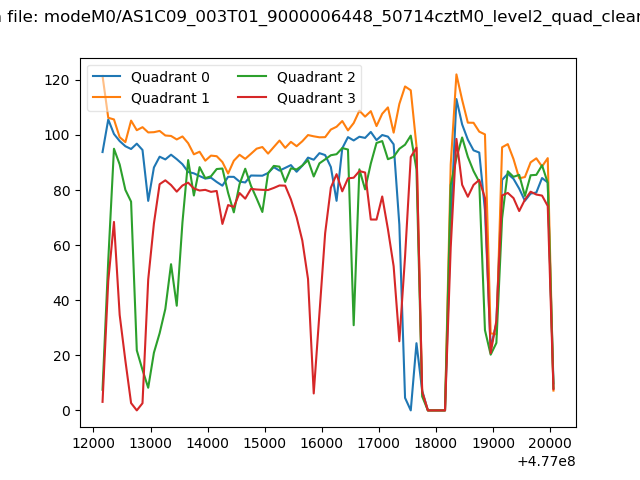 |
|
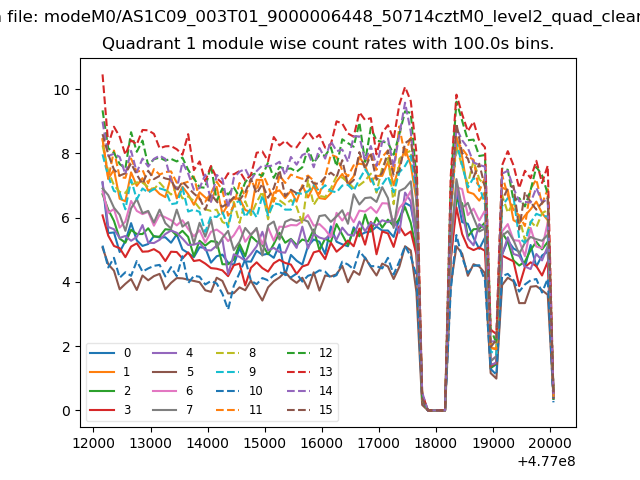
| Module-wise count rates for Quadrant A Data is divided into 100 sec bins |
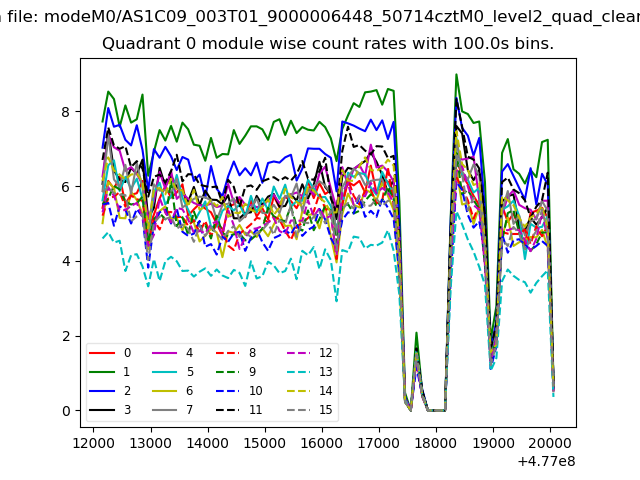 |
 |
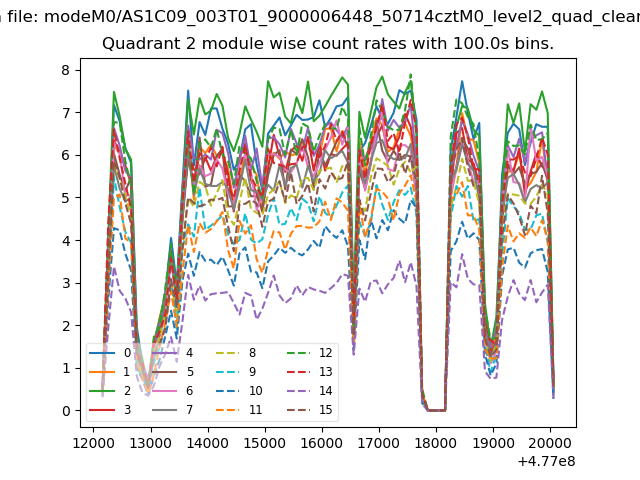
| Module-wise count rates for Quadrant B Data is divided into 100 sec bins |
 |
 |
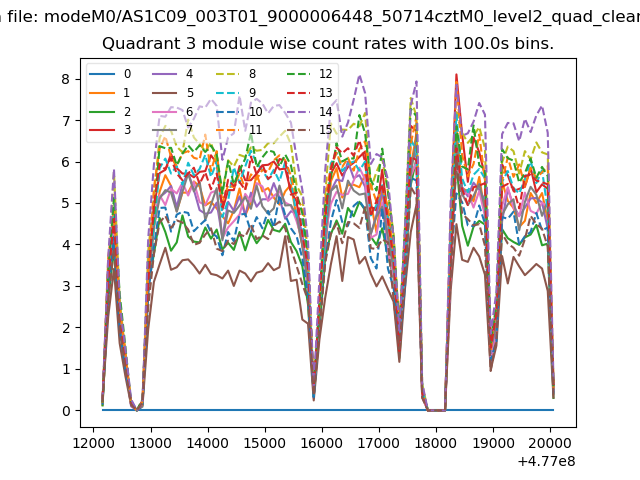
| Module-wise count rates for Quadrant C Data is divided into 100 sec bins |
 |
 |
| Module-wise count rates for Quadrant D Data is divided into 100 sec bins |
 |
 |
| Parameter | Plot |
|---|---|
| CZT HV Monitor | 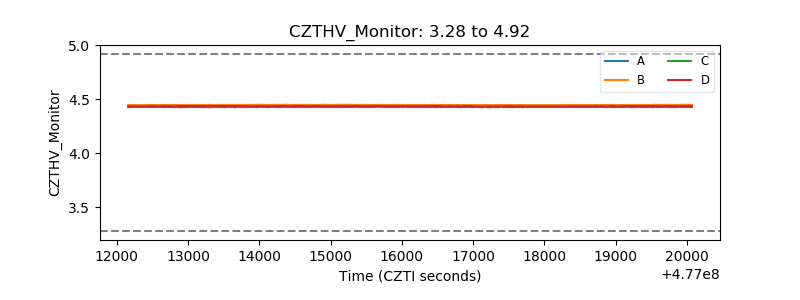 |
| D_VDD | 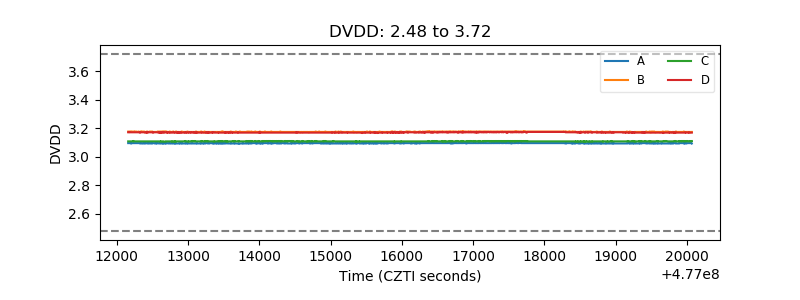 |
| Temperature 1 | 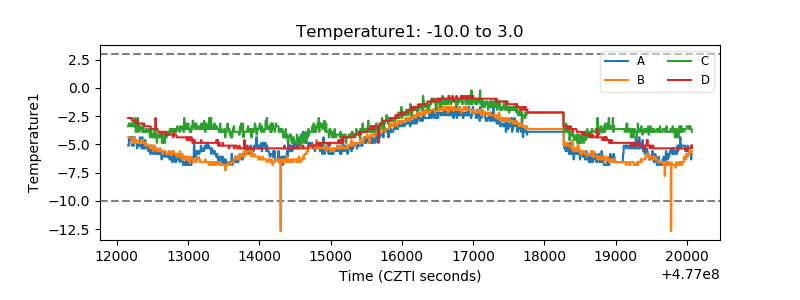 |
| Veto HV Monitor | 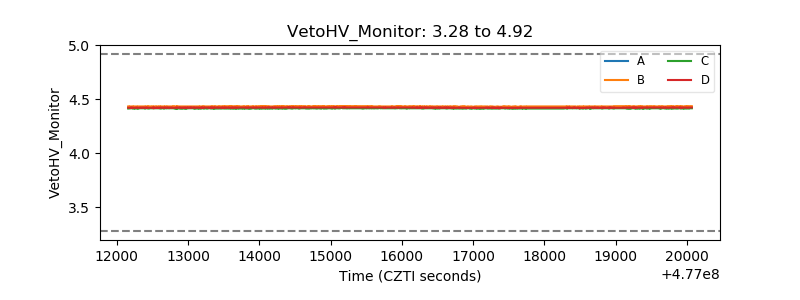 |
| Veto LLD | 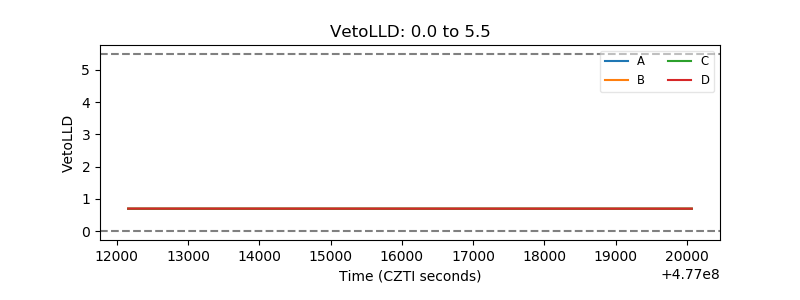 |
| Alpha Counter | 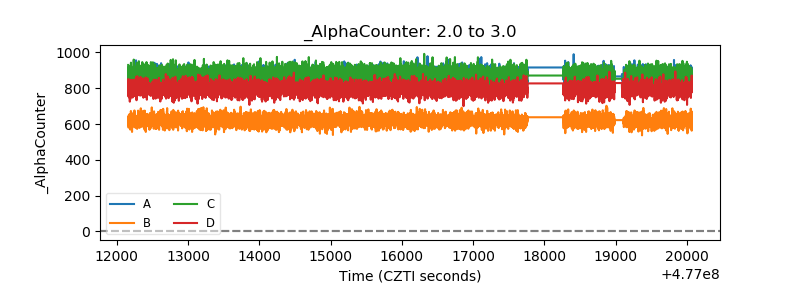 |
| _CPM_Rate | 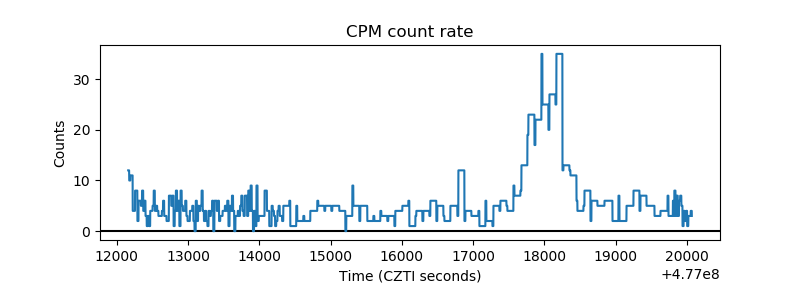 |
| CZT Counter | 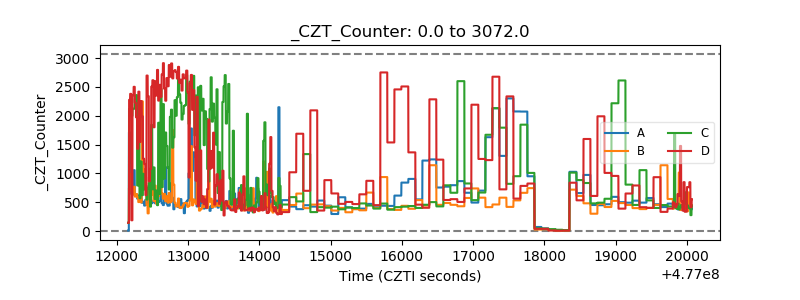 |
| +2.5 Volts monitor | 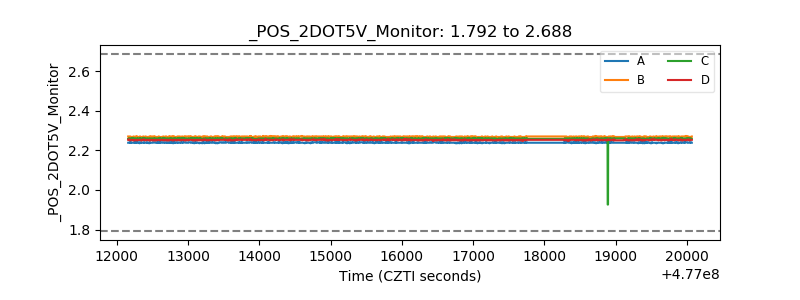 |
| +5 Volts monitor | 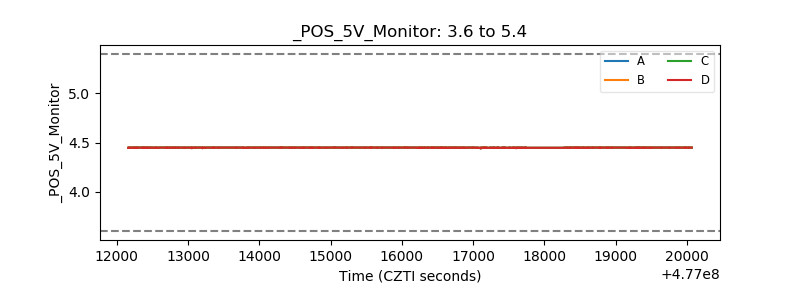 |
| _ROLL_ROT | 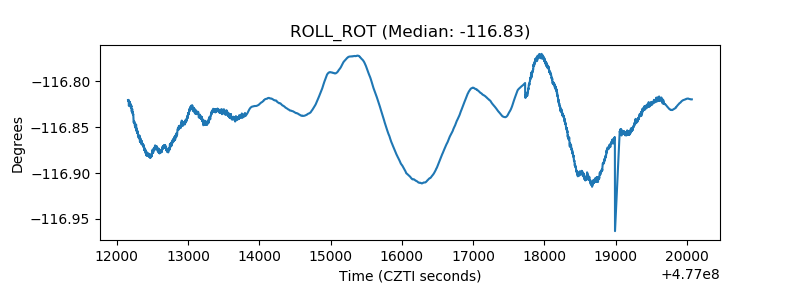 |
| _Roll_DEC | 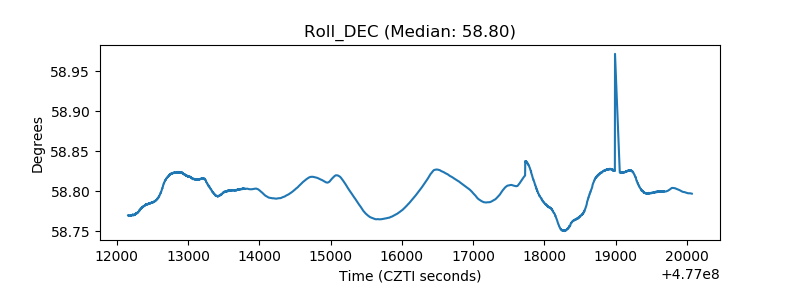 |
| _Roll_RA | 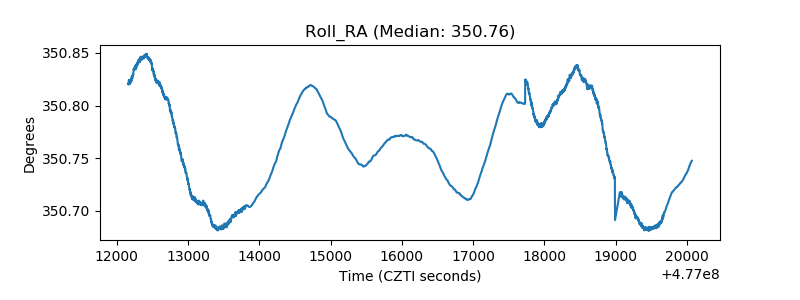 |
| Veto Counter | 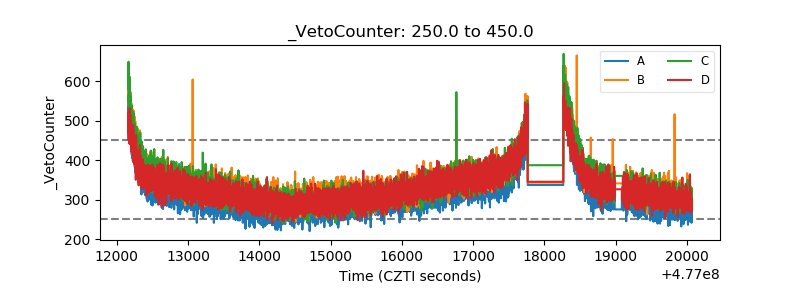 |