| Param | Original file | Final file |
|---|---|---|
| Filename | modeM0/AS1C09_003T01_9000006448_50715cztM0_level2.fits | modeM0/AS1C09_003T01_9000006448_50715cztM0_level2_quad_clean.evt |
| Size (bytes) | 650,609,280 | 108,221,760 |
| Size | 620.5 MB | 103.2 MB |
| Events in quadrant A | 4,676,356 | 717,922 |
| Events in quadrant B | 4,157,557 | 789,785 |
| Events in quadrant C | 6,466,717 | 653,057 |
| Events in quadrant D | 8,180,895 | 575,759 |
| Mode SS | |||
|---|---|---|---|
| Quadrant | BADHDUFLAG | Total packets | Discarded packets |
| A | 0 | 154 | 0 |
| B | 0 | 154 | 0 |
| C | 0 | 154 | 0 |
| D | 0 | 156 | 0 |
| Mode M0 | |||
|---|---|---|---|
| Quadrant | BADHDUFLAG | Total packets | Discarded packets |
| A | 0 | 19151 | 0 |
| B | 0 | 17865 | 0 |
| C | 0 | 24667 | 0 |
| D | 0 | 29716 | 0 |
| Quadrant | Total seconds | Saturated seconds | Saturation percentage |
|---|---|---|---|
| A | 7768 | 81 | 1.042739% |
| B | 7768 | 99 | 1.274459% |
| C | 7768 | 825 | 10.620494% |
| D | 7768 | 1250 | 16.091658% |
Noise dominated data is calculated using 1-second bins in cleaned event files. If a bin has >2000 counts, and if more than 50% of those come from <1% of pixels, then it is considered to be noise-dominated and hence unusable.
| Quadrant | # 1 sec bins | Bins with >0 counts | Bins with >2000 counts | High rate bins dominated by noise | Noise dominated (total time) | Noise dominated (detector-on time) | Marked lightcurve |
|---|---|---|---|---|---|---|---|
| A | 7768 | 7768 | 67 | 67 | 0.86% | 0.86% | 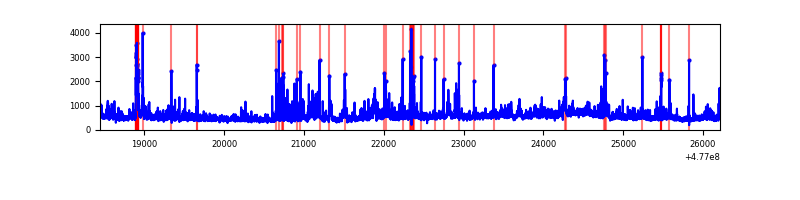 |
| B | 7768 | 7768 | 52 | 52 | 0.67% | 0.67% | 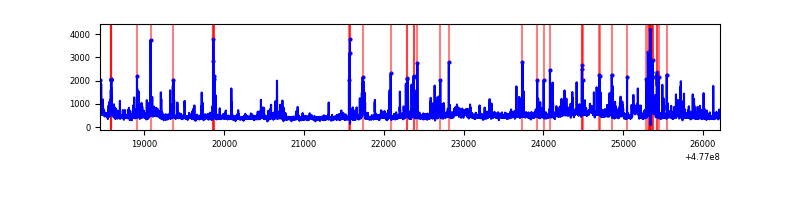 |
| C | 7768 | 7768 | 559 | 559 | 7.20% | 7.20% | 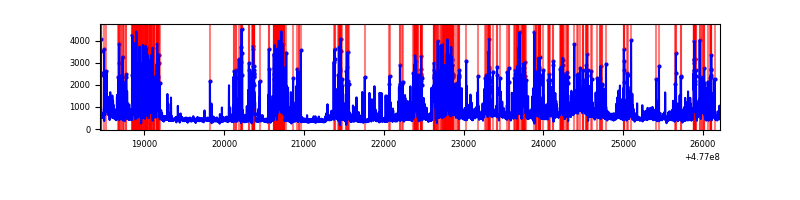 |
| D | 7768 | 7768 | 1089 | 1089 | 14.02% | 14.02% | 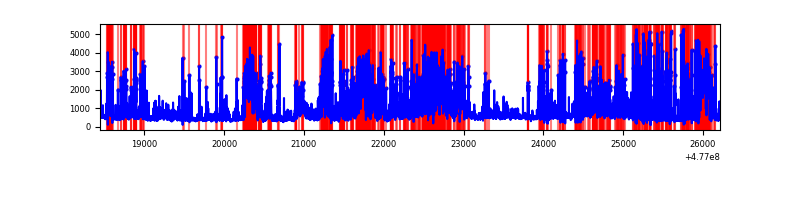 |
Top three noisy pixels from each quadrant. If the there are fewer than three noisy pixels in the level2.evt file, extra rows are filled as -1
| Pixel properties | Quadrant properties | ||||||
|---|---|---|---|---|---|---|---|
| Quadrant | DetID | PixID | Counts | Sigma | Mean | Median | Sigma |
| A | 9 | 191 | 423595 | 2091.42 | 816 | 796 | 202.2 |
| A | 3 | 161 | 154149 | 758.58 | 816 | 796 | 202.2 |
| A | 5 | 240 | 134532 | 661.54 | 816 | 796 | 202.2 |
| B | 0 | 213 | 157061 | 913.17 | 819 | 791 | 171.1 |
| B | 10 | 60 | 90756 | 525.71 | 819 | 791 | 171.1 |
| B | 8 | 128 | 85141 | 492.9 | 819 | 791 | 171.1 |
| C | 5 | 10 | 1629325 | 7535.36 | 777 | 770 | 216.1 |
| C | 0 | 177 | 361345 | 1668.39 | 777 | 770 | 216.1 |
| C | 13 | 3 | 227640 | 1049.73 | 777 | 770 | 216.1 |
| D | 8 | 176 | 2089764 | 10152.54 | 743 | 717 | 205.8 |
| D | 2 | 249 | 1462969 | 7106.39 | 743 | 717 | 205.8 |
| D | 0 | 18 | 589959 | 2863.65 | 743 | 717 | 205.8 |
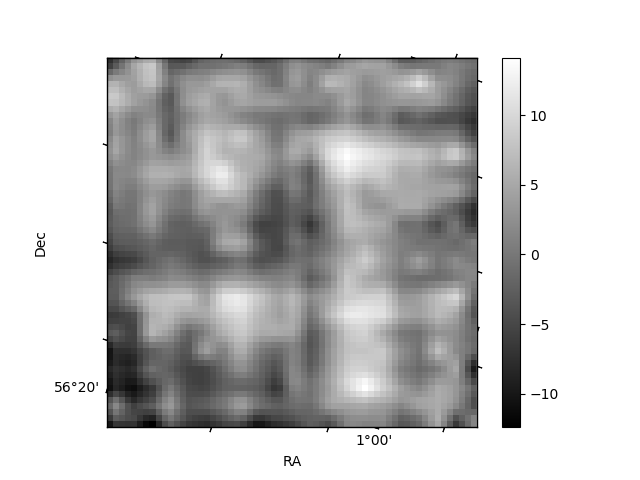
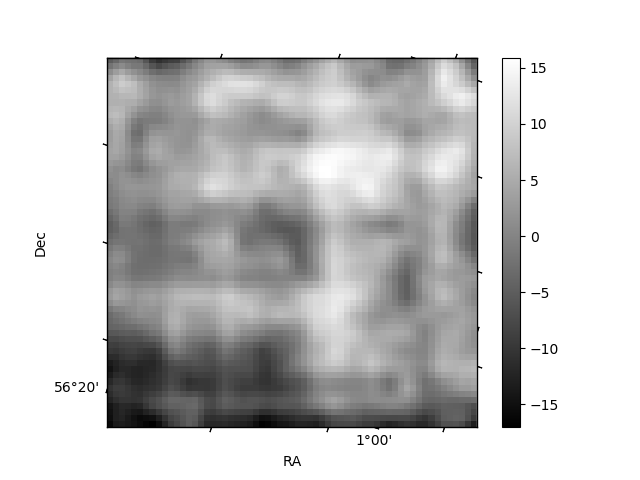
Histogram calculated using DETX and DETY for each event in the final _common_clean file
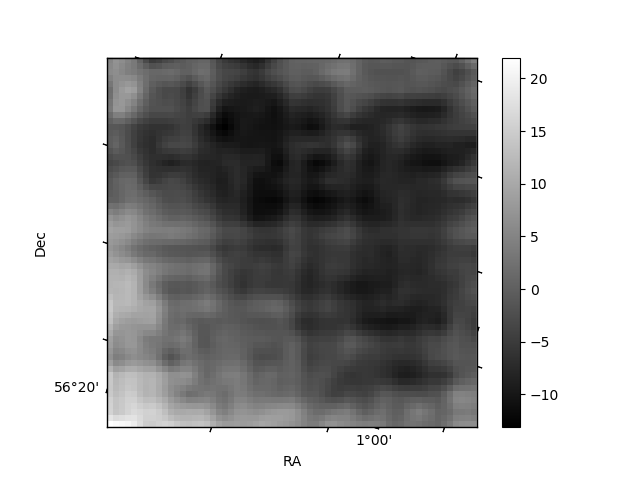
| Quadrant A | 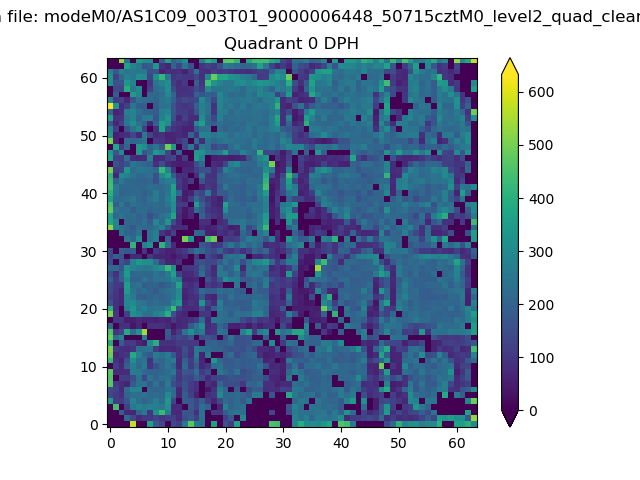 |
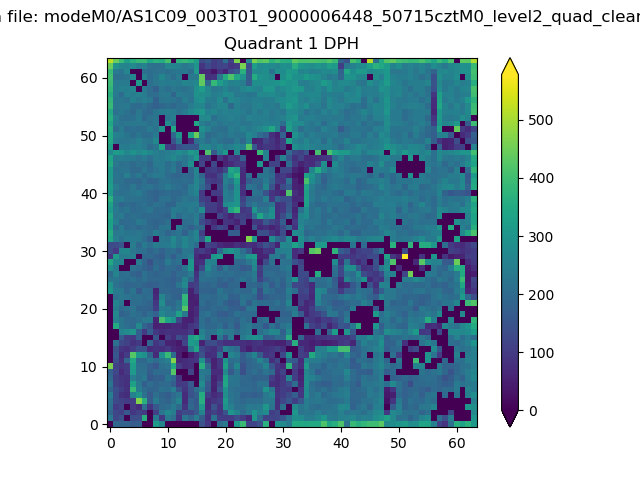 |
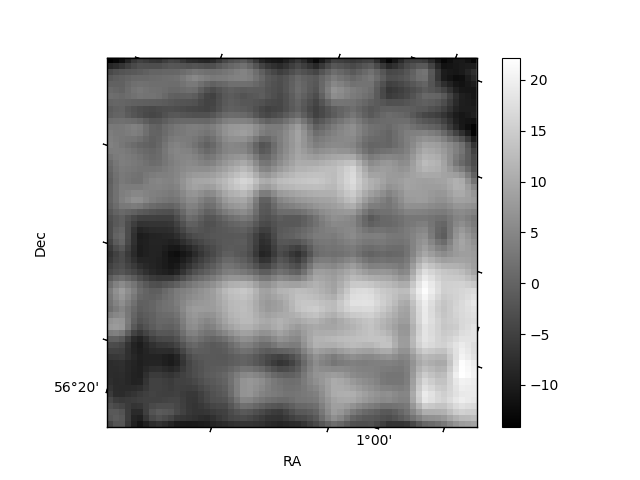
Quadrant B |
|---|---|---|---|
| Quadrant D | 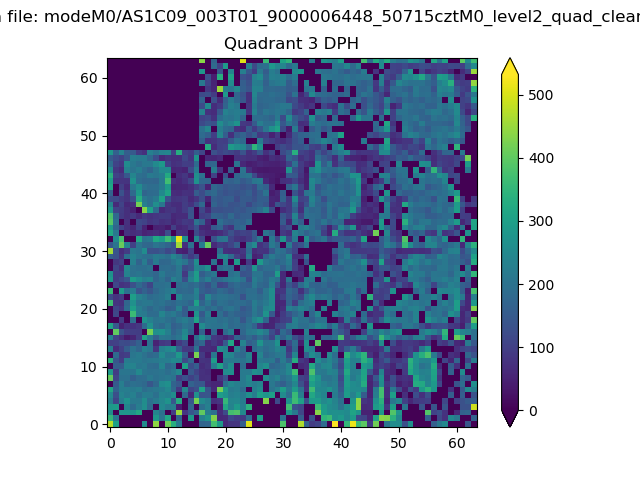 |
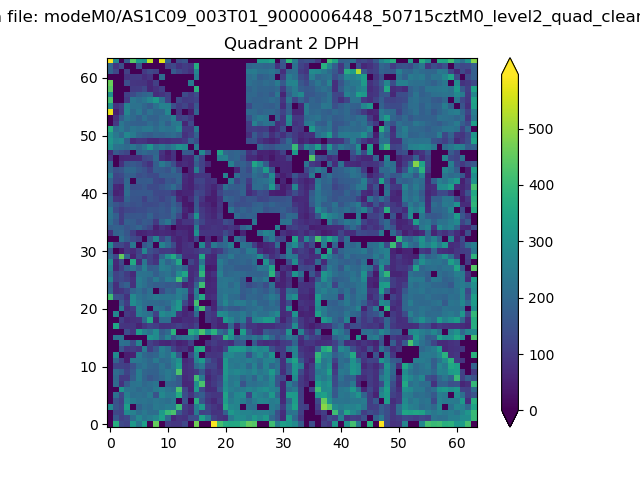 |
Quadrant C |
| Plot type | Count rate plots | Images |
|---|---|---|
| Comparison with Poisson distribution Blue bars denote a histogram of data divided into 1 sec bins. Red curve is a Poisson curve with rate = median count rate of data. |
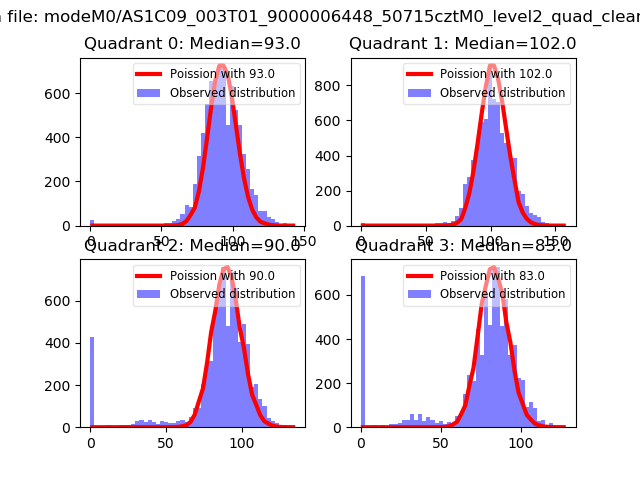 |
 |
| Quadrant-wise count rates Data is divided into 100 sec bins |
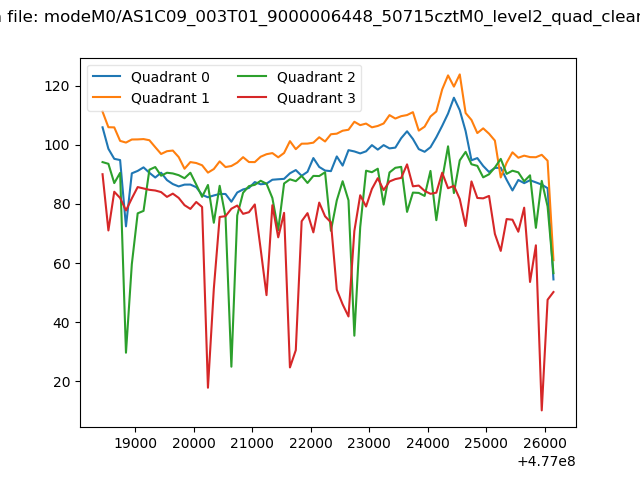 |
|
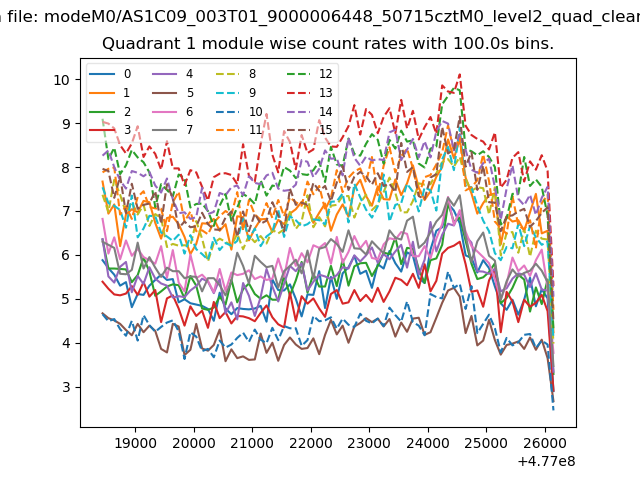
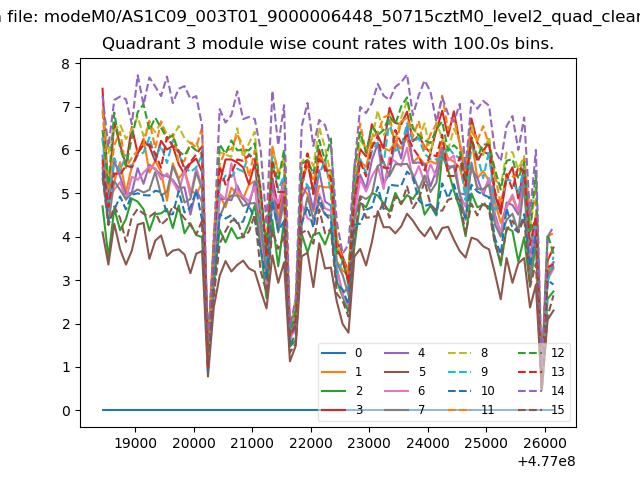
| Module-wise count rates for Quadrant A Data is divided into 100 sec bins |
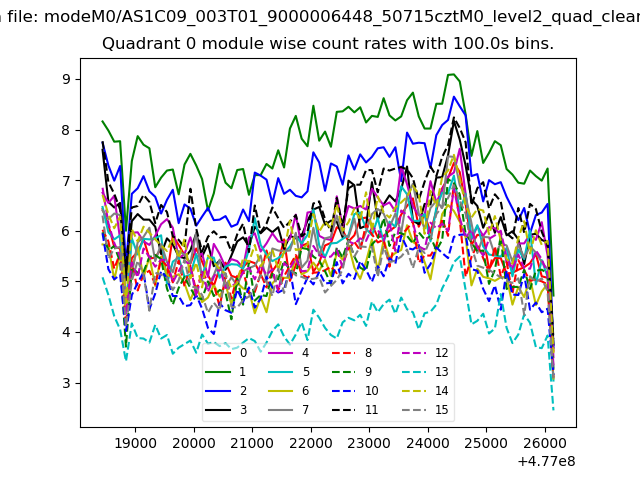 |
 |
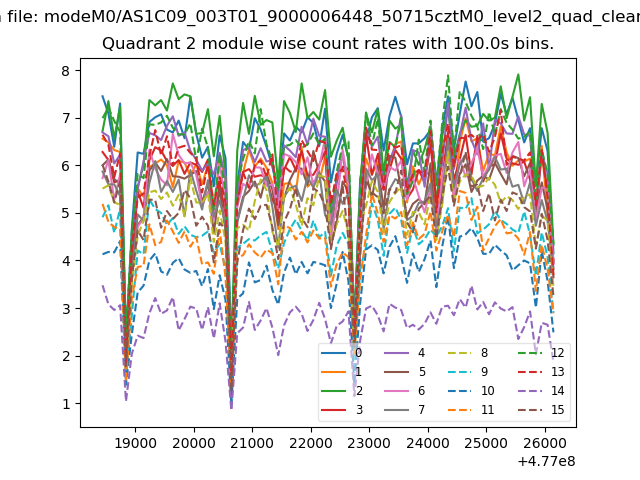
| Module-wise count rates for Quadrant B Data is divided into 100 sec bins |
 |
 |
| Module-wise count rates for Quadrant C Data is divided into 100 sec bins |
 |
 |
| Module-wise count rates for Quadrant D Data is divided into 100 sec bins |
 |
 |
| Parameter | Plot |
|---|---|
| CZT HV Monitor | 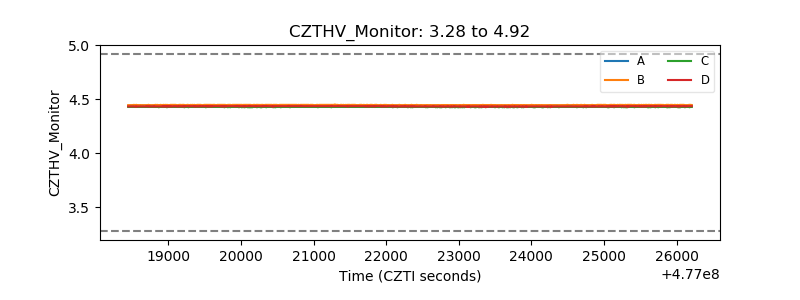 |
| D_VDD | 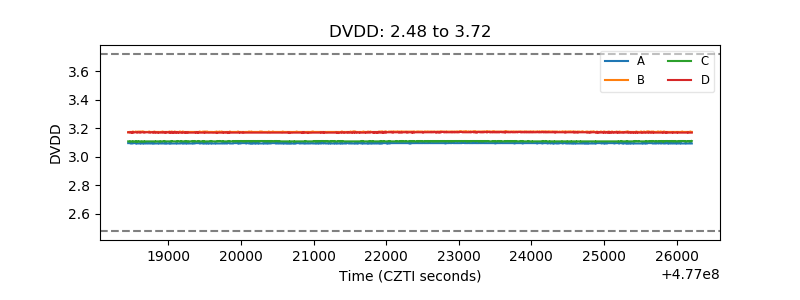 |
| Temperature 1 | 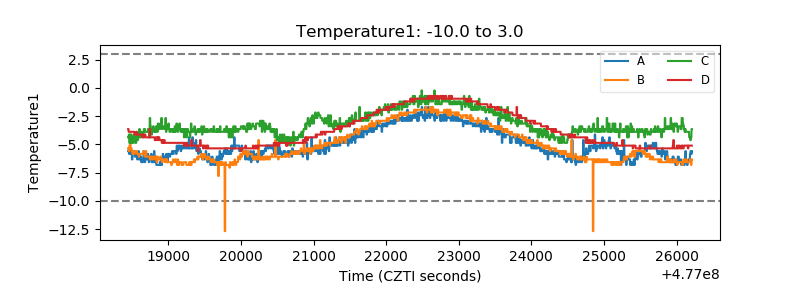 |
| Veto HV Monitor | 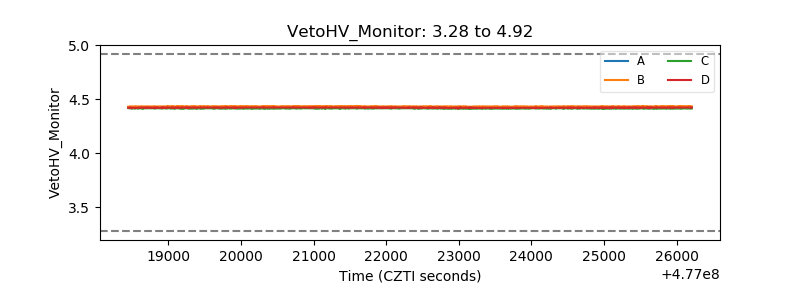 |
| Veto LLD | 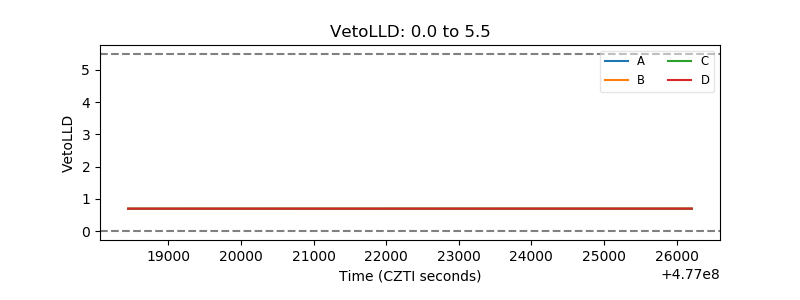 |
| Alpha Counter | 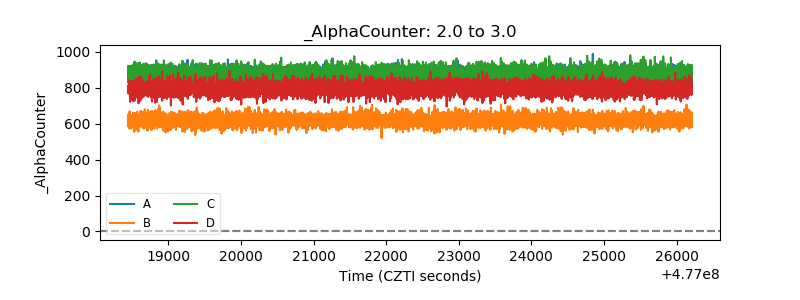 |
| _CPM_Rate | 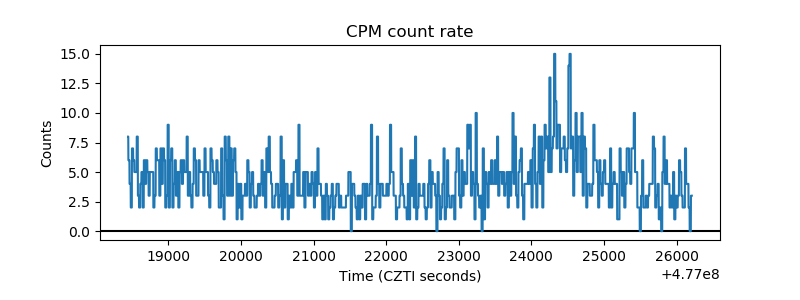 |
| CZT Counter |  |
| +2.5 Volts monitor | 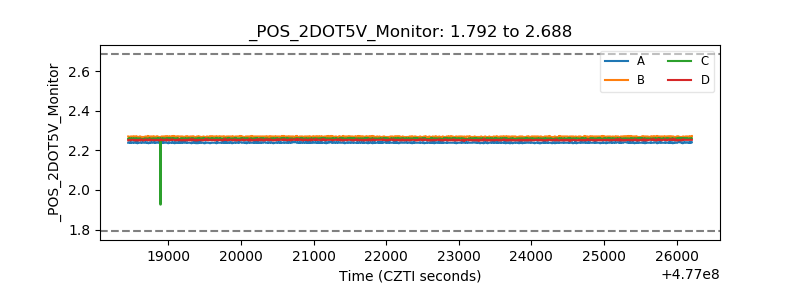 |
| +5 Volts monitor | 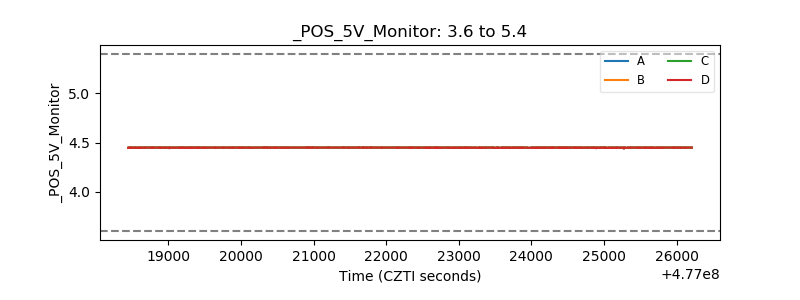 |
| _ROLL_ROT | 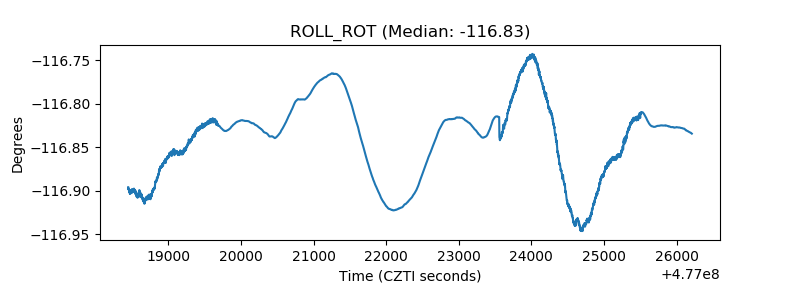 |
| _Roll_DEC | 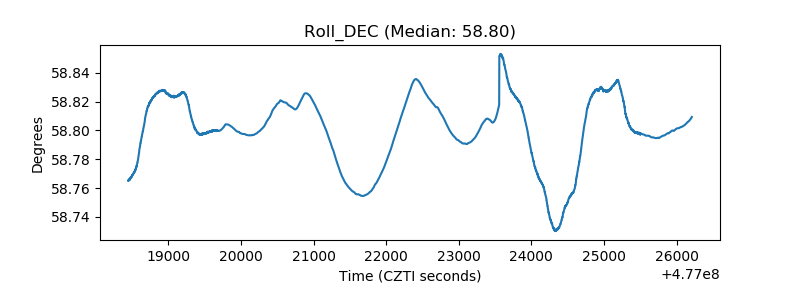 |
| _Roll_RA | 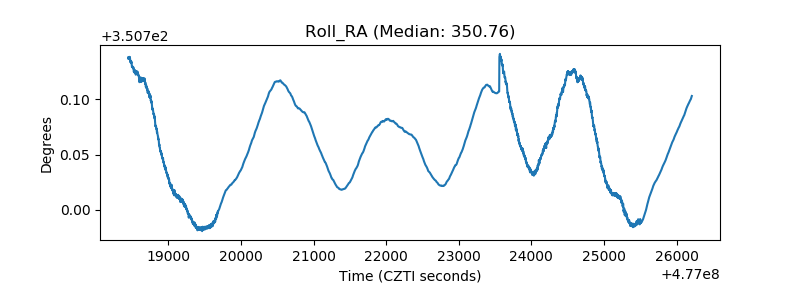 |
| Veto Counter | 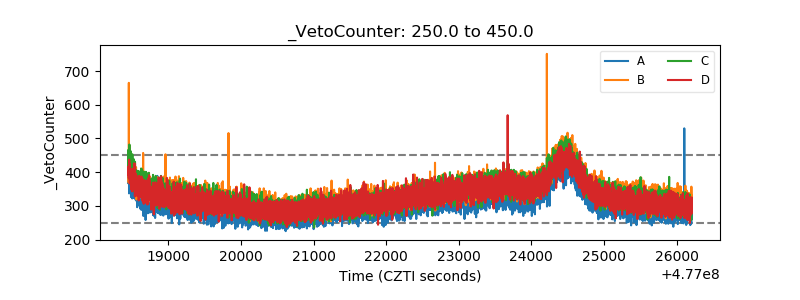 |