| Param | Original file | Final file |
|---|---|---|
| Filename | modeM0/AS1C09_003T01_9000006448_50721cztM0_level2.fits | modeM0/AS1C09_003T01_9000006448_50721cztM0_level2_quad_clean.evt |
| Size (bytes) | 705,504,960 | 97,963,200 |
| Size | 672.8 MB | 93.4 MB |
| Events in quadrant A | 4,041,045 | 675,404 |
| Events in quadrant B | 4,522,346 | 734,329 |
| Events in quadrant C | 7,902,612 | 562,715 |
| Events in quadrant D | 9,082,227 | 483,653 |
| Mode SS | |||
|---|---|---|---|
| Quadrant | BADHDUFLAG | Total packets | Discarded packets |
| A | 0 | 146 | 0 |
| B | 0 | 146 | 0 |
| C | 0 | 146 | 0 |
| D | 0 | 146 | 0 |
| Mode M0 | |||
|---|---|---|---|
| Quadrant | BADHDUFLAG | Total packets | Discarded packets |
| A | 0 | 16818 | 0 |
| B | 0 | 18572 | 0 |
| C | 0 | 28534 | 0 |
| D | 0 | 32042 | 0 |
| Quadrant | Total seconds | Saturated seconds | Saturation percentage |
|---|---|---|---|
| A | 7324 | 57 | 0.778263% |
| B | 7324 | 210 | 2.867286% |
| C | 7325 | 1335 | 18.225256% |
| D | 7325 | 1875 | 25.597270% |
Noise dominated data is calculated using 1-second bins in cleaned event files. If a bin has >2000 counts, and if more than 50% of those come from <1% of pixels, then it is considered to be noise-dominated and hence unusable.
| Quadrant | # 1 sec bins | Bins with >0 counts | Bins with >2000 counts | High rate bins dominated by noise | Noise dominated (total time) | Noise dominated (detector-on time) | Marked lightcurve |
|---|---|---|---|---|---|---|---|
| A | 7324 | 7324 | 40 | 40 | 0.55% | 0.55% | 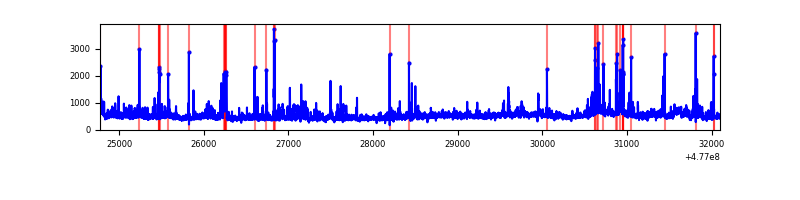 |
| B | 7324 | 7324 | 111 | 111 | 1.52% | 1.52% | 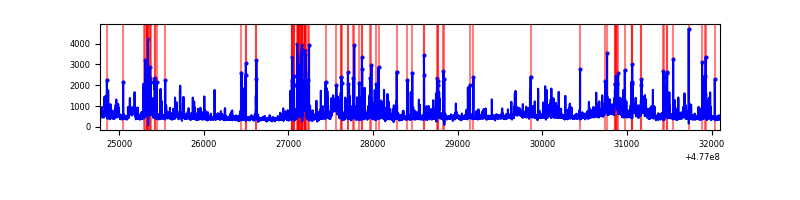 |
| C | 7325 | 7325 | 1042 | 1042 | 14.23% | 14.23% | 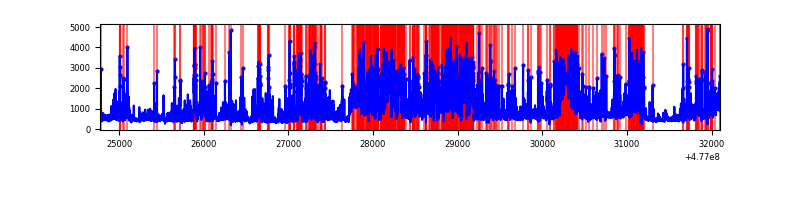 |
| D | 7325 | 7325 | 1696 | 1696 | 23.15% | 23.15% | 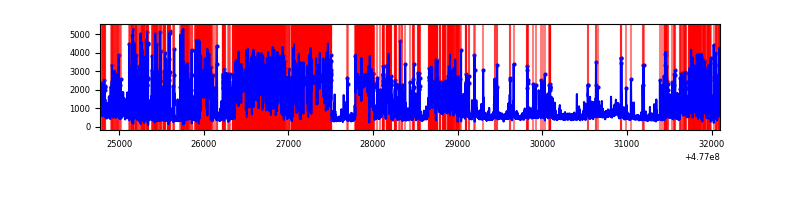 |
Top three noisy pixels from each quadrant. If the there are fewer than three noisy pixels in the level2.evt file, extra rows are filled as -1
| Pixel properties | Quadrant properties | ||||||
|---|---|---|---|---|---|---|---|
| Quadrant | DetID | PixID | Counts | Sigma | Mean | Median | Sigma |
| A | 4 | 3 | 236111 | 1234.52 | 767 | 748 | 190.7 |
| A | 12 | 80 | 157534 | 822.37 | 767 | 748 | 190.7 |
| A | 9 | 191 | 88431 | 459.91 | 767 | 748 | 190.7 |
| B | 0 | 229 | 276247 | 1688.9 | 763 | 735 | 163.1 |
| B | 0 | 213 | 268424 | 1640.94 | 763 | 735 | 163.1 |
| B | 3 | 249 | 193842 | 1183.75 | 763 | 735 | 163.1 |
| C | 5 | 10 | 1942191 | 10163.97 | 691 | 685 | 191.0 |
| C | 0 | 224 | 1095684 | 5732.42 | 691 | 685 | 191.0 |
| C | 0 | 209 | 582317 | 3044.9 | 691 | 685 | 191.0 |
| D | 2 | 249 | 3504243 | 19288.16 | 650 | 627 | 181.6 |
| D | 8 | 176 | 1431946 | 7879.72 | 650 | 627 | 181.6 |
| D | 7 | 60 | 333691 | 1833.59 | 650 | 627 | 181.6 |
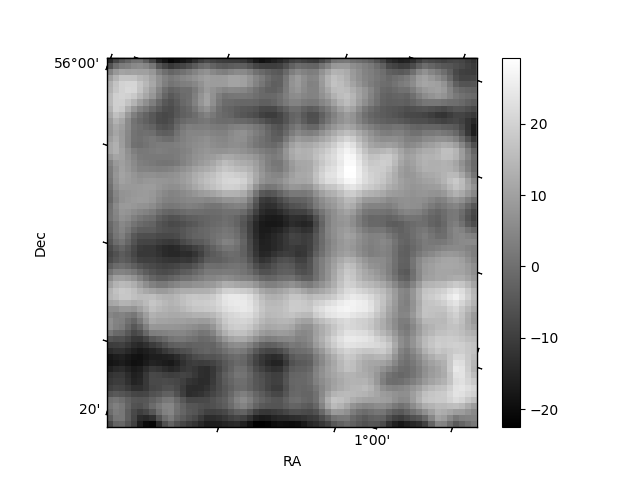
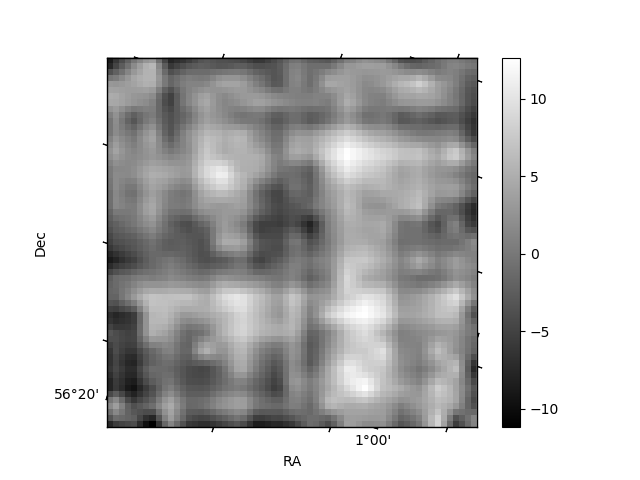
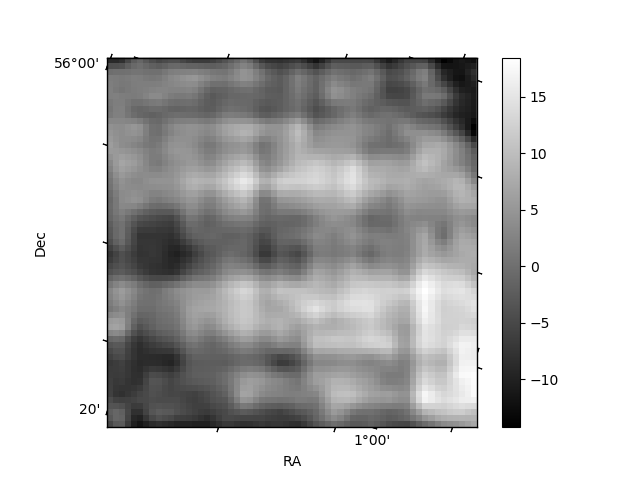
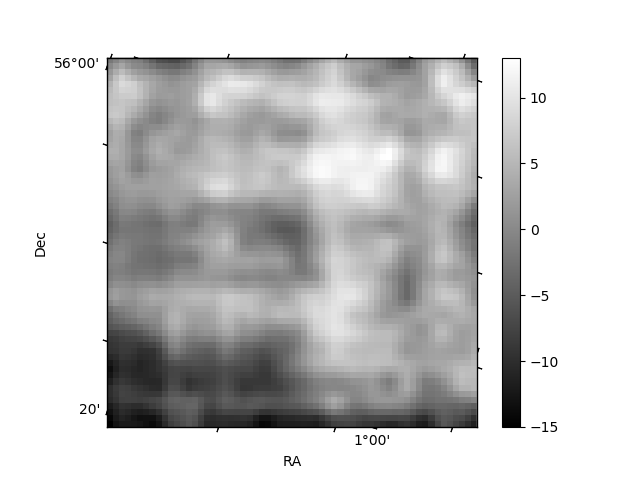
Histogram calculated using DETX and DETY for each event in the final _common_clean file
| Quadrant A | 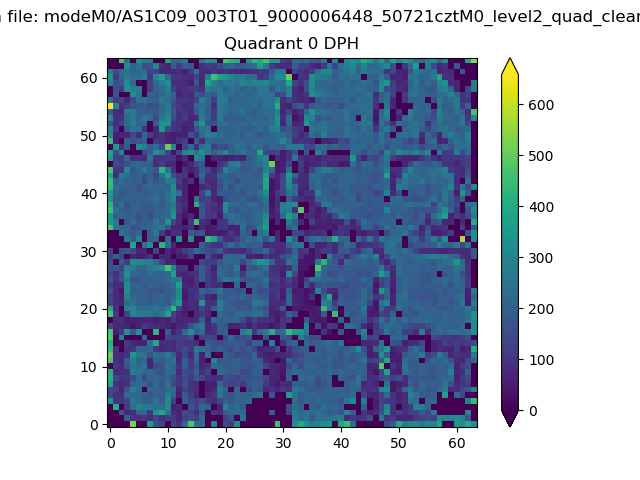 |
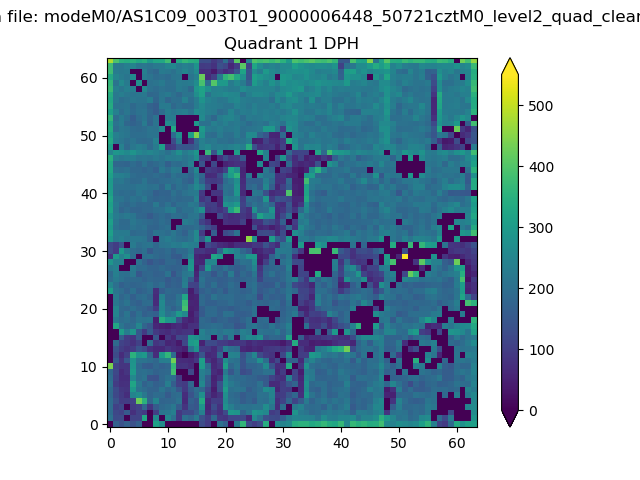 |
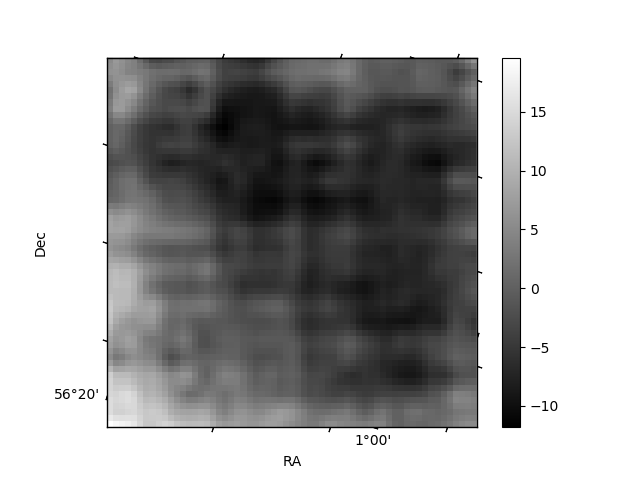
Quadrant B |
|---|---|---|---|
| Quadrant D | 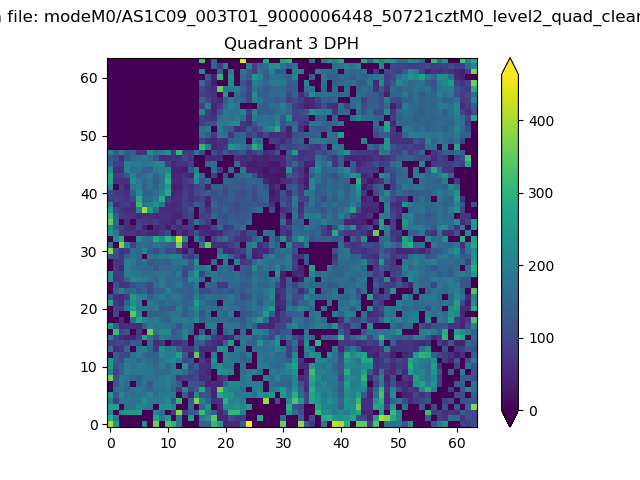 |
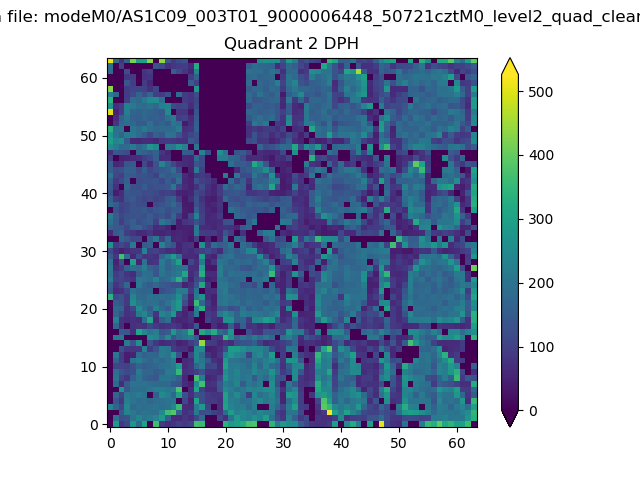 |
Quadrant C |
| Plot type | Count rate plots | Images |
|---|---|---|
| Comparison with Poisson distribution Blue bars denote a histogram of data divided into 1 sec bins. Red curve is a Poisson curve with rate = median count rate of data. |
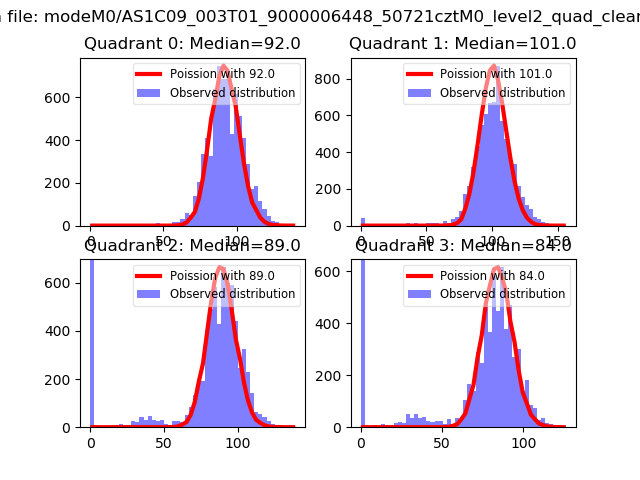 |
 |
| Quadrant-wise count rates Data is divided into 100 sec bins |
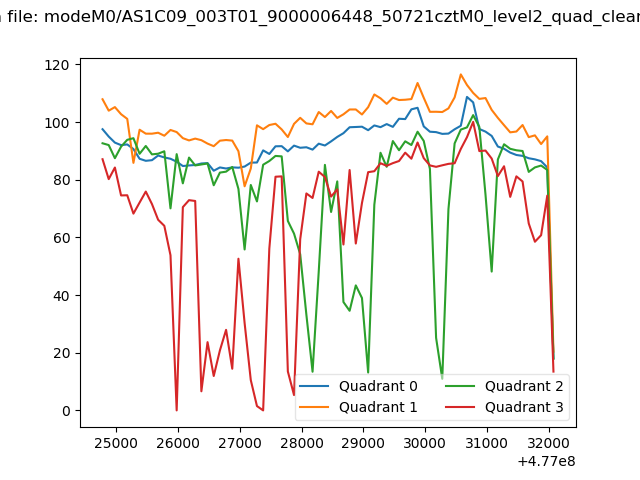 |
|
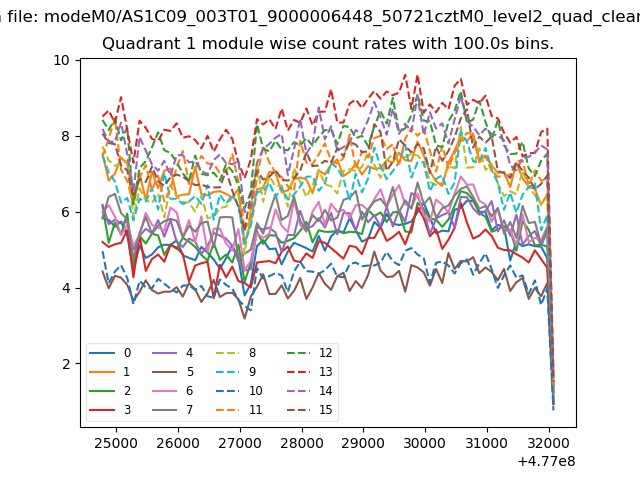
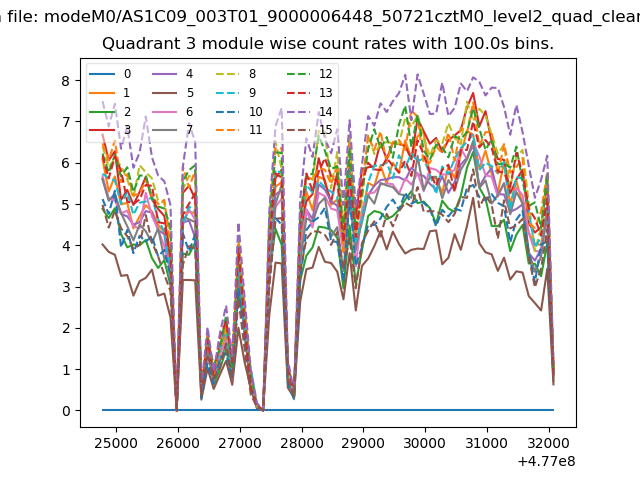
| Module-wise count rates for Quadrant A Data is divided into 100 sec bins |
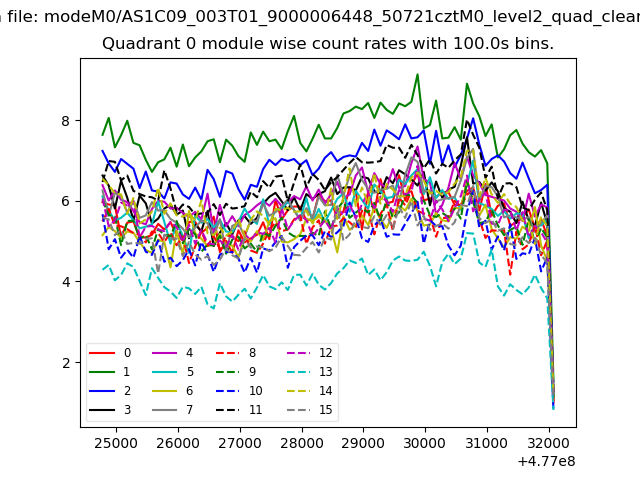 |
 |
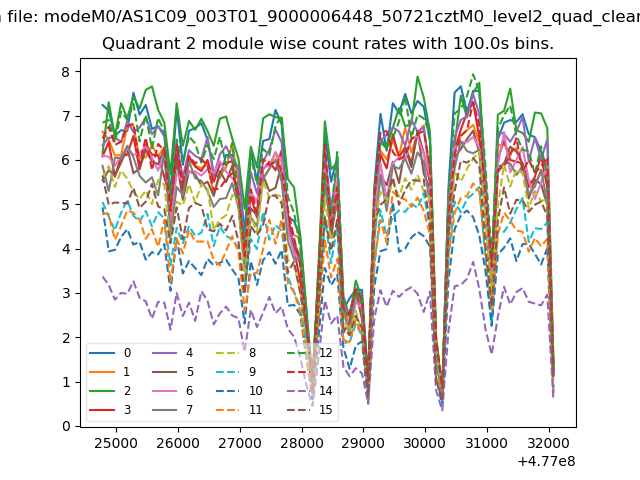
| Module-wise count rates for Quadrant B Data is divided into 100 sec bins |
 |
 |
| Module-wise count rates for Quadrant C Data is divided into 100 sec bins |
 |
 |
| Module-wise count rates for Quadrant D Data is divided into 100 sec bins |
 |
 |
| Parameter | Plot |
|---|---|
| CZT HV Monitor | 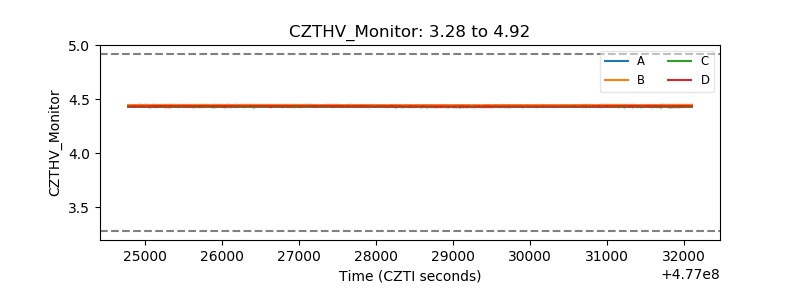 |
| D_VDD | 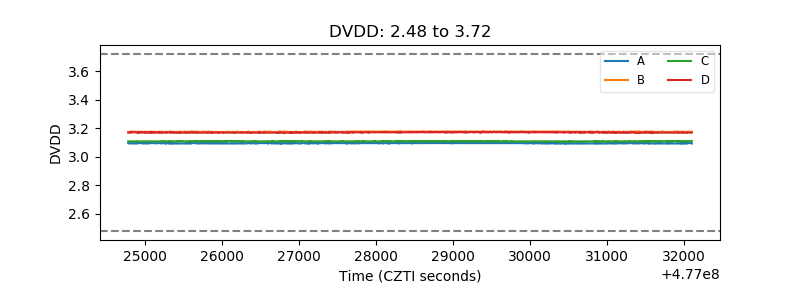 |
| Temperature 1 | 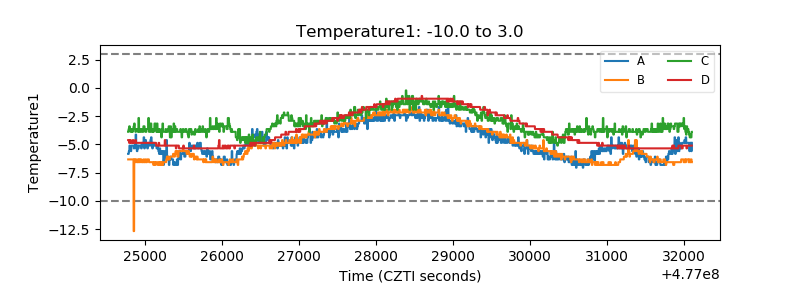 |
| Veto HV Monitor | 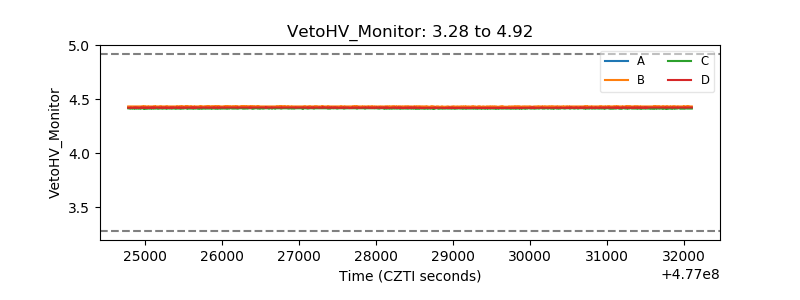 |
| Veto LLD | 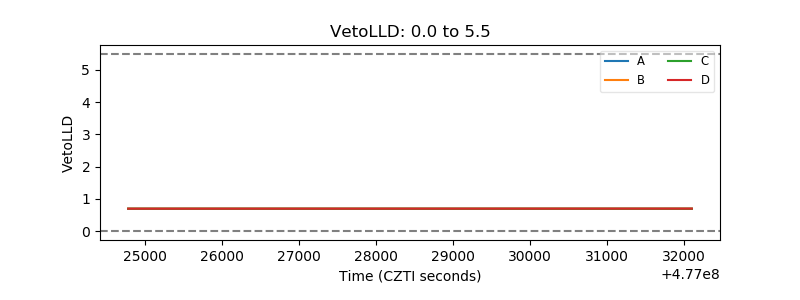 |
| Alpha Counter | 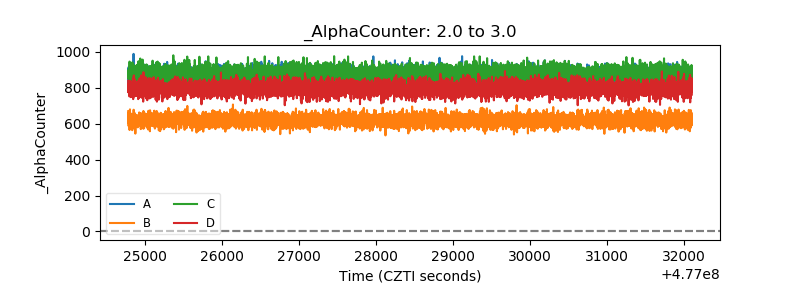 |
| _CPM_Rate | 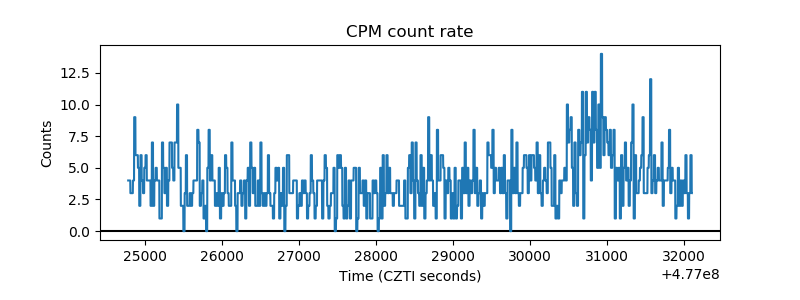 |
| CZT Counter | 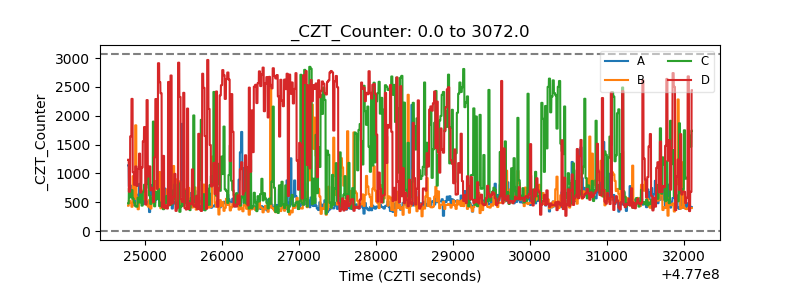 |
| +2.5 Volts monitor | 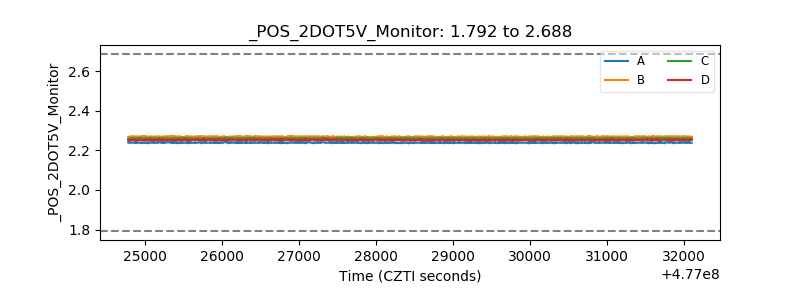 |
| +5 Volts monitor |  |
| _ROLL_ROT | 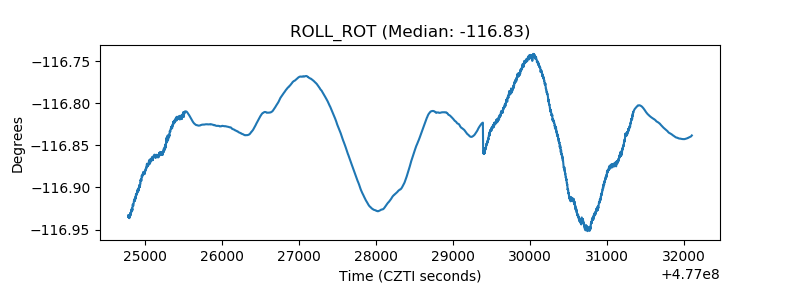 |
| _Roll_DEC | 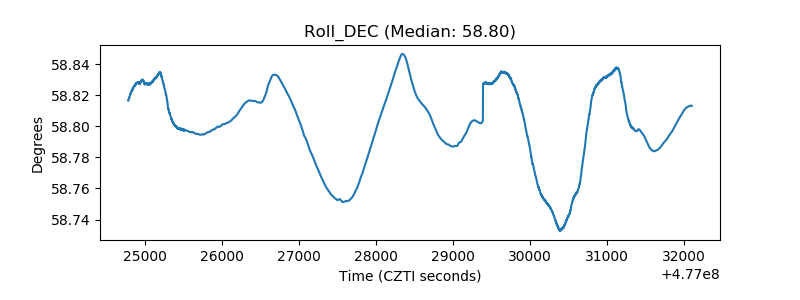 |
| _Roll_RA | 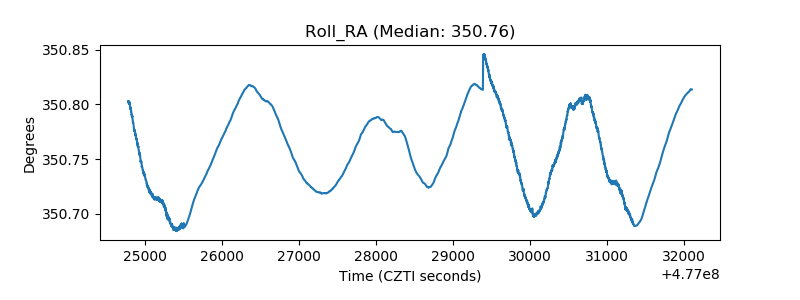 |
| Veto Counter | 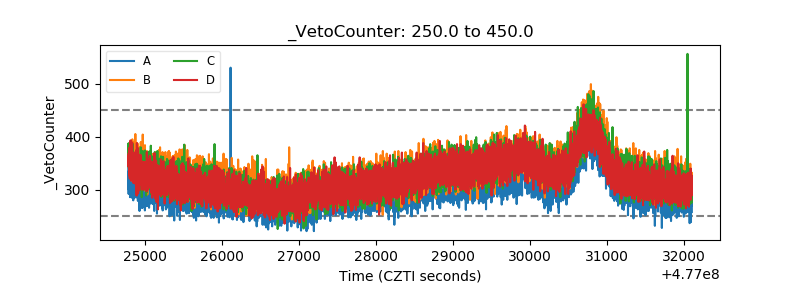 |