| Param | Original file | Final file |
|---|---|---|
| Filename | modeM0/AS1C07_001T01_9000006450_50727cztM0_level2.fits | modeM0/AS1C07_001T01_9000006450_50727cztM0_level2_quad_clean.evt |
| Size (bytes) | 1,695,528,000 | 301,371,840 |
| Size | 1.6 GB | 287.4 MB |
| Events in quadrant A | 16,510,947 | 1,868,452 |
| Events in quadrant B | 12,607,686 | 2,214,335 |
| Events in quadrant C | 16,914,321 | 1,793,078 |
| Events in quadrant D | 15,090,411 | 1,787,539 |
| Mode SS | |||
|---|---|---|---|
| Quadrant | BADHDUFLAG | Total packets | Discarded packets |
| A | 0 | 434 | 0 |
| B | 0 | 434 | 0 |
| C | 0 | 434 | 0 |
| D | 0 | 434 | 0 |
| Mode M0 | |||
|---|---|---|---|
| Quadrant | BADHDUFLAG | Total packets | Discarded packets |
| A | 0 | 63351 | 4 |
| B | 0 | 52520 | 4 |
| C | 0 | 64991 | 10 |
| D | 0 | 59949 | 4 |
| Mode M9 | |||
|---|---|---|---|
| Quadrant | BADHDUFLAG | Total packets | Discarded packets |
| A | 0 | 45 | 0 |
| B | 0 | 45 | 0 |
| C | 0 | 45 | 0 |
| D | 0 | 45 | 0 |
| Quadrant | Total seconds | Saturated seconds | Saturation percentage |
|---|---|---|---|
| A | 21222 | 1826 | 8.604279% |
| B | 21223 | 749 | 3.529190% |
| C | 21222 | 2036 | 9.593818% |
| D | 21222 | 1308 | 6.163415% |
Noise dominated data is calculated using 1-second bins in cleaned event files. If a bin has >2000 counts, and if more than 50% of those come from <1% of pixels, then it is considered to be noise-dominated and hence unusable.
| Quadrant | # 1 sec bins | Bins with >0 counts | Bins with >2000 counts | High rate bins dominated by noise | Noise dominated (total time) | Noise dominated (detector-on time) | Marked lightcurve |
|---|---|---|---|---|---|---|---|
| A | 25702 | 21226 | 1604 | 1604 | 6.24% | 7.56% | 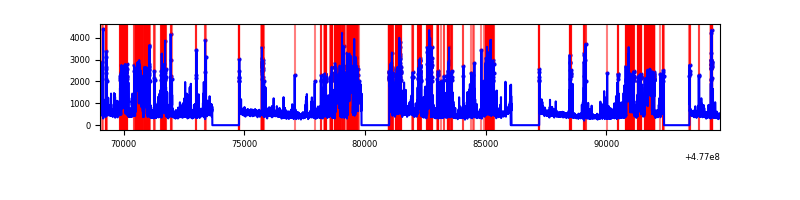 |
| B | 25703 | 21228 | 297 | 297 | 1.16% | 1.40% | 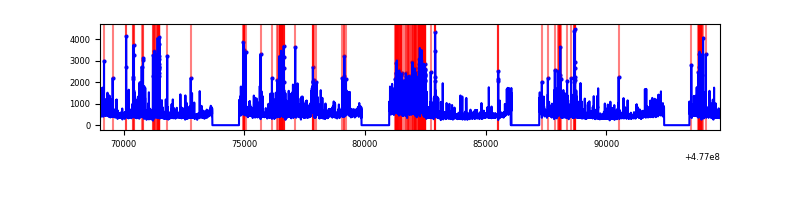 |
| C | 25701 | 21224 | 1440 | 1440 | 5.60% | 6.78% | 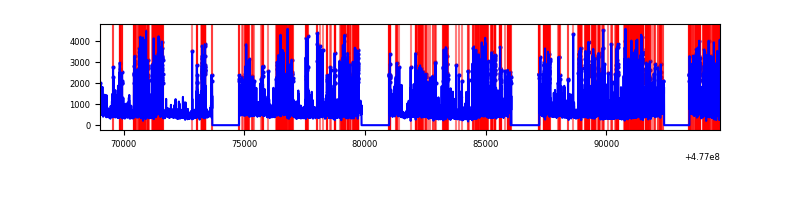 |
| D | 25702 | 21225 | 927 | 927 | 3.61% | 4.37% | 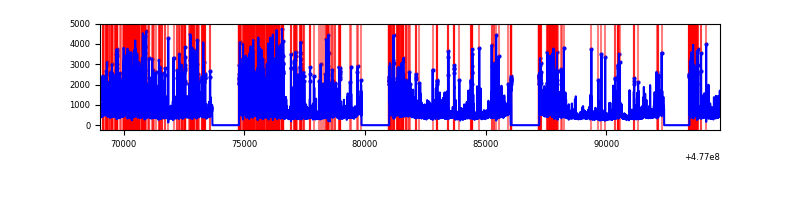 |
Top three noisy pixels from each quadrant. If the there are fewer than three noisy pixels in the level2.evt file, extra rows are filled as -1
| Pixel properties | Quadrant properties | ||||||
|---|---|---|---|---|---|---|---|
| Quadrant | DetID | PixID | Counts | Sigma | Mean | Median | Sigma |
| A | 12 | 80 | 4255808 | 7779.51 | 2222 | 2166 | 546.8 |
| A | 8 | 61 | 872773 | 1592.26 | 2222 | 2166 | 546.8 |
| A | 4 | 3 | 520800 | 948.53 | 2222 | 2166 | 546.8 |
| B | 7 | 0 | 1389746 | 2960.5 | 2255 | 2175 | 468.7 |
| B | 8 | 128 | 328034 | 695.25 | 2255 | 2175 | 468.7 |
| B | 10 | 246 | 298261 | 631.72 | 2255 | 2175 | 468.7 |
| C | 5 | 10 | 4616181 | 7852.79 | 2152 | 2129 | 587.6 |
| C | 15 | 231 | 981383 | 1666.62 | 2152 | 2129 | 587.6 |
| C | 12 | 247 | 533009 | 903.52 | 2152 | 2129 | 587.6 |
| D | 15 | 174 | 1530306 | 2526.42 | 2155 | 2073 | 604.9 |
| D | 15 | 93 | 1003246 | 1655.1 | 2155 | 2073 | 604.9 |
| D | 2 | 249 | 801507 | 1321.6 | 2155 | 2073 | 604.9 |
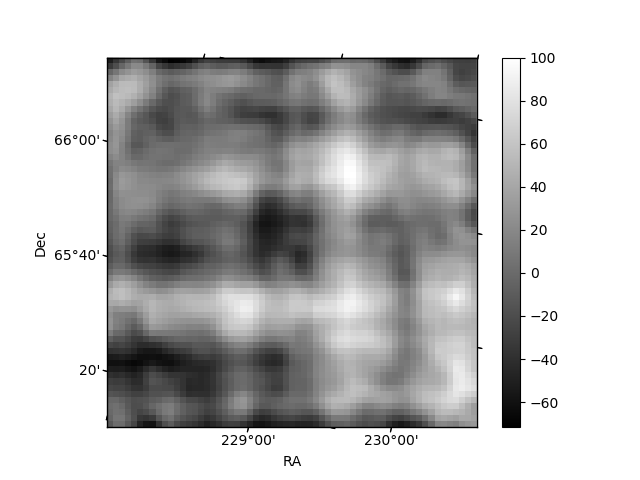
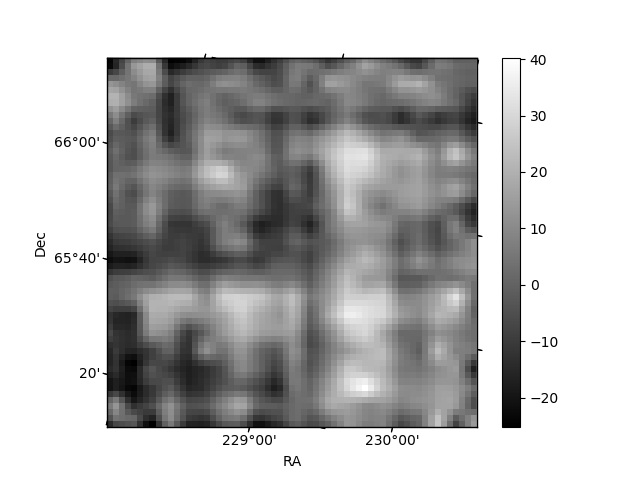
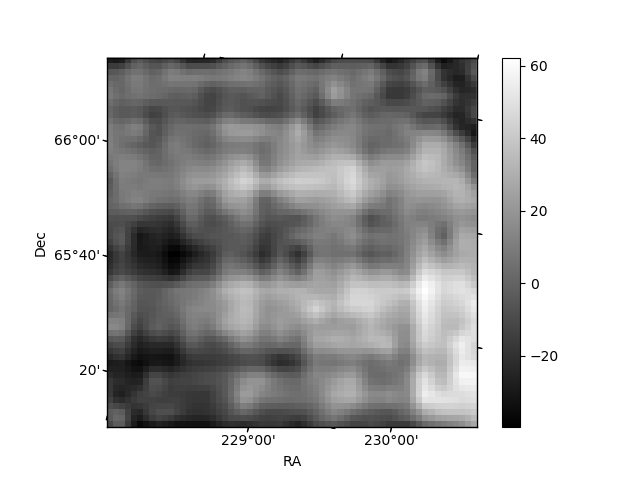
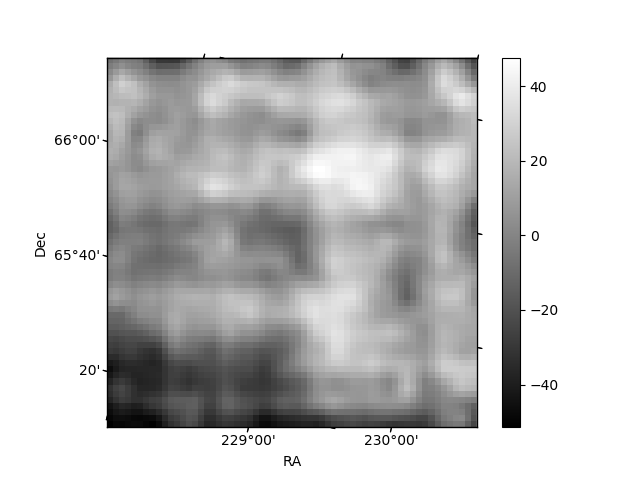
Histogram calculated using DETX and DETY for each event in the final _common_clean file
| Quadrant A | 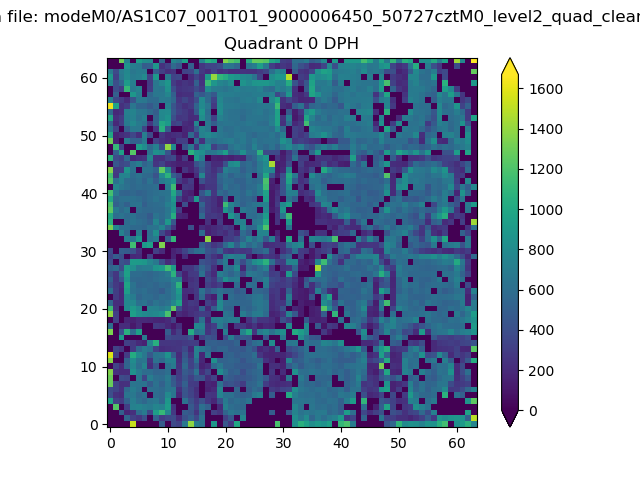 |
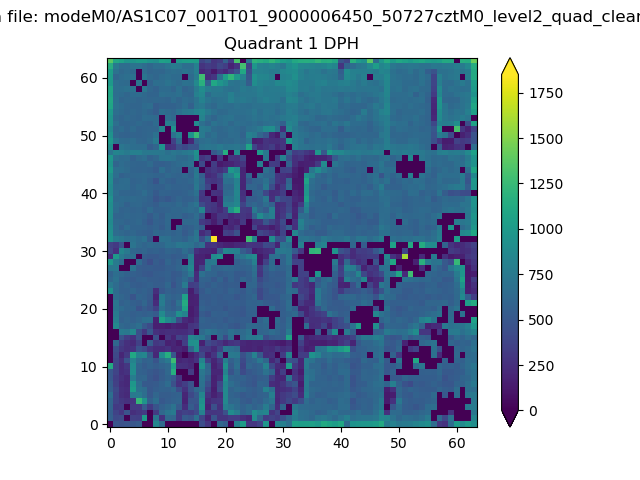 |
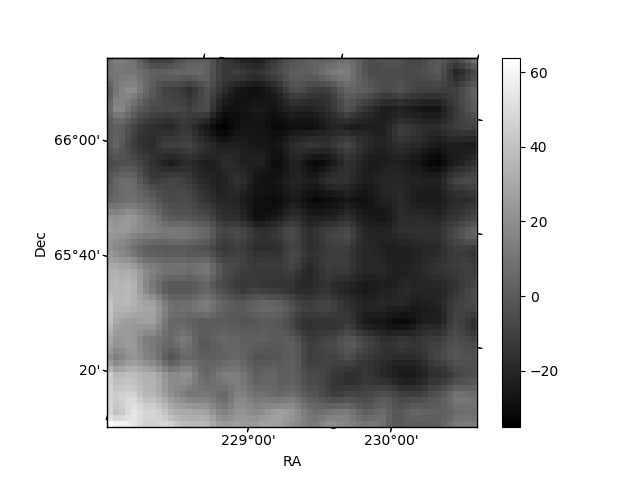
Quadrant B |
|---|---|---|---|
| Quadrant D | 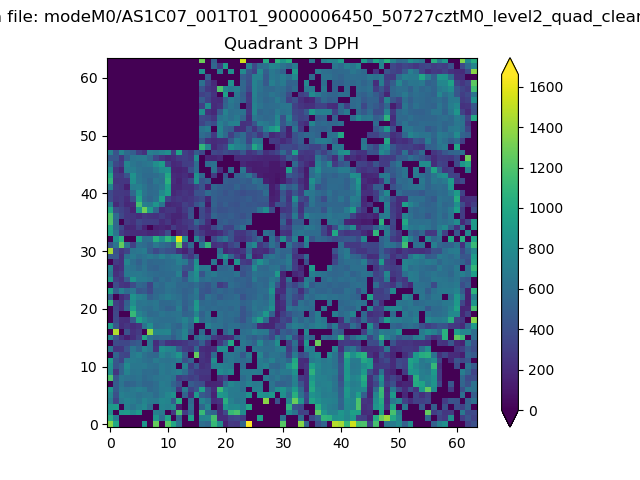 |
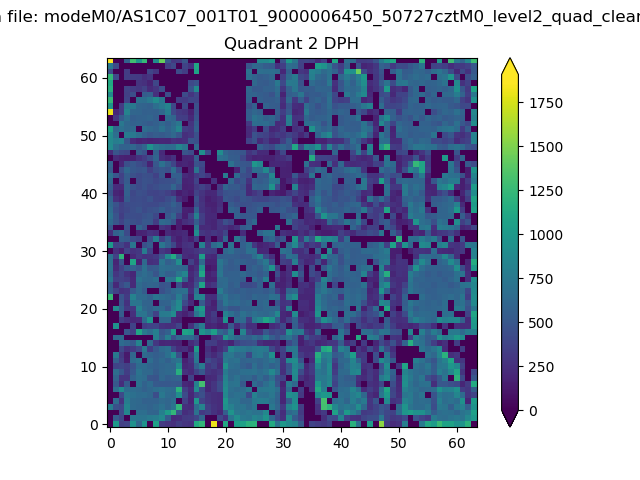 |
Quadrant C |
| Plot type | Count rate plots | Images |
|---|---|---|
| Comparison with Poisson distribution Blue bars denote a histogram of data divided into 1 sec bins. Red curve is a Poisson curve with rate = median count rate of data. |
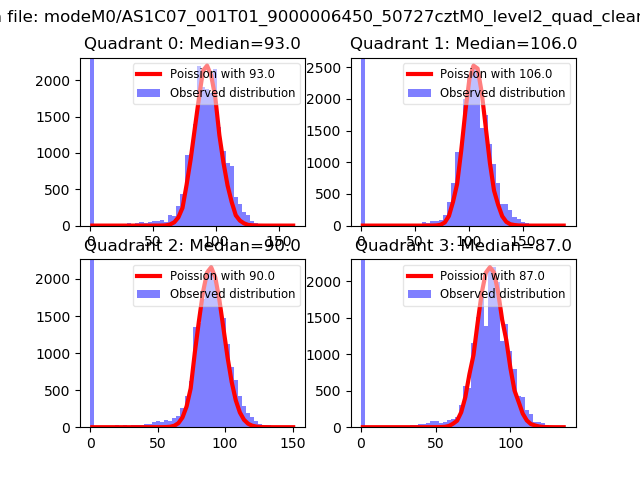 |
 |
| Quadrant-wise count rates Data is divided into 100 sec bins |
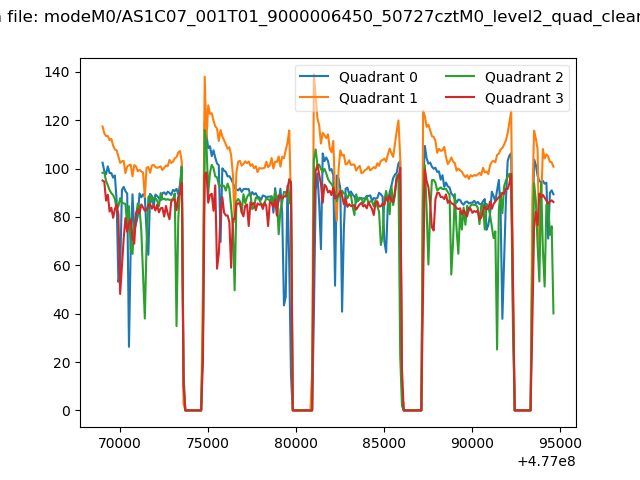 |
|
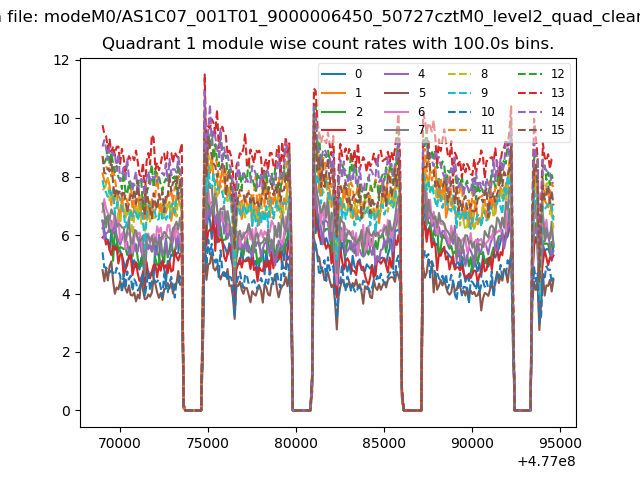
| Module-wise count rates for Quadrant A Data is divided into 100 sec bins |
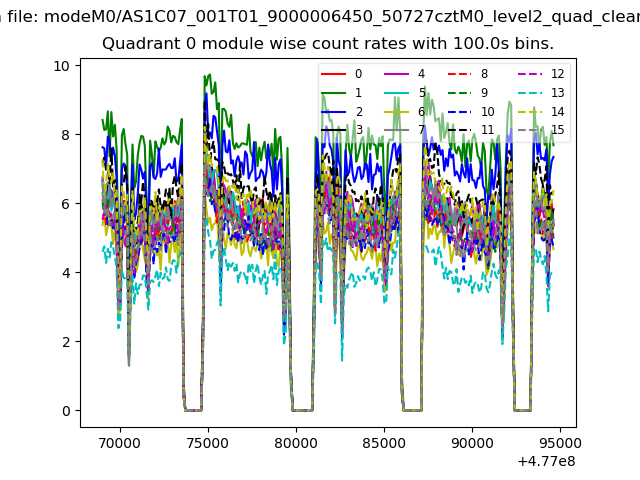 |
 |
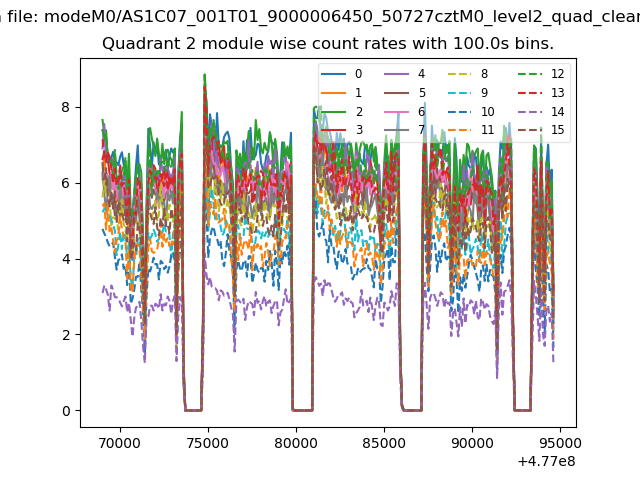
| Module-wise count rates for Quadrant B Data is divided into 100 sec bins |
 |
 |
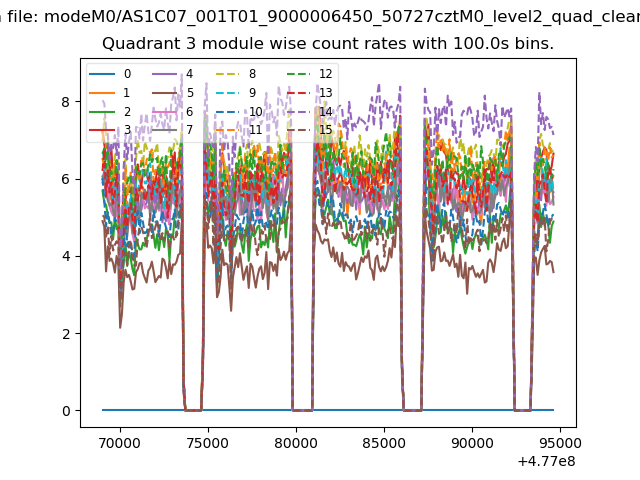
| Module-wise count rates for Quadrant C Data is divided into 100 sec bins |
 |
 |
| Module-wise count rates for Quadrant D Data is divided into 100 sec bins |
 |
 |
| Parameter | Plot |
|---|---|
| CZT HV Monitor | 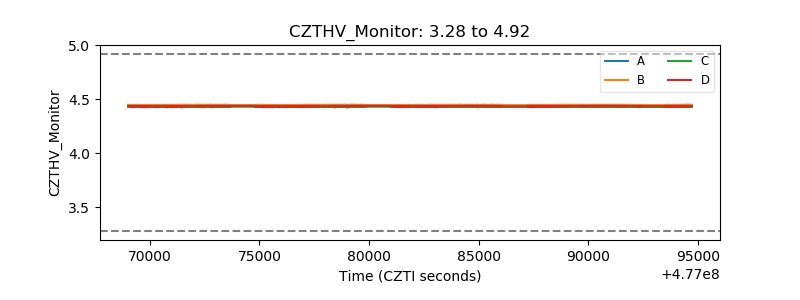 |
| D_VDD |  |
| Temperature 1 | 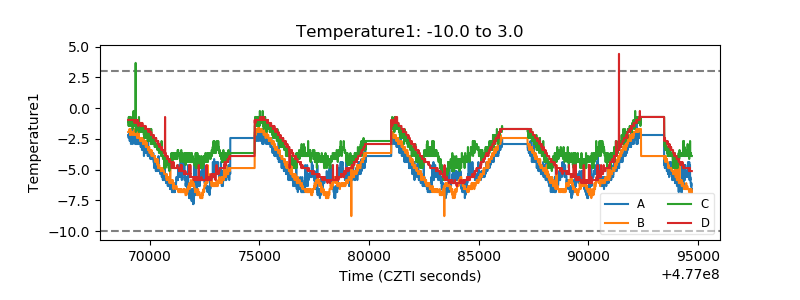 |
| Veto HV Monitor | 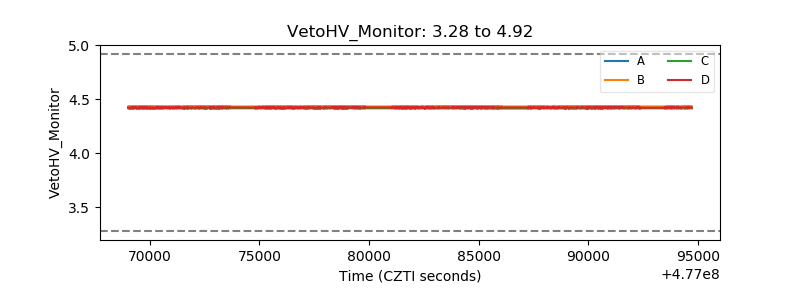 |
| Veto LLD | 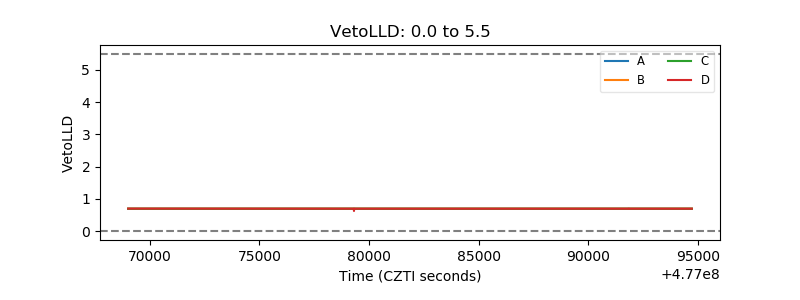 |
| Alpha Counter | 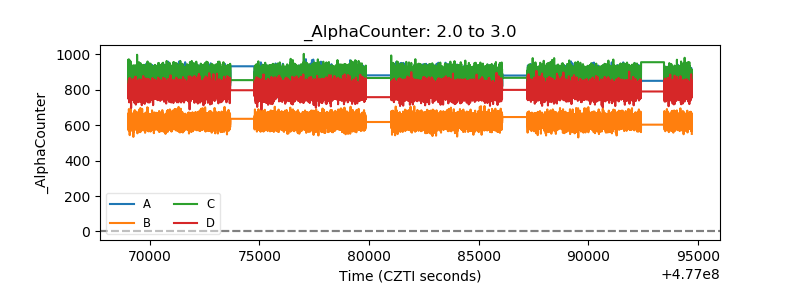 |
| _CPM_Rate | 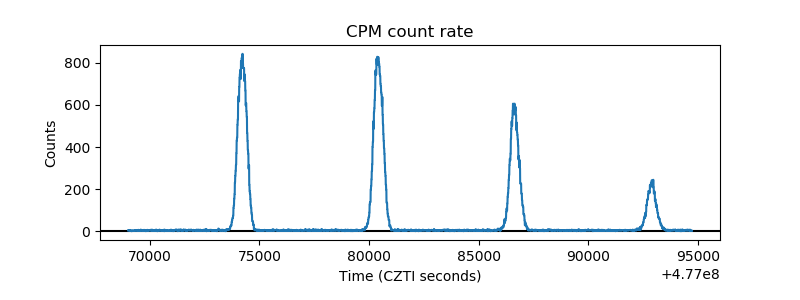 |
| CZT Counter | 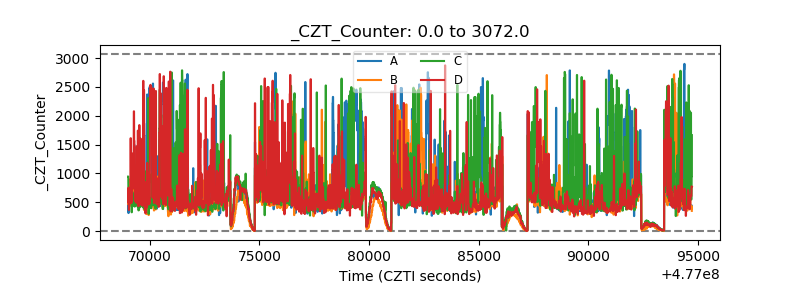 |
| +2.5 Volts monitor | 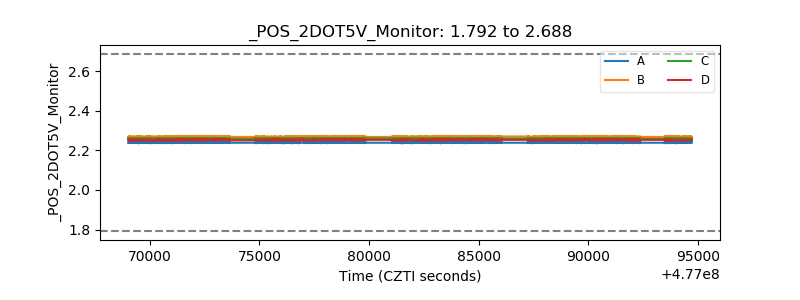 |
| +5 Volts monitor | 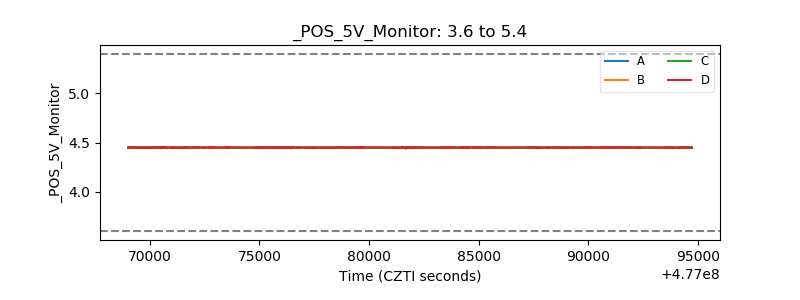 |
| _ROLL_ROT | 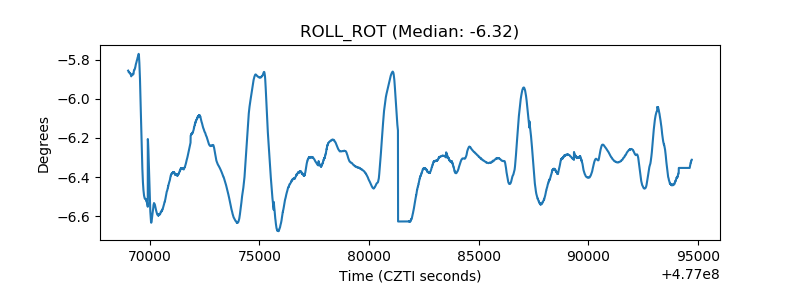 |
| _Roll_DEC | 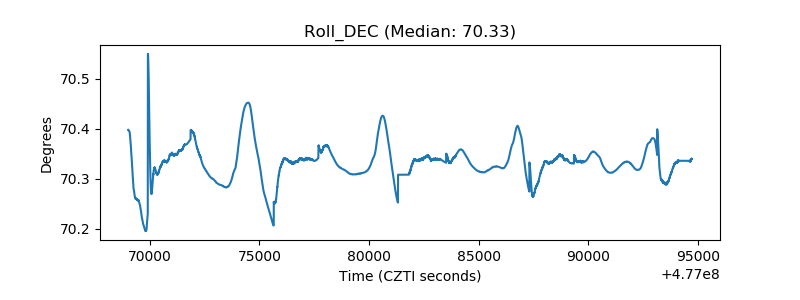 |
| _Roll_RA | 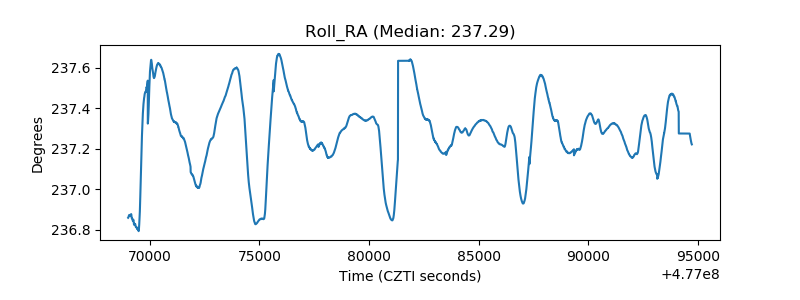 |
| Veto Counter | 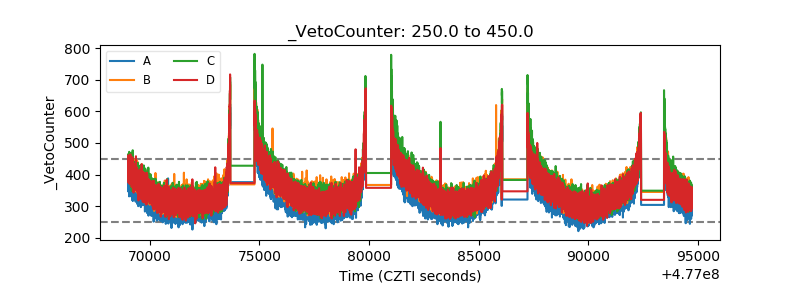 |