| Param | Original file | Final file |
|---|---|---|
| Filename | modeM0/AS1C07_001T01_9000006450_50729cztM0_level2.fits | modeM0/AS1C07_001T01_9000006450_50729cztM0_level2_quad_clean.evt |
| Size (bytes) | 723,251,520 | 103,233,600 |
| Size | 689.7 MB | 98.5 MB |
| Events in quadrant A | 5,720,686 | 682,111 |
| Events in quadrant B | 4,130,443 | 786,490 |
| Events in quadrant C | 11,525,716 | 477,226 |
| Events in quadrant D | 4,792,836 | 638,738 |
| Mode SS | |||
|---|---|---|---|
| Quadrant | BADHDUFLAG | Total packets | Discarded packets |
| A | 0 | 160 | 0 |
| B | 0 | 160 | 0 |
| C | 0 | 160 | 0 |
| D | 0 | 160 | 2 |
| Mode M0 | |||
|---|---|---|---|
| Quadrant | BADHDUFLAG | Total packets | Discarded packets |
| A | 0 | 22654 | 147 |
| B | 0 | 18007 | 31 |
| C | 0 | 39728 | 86 |
| D | 0 | 20013 | 86 |
| Mode M9 | |||
|---|---|---|---|
| Quadrant | BADHDUFLAG | Total packets | Discarded packets |
| A | 0 | 4 | 0 |
| B | 0 | 5 | 1 |
| C | 0 | 5 | 1 |
| D | 0 | 5 | 0 |
| Quadrant | Total seconds | Saturated seconds | Saturation percentage |
|---|---|---|---|
| A | 7770 | 496 | 6.383526% |
| B | 7782 | 172 | 2.210229% |
| C | 7776 | 2859 | 36.766975% |
| D | 7772 | 268 | 3.448276% |
Noise dominated data is calculated using 1-second bins in cleaned event files. If a bin has >2000 counts, and if more than 50% of those come from <1% of pixels, then it is considered to be noise-dominated and hence unusable.
| Quadrant | # 1 sec bins | Bins with >0 counts | Bins with >2000 counts | High rate bins dominated by noise | Noise dominated (total time) | Noise dominated (detector-on time) | Marked lightcurve |
|---|---|---|---|---|---|---|---|
| A | 8040 | 7773 | 541 | 541 | 6.73% | 6.96% | 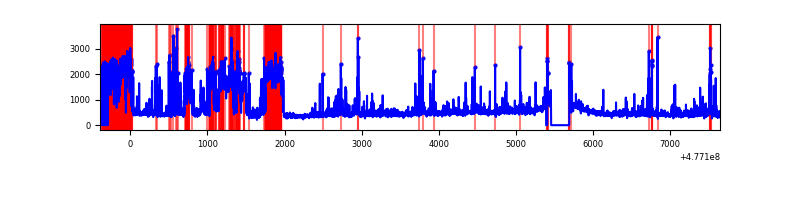 |
| B | 8040 | 7790 | 66 | 66 | 0.82% | 0.85% | 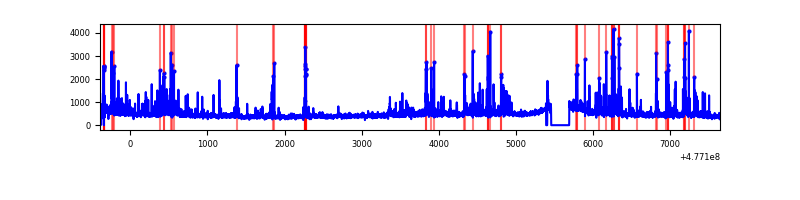 |
| C | 8040 | 7785 | 2315 | 2315 | 28.79% | 29.74% | 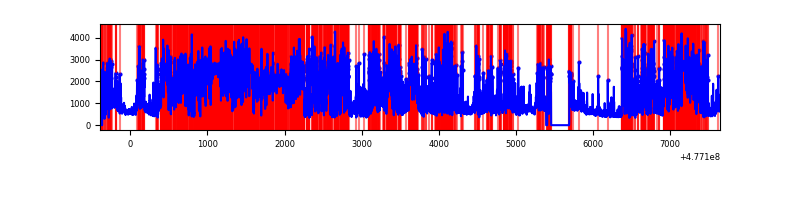 |
| D | 8038 | 7784 | 236 | 236 | 2.94% | 3.03% | 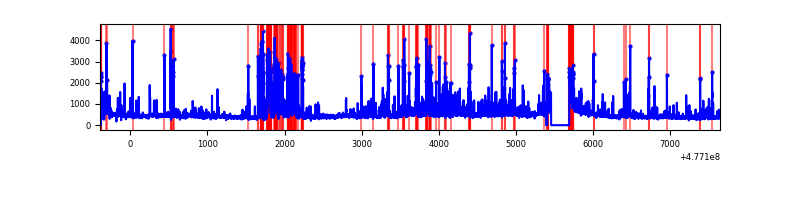 |
Top three noisy pixels from each quadrant. If the there are fewer than three noisy pixels in the level2.evt file, extra rows are filled as -1
| Pixel properties | Quadrant properties | ||||||
|---|---|---|---|---|---|---|---|
| Quadrant | DetID | PixID | Counts | Sigma | Mean | Median | Sigma |
| A | 12 | 80 | 1752614 | 8658.88 | 806 | 784 | 202.3 |
| A | 5 | 240 | 116511 | 572.01 | 806 | 784 | 202.3 |
| A | 8 | 61 | 106859 | 524.3 | 806 | 784 | 202.3 |
| B | 10 | 247 | 129071 | 732.71 | 823 | 793 | 175.1 |
| B | 8 | 128 | 123654 | 701.77 | 823 | 793 | 175.1 |
| B | 0 | 200 | 121356 | 688.65 | 823 | 793 | 175.1 |
| C | 5 | 10 | 6098023 | 33294.41 | 666 | 661 | 183.1 |
| C | 9 | 38 | 1460251 | 7970.03 | 666 | 661 | 183.1 |
| C | 15 | 231 | 194200 | 1056.81 | 666 | 661 | 183.1 |
| D | 1 | 47 | 618936 | 2803.68 | 784 | 754 | 220.5 |
| D | 2 | 249 | 252741 | 1142.85 | 784 | 754 | 220.5 |
| D | 7 | 96 | 170708 | 770.8 | 784 | 754 | 220.5 |
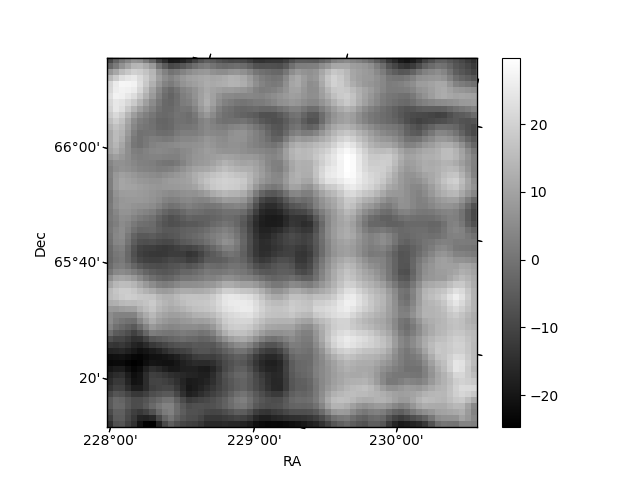
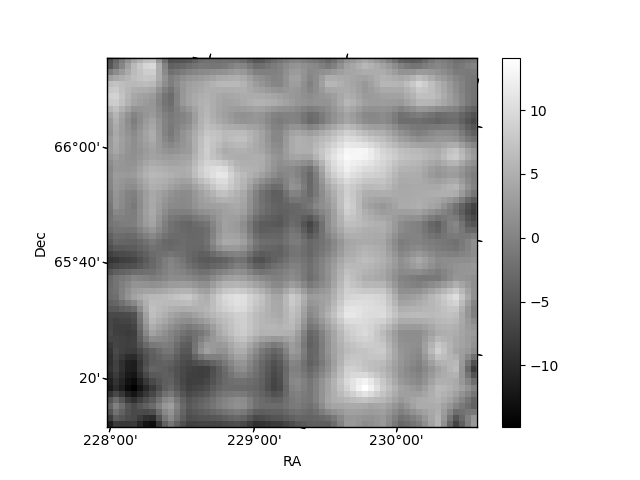
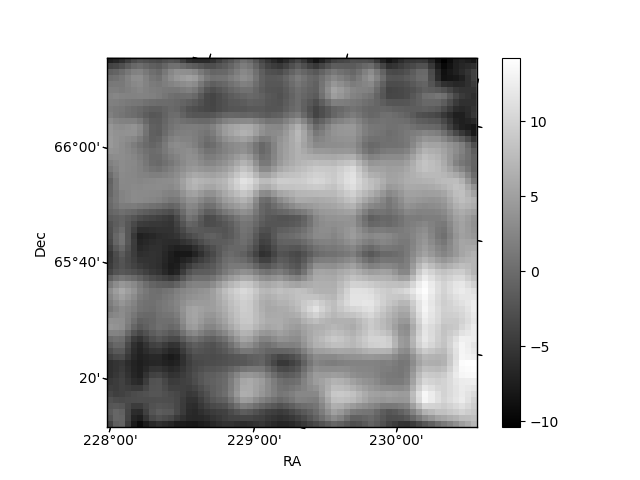
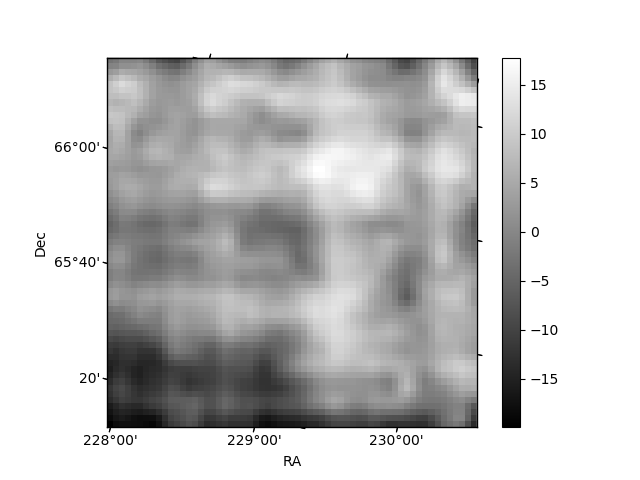
Histogram calculated using DETX and DETY for each event in the final _common_clean file
| Quadrant A | 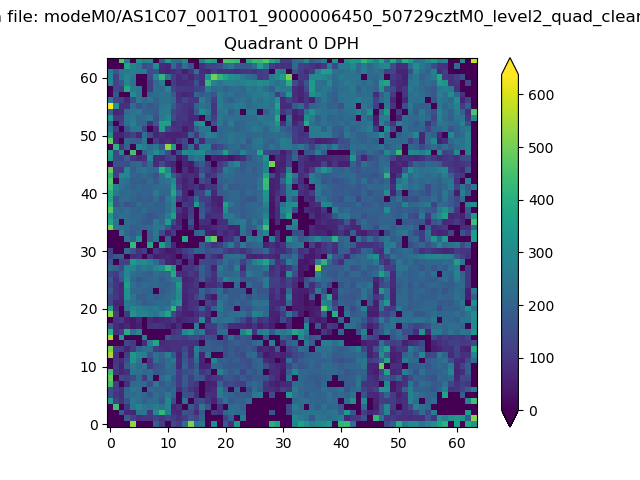 |
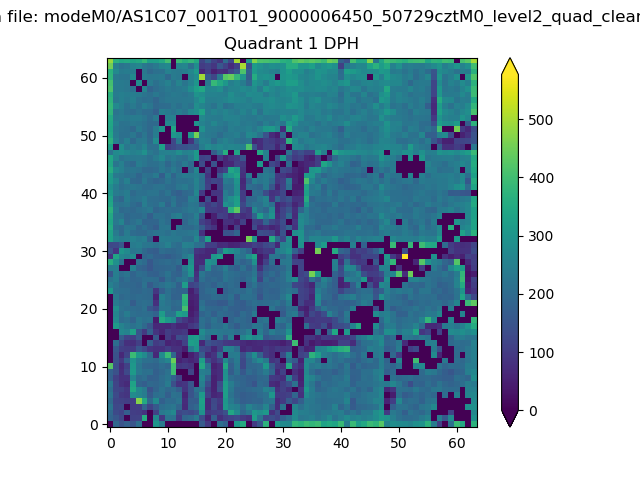 |
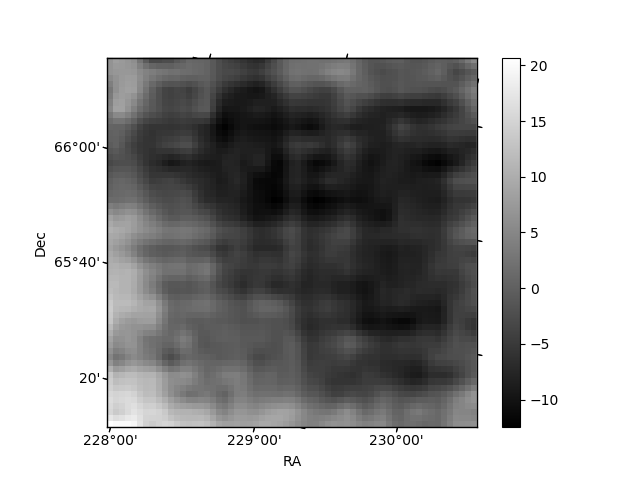
Quadrant B |
|---|---|---|---|
| Quadrant D | 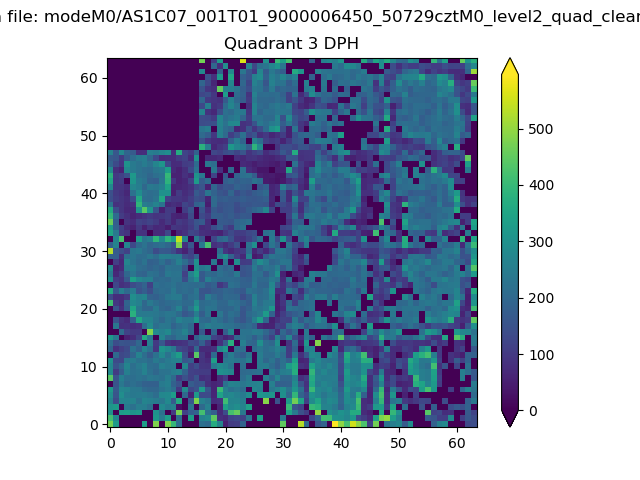 |
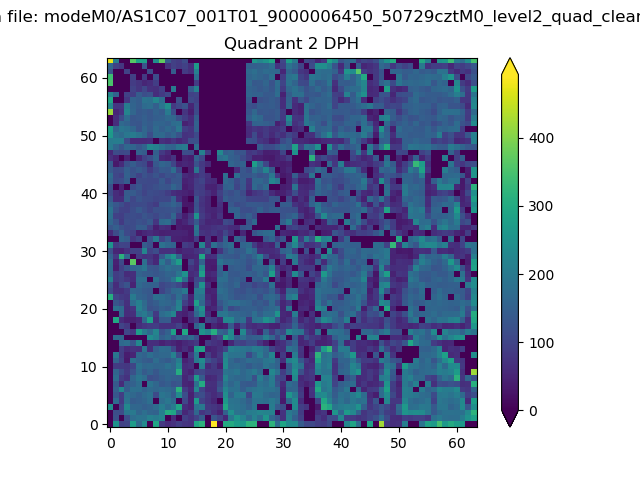 |
Quadrant C |
| Plot type | Count rate plots | Images |
|---|---|---|
| Comparison with Poisson distribution Blue bars denote a histogram of data divided into 1 sec bins. Red curve is a Poisson curve with rate = median count rate of data. |
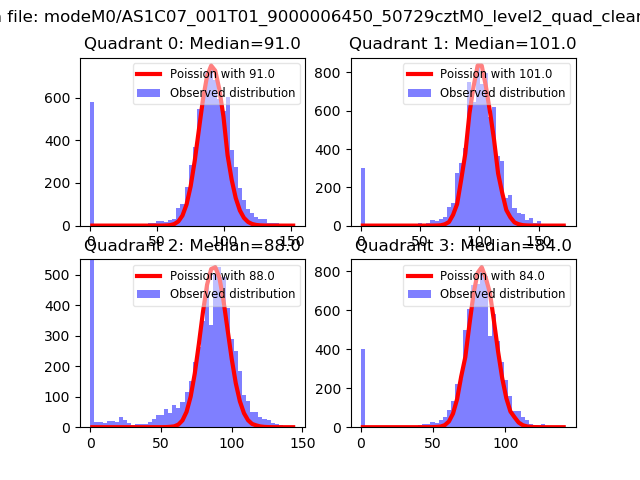 |
 |
| Quadrant-wise count rates Data is divided into 100 sec bins |
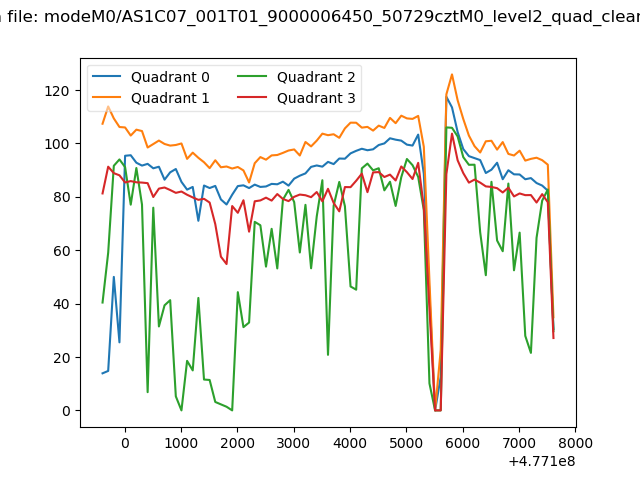 |
|
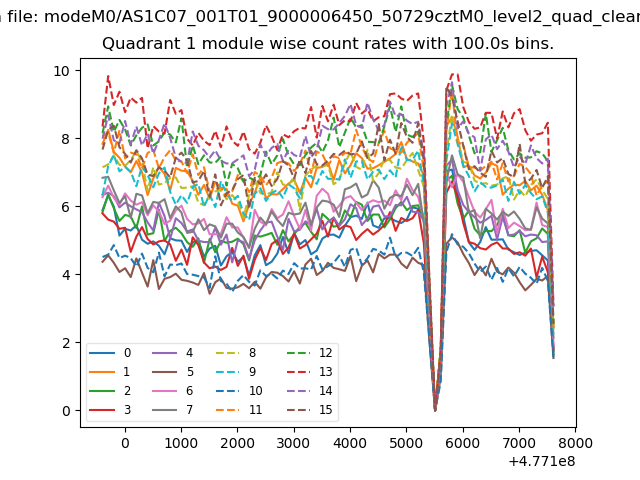
| Module-wise count rates for Quadrant A Data is divided into 100 sec bins |
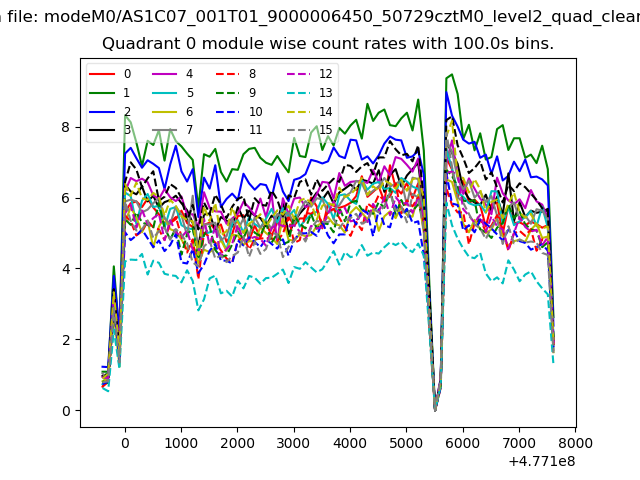 |
 |
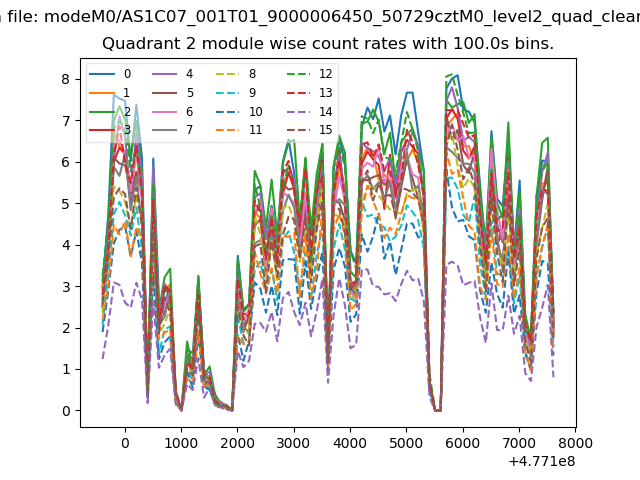
| Module-wise count rates for Quadrant B Data is divided into 100 sec bins |
 |
 |
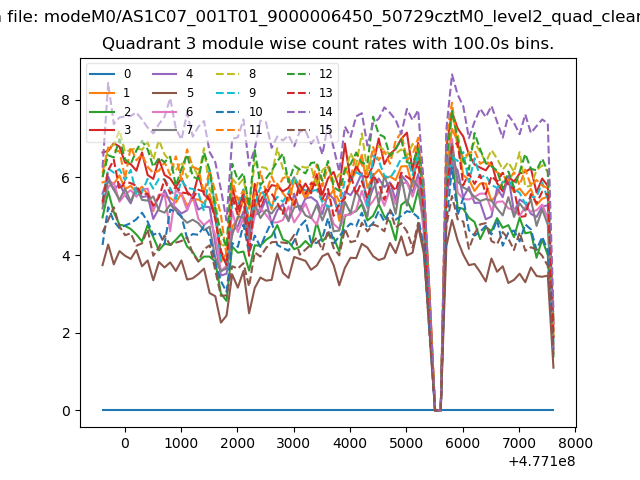
| Module-wise count rates for Quadrant C Data is divided into 100 sec bins |
 |
 |
| Module-wise count rates for Quadrant D Data is divided into 100 sec bins |
 |
 |
| Parameter | Plot |
|---|---|
| CZT HV Monitor | 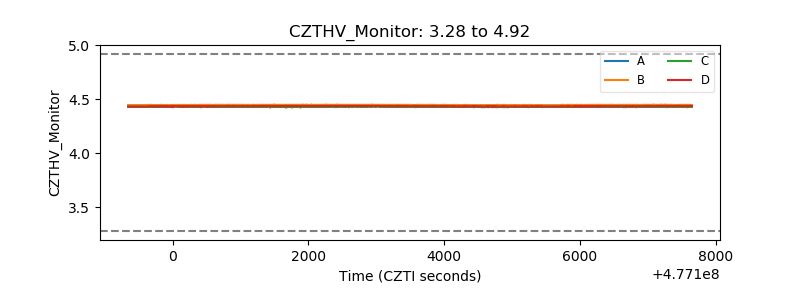 |
| D_VDD | 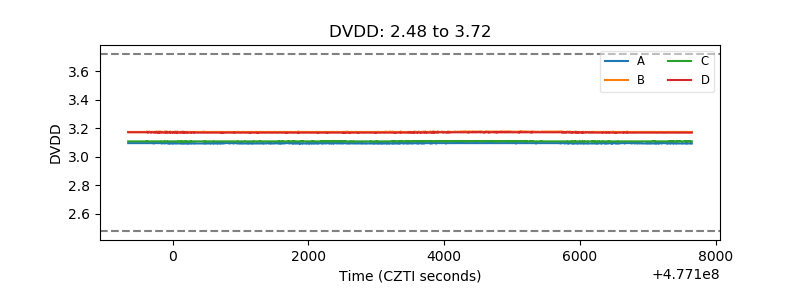 |
| Temperature 1 | 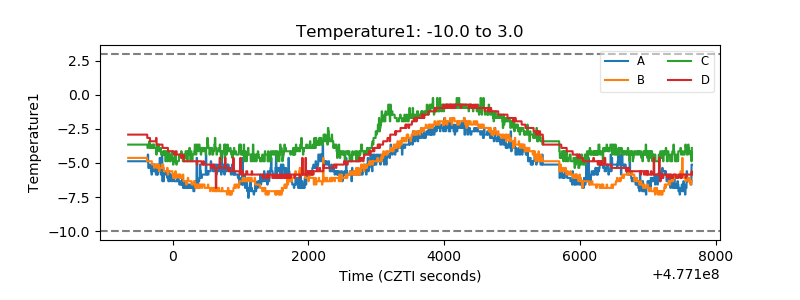 |
| Veto HV Monitor | 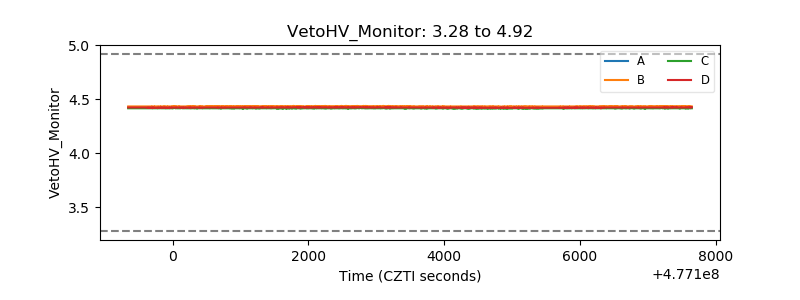 |
| Veto LLD | 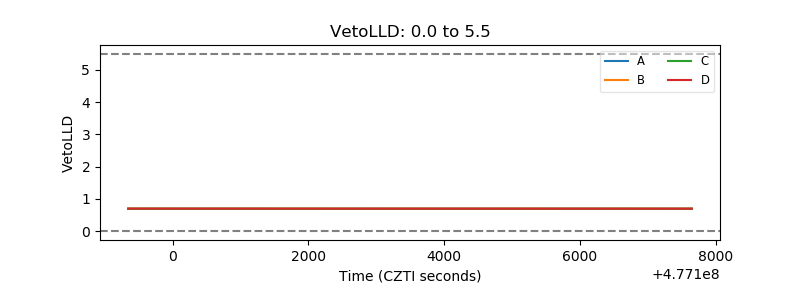 |
| Alpha Counter | 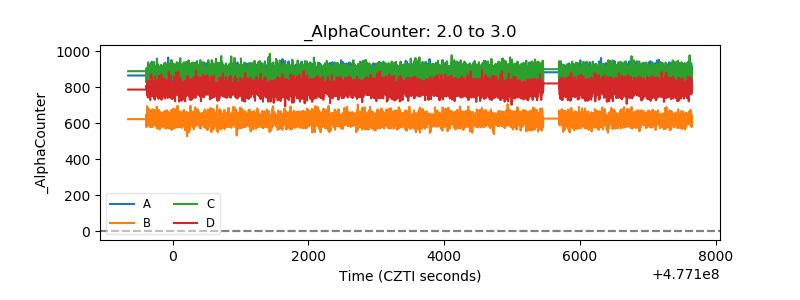 |
| _CPM_Rate | 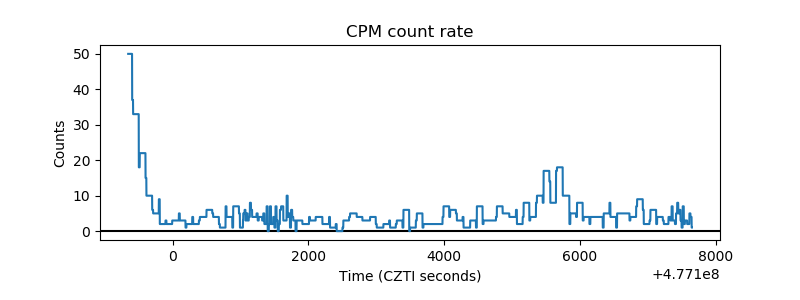 |
| CZT Counter | 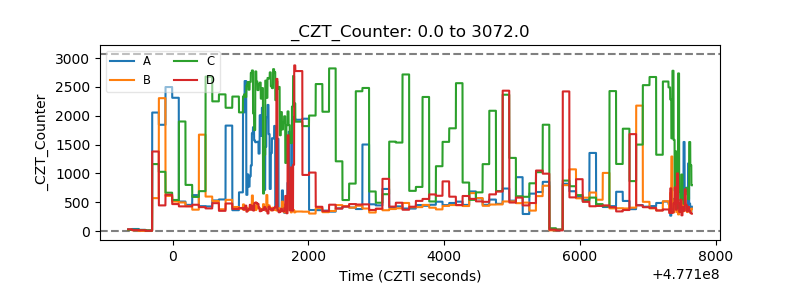 |
| +2.5 Volts monitor | 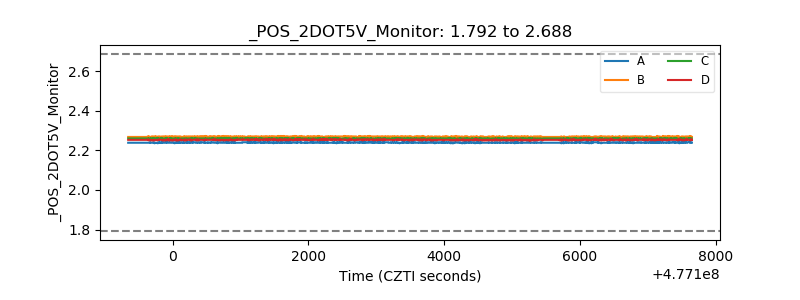 |
| +5 Volts monitor |  |
| _ROLL_ROT | 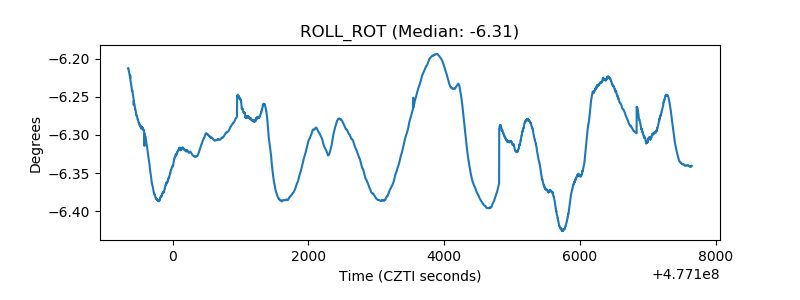 |
| _Roll_DEC | 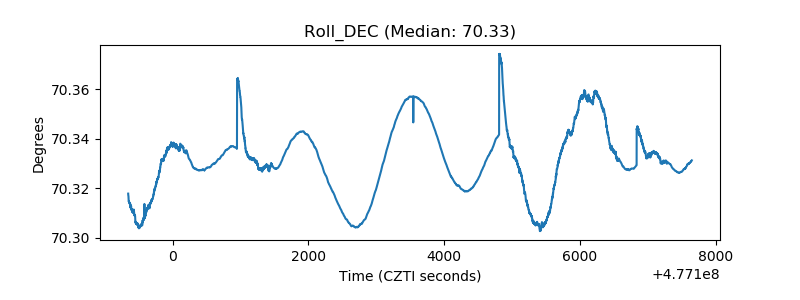 |
| _Roll_RA | 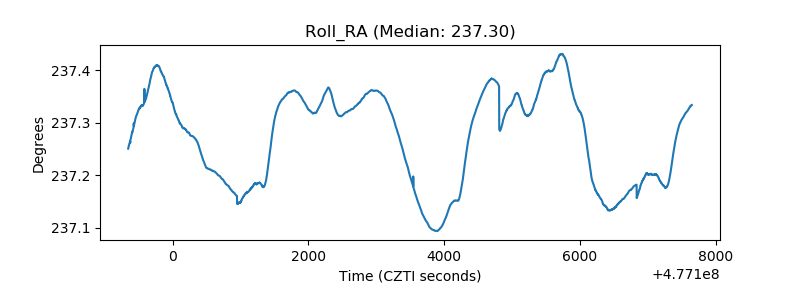 |
| Veto Counter | 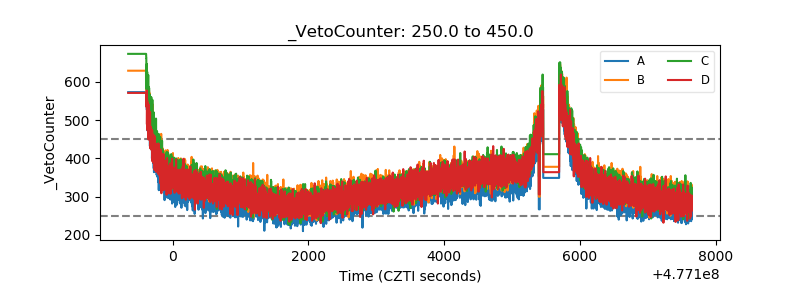 |