| Param | Original file | Final file |
|---|---|---|
| Filename | modeM0/AS1C07_001T01_9000006450_50731cztM0_level2.fits | modeM0/AS1C07_001T01_9000006450_50731cztM0_level2_quad_clean.evt |
| Size (bytes) | 704,226,240 | 104,503,680 |
| Size | 671.6 MB | 99.7 MB |
| Events in quadrant A | 4,847,397 | 712,153 |
| Events in quadrant B | 3,881,374 | 784,562 |
| Events in quadrant C | 10,498,228 | 516,246 |
| Events in quadrant D | 6,235,937 | 607,880 |
| Mode SS | |||
|---|---|---|---|
| Quadrant | BADHDUFLAG | Total packets | Discarded packets |
| A | 0 | 158 | 0 |
| B | 0 | 156 | 0 |
| C | 0 | 156 | 0 |
| D | 0 | 156 | 0 |
| Mode M0 | |||
|---|---|---|---|
| Quadrant | BADHDUFLAG | Total packets | Discarded packets |
| A | 0 | 19890 | 0 |
| B | 0 | 17237 | 0 |
| C | 0 | 36667 | 0 |
| D | 0 | 24131 | 0 |
| Quadrant | Total seconds | Saturated seconds | Saturation percentage |
|---|---|---|---|
| A | 7810 | 140 | 1.792574% |
| B | 7810 | 64 | 0.819462% |
| C | 7810 | 2299 | 29.436620% |
| D | 7810 | 587 | 7.516005% |
Noise dominated data is calculated using 1-second bins in cleaned event files. If a bin has >2000 counts, and if more than 50% of those come from <1% of pixels, then it is considered to be noise-dominated and hence unusable.
| Quadrant | # 1 sec bins | Bins with >0 counts | Bins with >2000 counts | High rate bins dominated by noise | Noise dominated (total time) | Noise dominated (detector-on time) | Marked lightcurve |
|---|---|---|---|---|---|---|---|
| A | 7810 | 7810 | 119 | 119 | 1.52% | 1.52% | 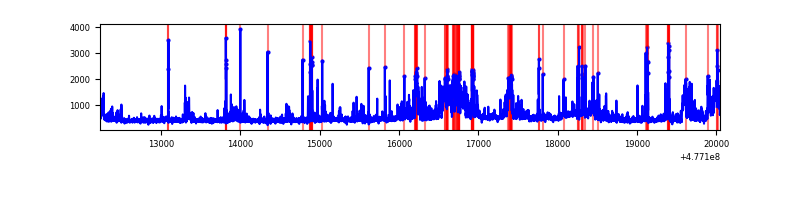 |
| B | 7810 | 7810 | 35 | 35 | 0.45% | 0.45% | 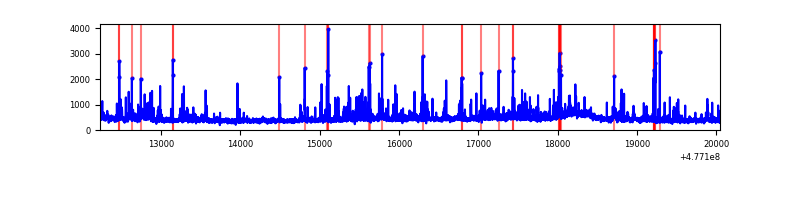 |
| C | 7809 | 7809 | 1952 | 1952 | 25.00% | 25.00% | 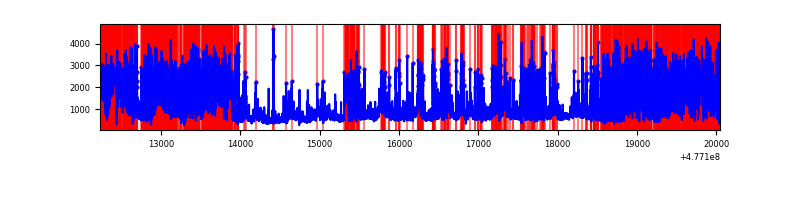 |
| D | 7810 | 7810 | 537 | 537 | 6.88% | 6.88% | 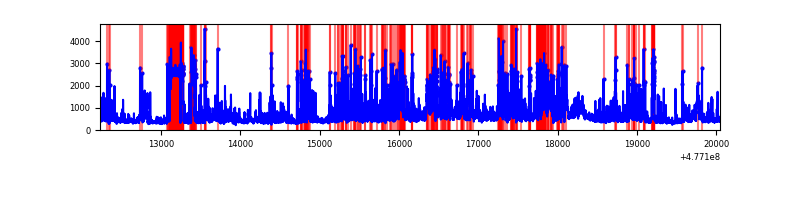 |
Top three noisy pixels from each quadrant. If the there are fewer than three noisy pixels in the level2.evt file, extra rows are filled as -1
| Pixel properties | Quadrant properties | ||||||
|---|---|---|---|---|---|---|---|
| Quadrant | DetID | PixID | Counts | Sigma | Mean | Median | Sigma |
| A | 12 | 80 | 823432 | 4135.27 | 807 | 786 | 198.9 |
| A | 5 | 240 | 131961 | 659.39 | 807 | 786 | 198.9 |
| A | 0 | 31 | 123289 | 615.8 | 807 | 786 | 198.9 |
| B | 8 | 128 | 146614 | 835.81 | 812 | 782 | 174.5 |
| B | 0 | 213 | 96651 | 549.46 | 812 | 782 | 174.5 |
| B | 10 | 247 | 83920 | 476.49 | 812 | 782 | 174.5 |
| C | 15 | 179 | 4220659 | 22512.38 | 686 | 685 | 187.5 |
| C | 5 | 10 | 1338024 | 7134.33 | 686 | 685 | 187.5 |
| C | 15 | 174 | 513667 | 2736.62 | 686 | 685 | 187.5 |
| D | 1 | 47 | 935303 | 4461.72 | 753 | 727 | 209.5 |
| D | 15 | 108 | 441740 | 2105.42 | 753 | 727 | 209.5 |
| D | 15 | 93 | 420048 | 2001.86 | 753 | 727 | 209.5 |
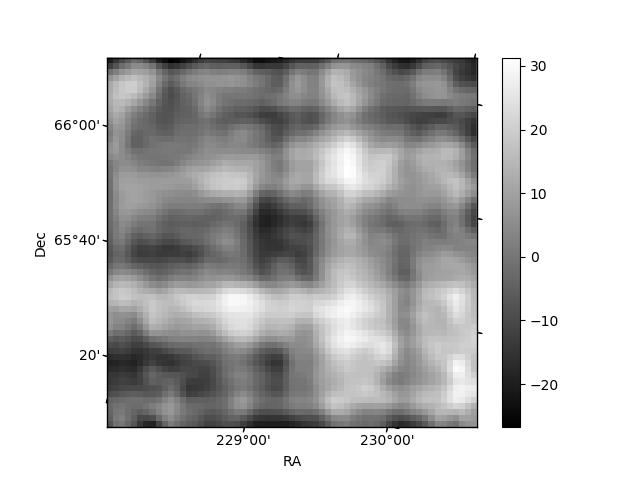
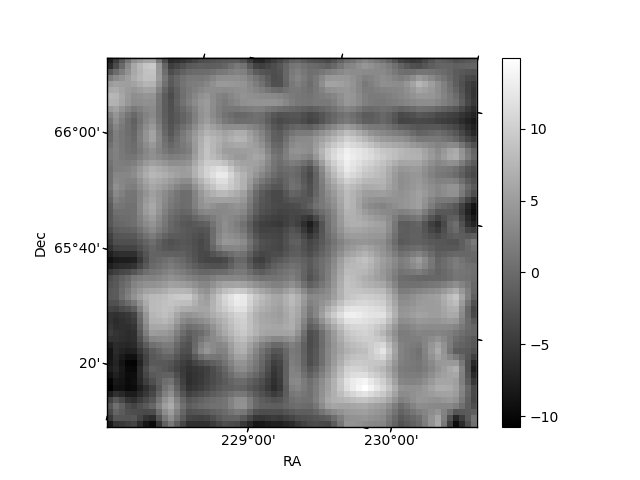
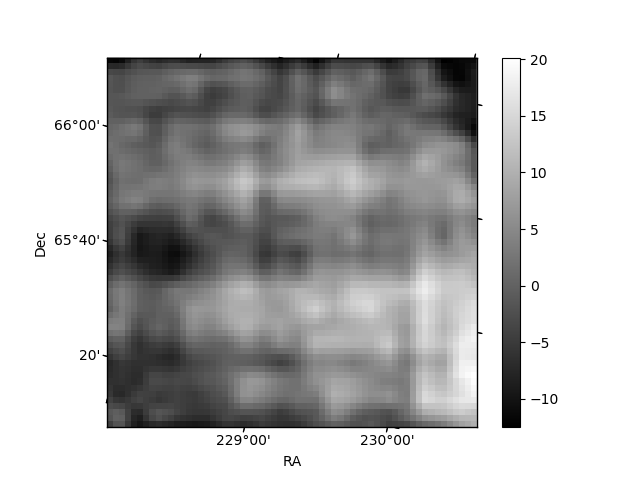
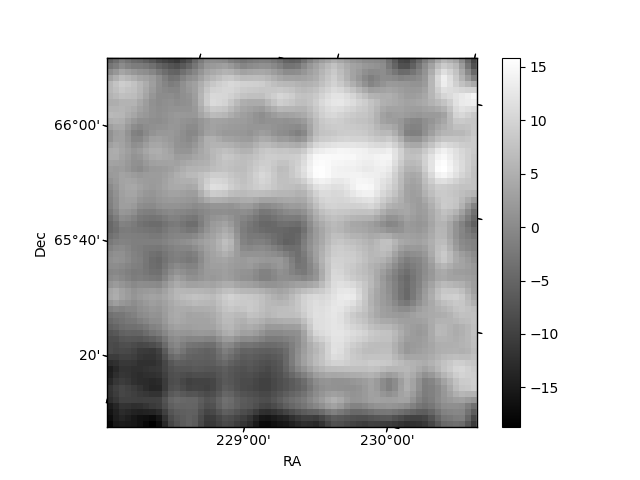
Histogram calculated using DETX and DETY for each event in the final _common_clean file
| Quadrant A | 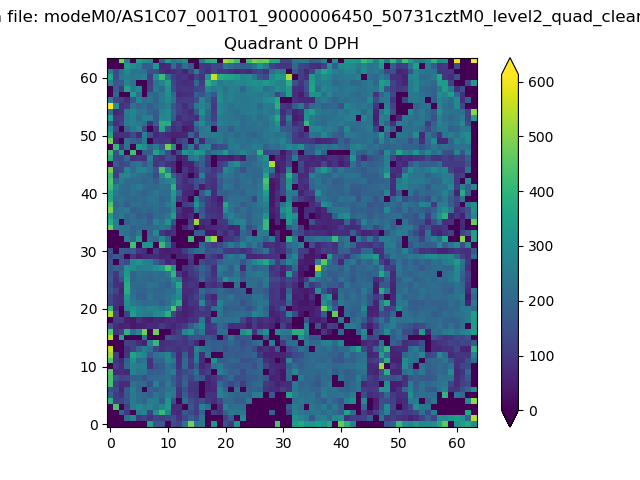 |
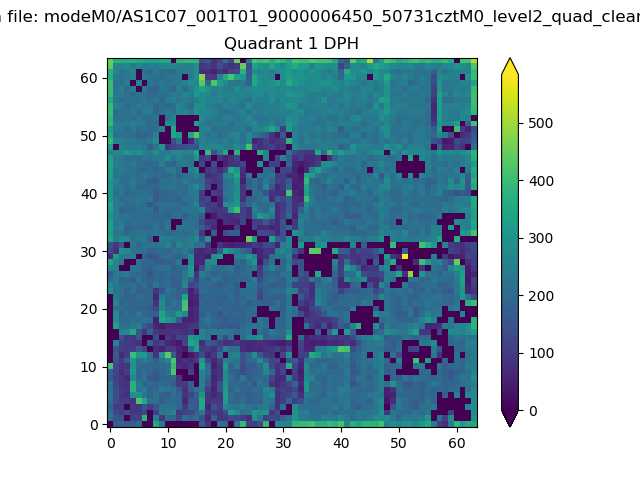 |
Quadrant B |
|---|---|---|---|
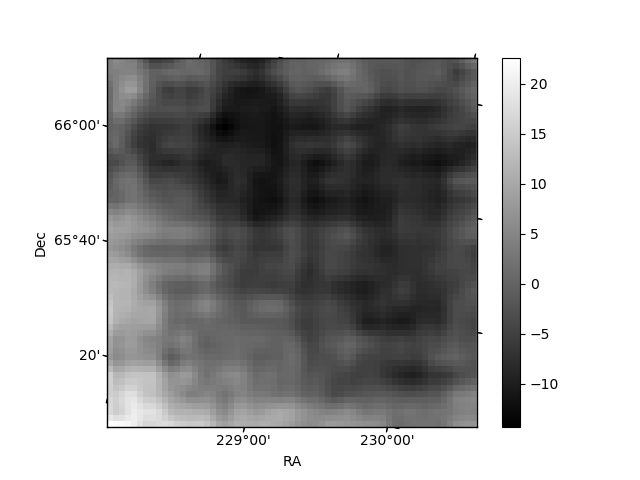
| Quadrant D | 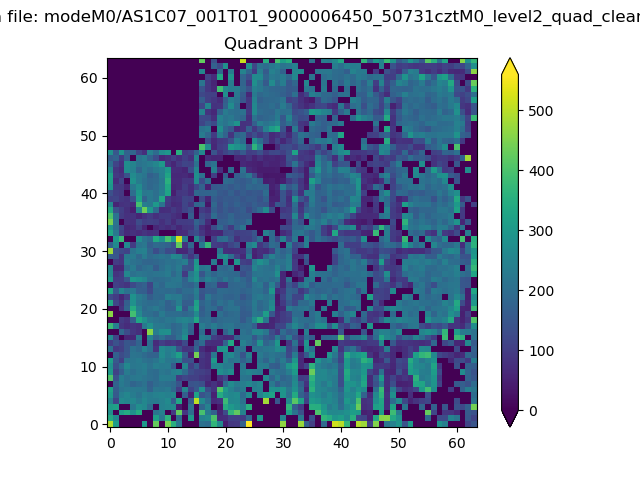 |
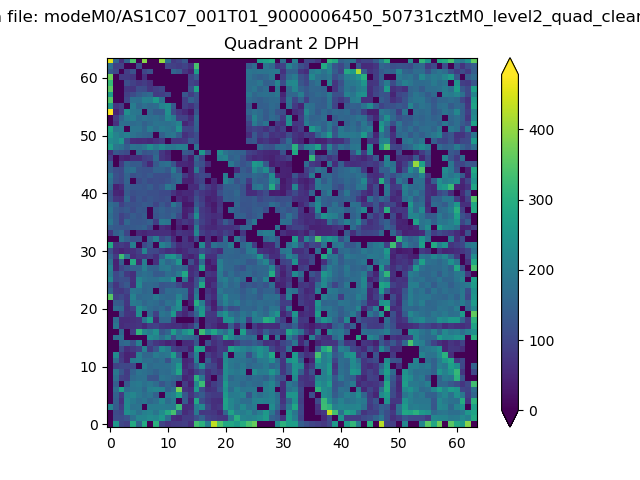 |
Quadrant C |
| Plot type | Count rate plots | Images |
|---|---|---|
| Comparison with Poisson distribution Blue bars denote a histogram of data divided into 1 sec bins. Red curve is a Poisson curve with rate = median count rate of data. |
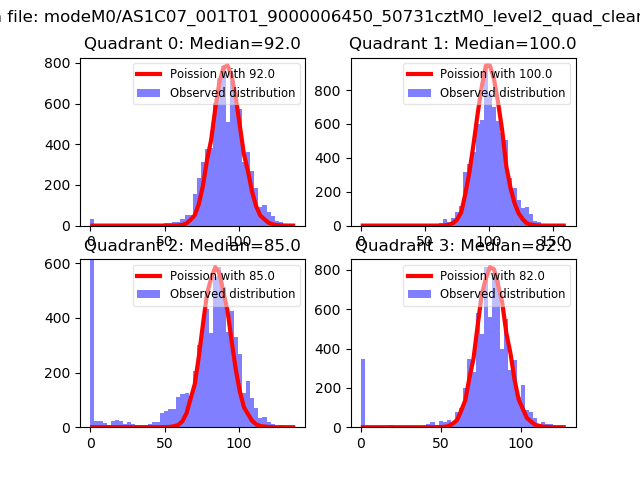 |
 |
| Quadrant-wise count rates Data is divided into 100 sec bins |
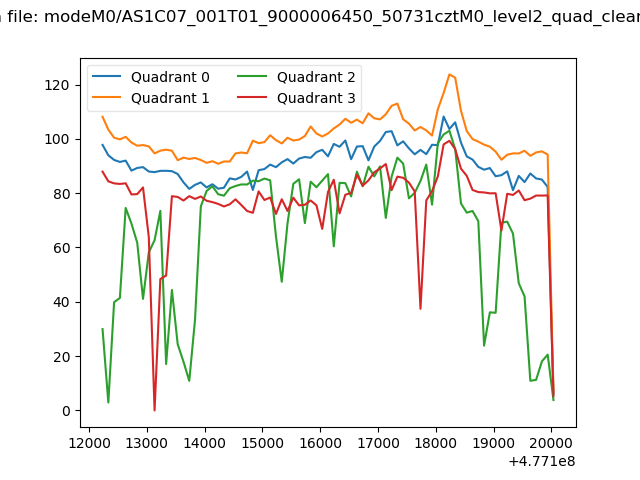 |
|
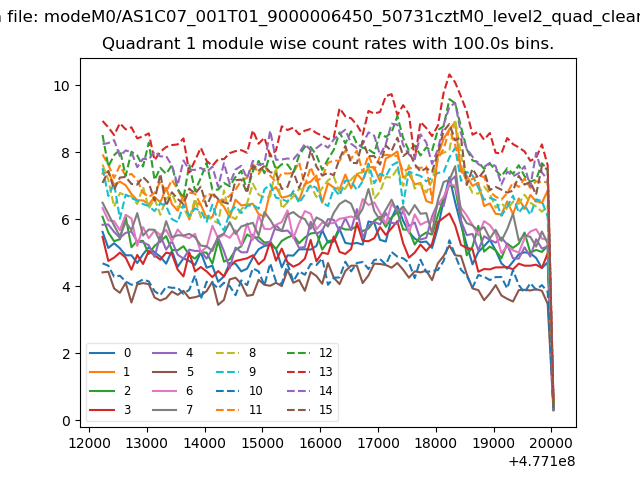
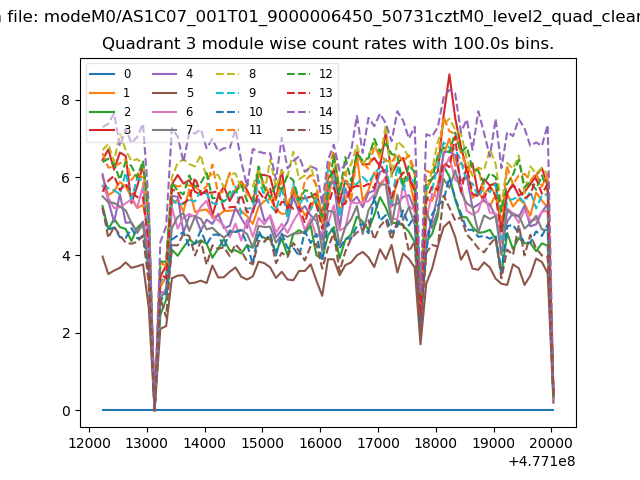
| Module-wise count rates for Quadrant A Data is divided into 100 sec bins |
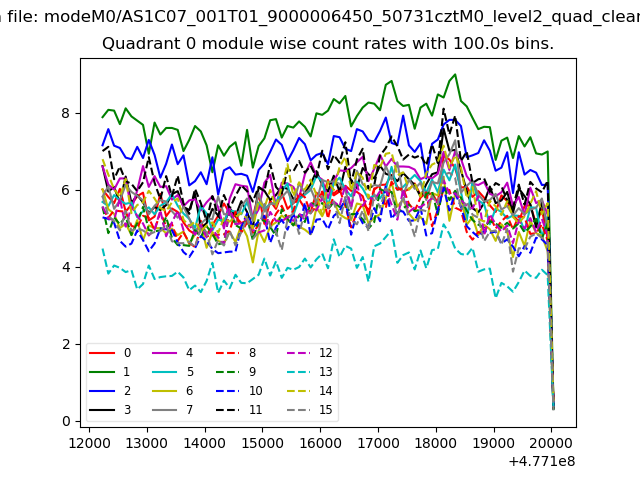 |
 |
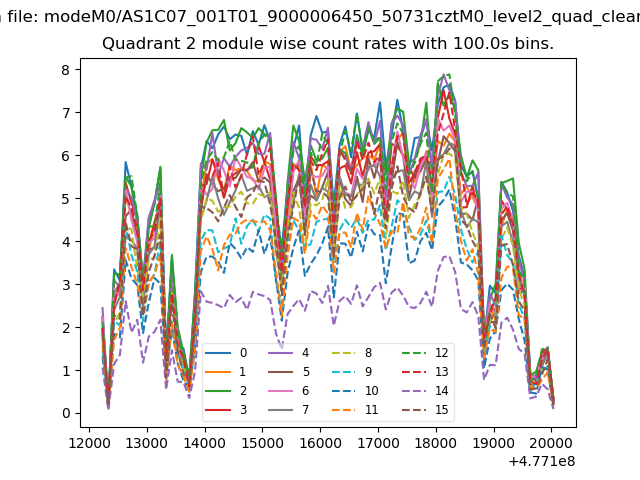
| Module-wise count rates for Quadrant B Data is divided into 100 sec bins |
 |
 |
| Module-wise count rates for Quadrant C Data is divided into 100 sec bins |
 |
 |
| Module-wise count rates for Quadrant D Data is divided into 100 sec bins |
 |
 |
| Parameter | Plot |
|---|---|
| CZT HV Monitor | 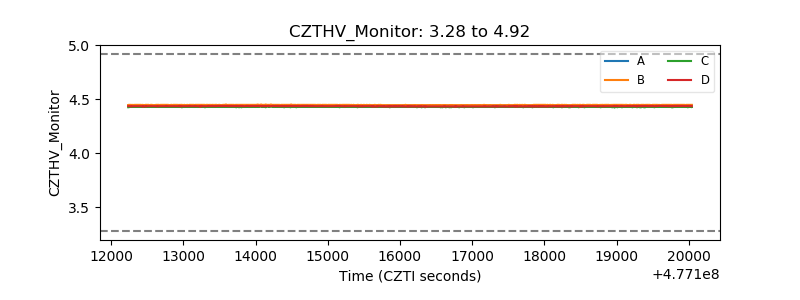 |
| D_VDD | 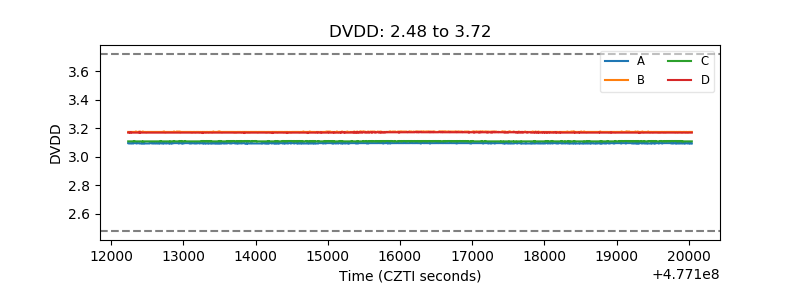 |
| Temperature 1 | 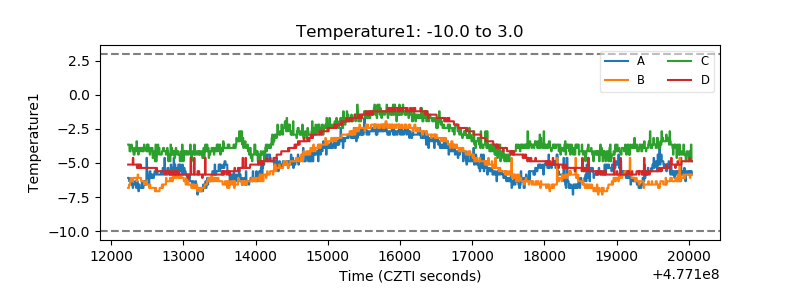 |
| Veto HV Monitor | 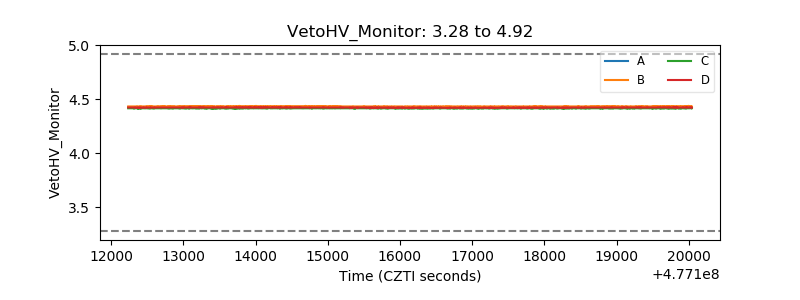 |
| Veto LLD | 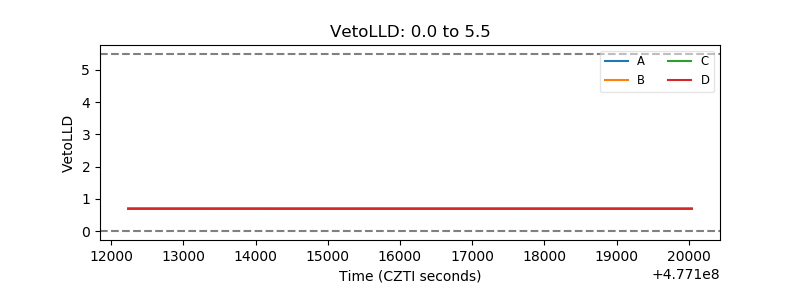 |
| Alpha Counter | 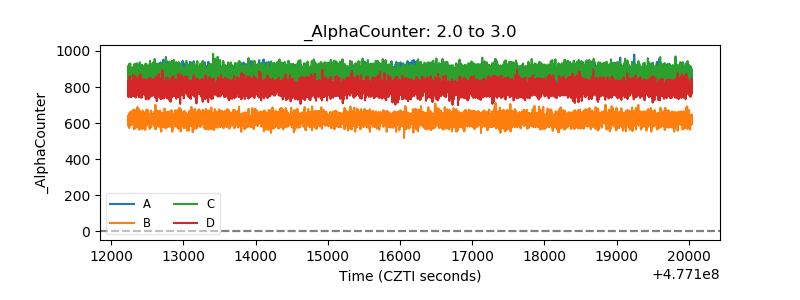 |
| _CPM_Rate | 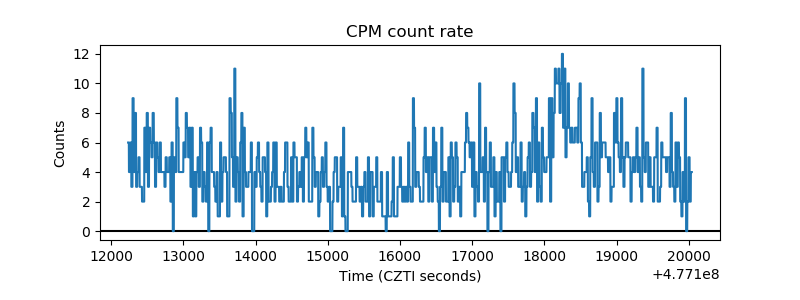 |
| CZT Counter | 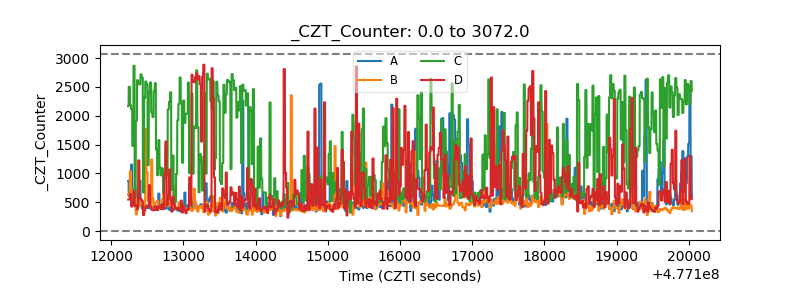 |
| +2.5 Volts monitor | 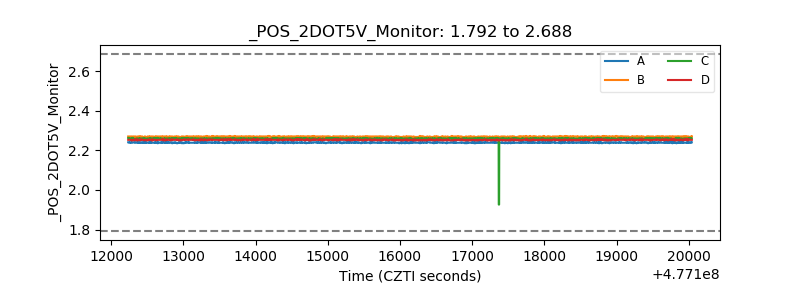 |
| +5 Volts monitor |  |
| _ROLL_ROT | 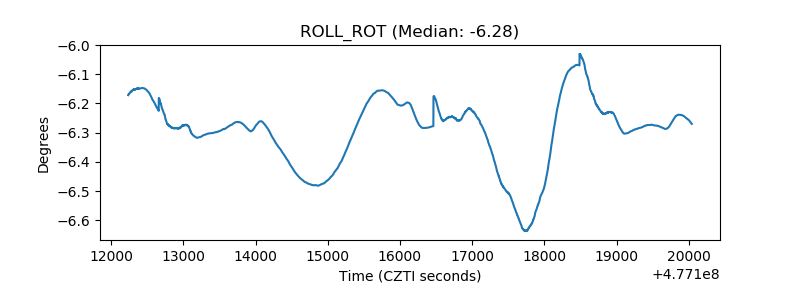 |
| _Roll_DEC | 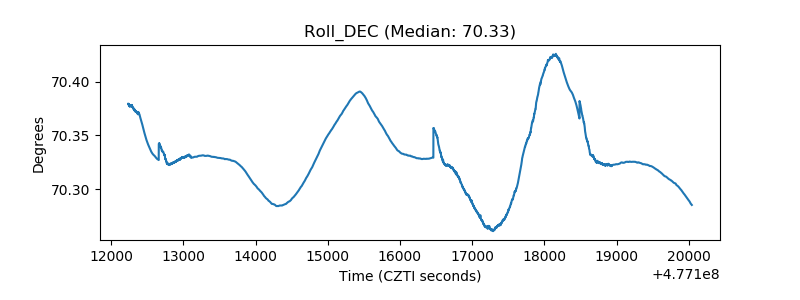 |
| _Roll_RA | 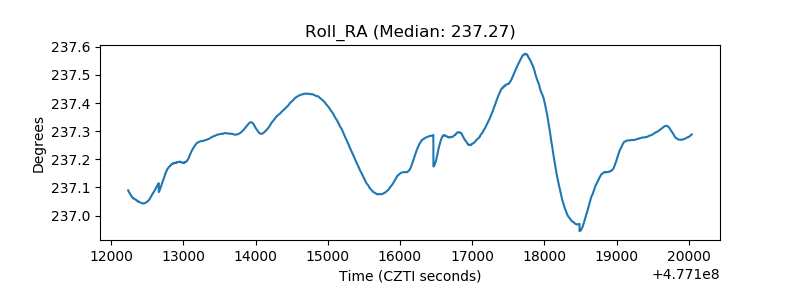 |
| Veto Counter | 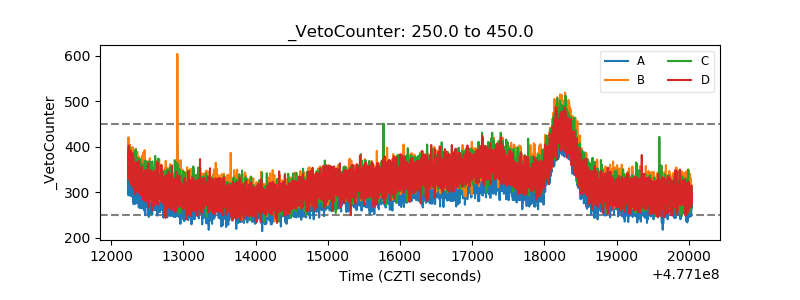 |