| Param | Original file | Final file |
|---|---|---|
| Filename | modeM0/AS1C07_001T01_9000006450_50734cztM0_level2.fits | modeM0/AS1C07_001T01_9000006450_50734cztM0_level2_quad_clean.evt |
| Size (bytes) | 658,152,000 | 92,416,320 |
| Size | 627.7 MB | 88.1 MB |
| Events in quadrant A | 7,287,694 | 610,675 |
| Events in quadrant B | 3,738,313 | 687,634 |
| Events in quadrant C | 7,719,018 | 472,238 |
| Events in quadrant D | 5,082,660 | 545,187 |
| Mode SS | |||
|---|---|---|---|
| Quadrant | BADHDUFLAG | Total packets | Discarded packets |
| A | 0 | 160 | 16 |
| B | 0 | 160 | 18 |
| C | 0 | 164 | 16 |
| D | 0 | 163 | 19 |
| Mode M0 | |||
|---|---|---|---|
| Quadrant | BADHDUFLAG | Total packets | Discarded packets |
| A | 0 | 29099 | 2649 |
| B | 0 | 18030 | 2078 |
| C | 0 | 35219 | 7772 |
| D | 0 | 23690 | 3777 |
| Mode M9 | |||
|---|---|---|---|
| Quadrant | BADHDUFLAG | Total packets | Discarded packets |
| A | 0 | 13 | 6 |
| B | 0 | 12 | 5 |
| C | 0 | 11 | 5 |
| D | 0 | 10 | 3 |
| Quadrant | Total seconds | Saturated seconds | Saturation percentage |
|---|---|---|---|
| A | 6963 | 573 | 8.229212% |
| B | 7025 | 211 | 3.003559% |
| C | 6723 | 1575 | 23.427041% |
| D | 6911 | 412 | 5.961511% |
Noise dominated data is calculated using 1-second bins in cleaned event files. If a bin has >2000 counts, and if more than 50% of those come from <1% of pixels, then it is considered to be noise-dominated and hence unusable.
| Quadrant | # 1 sec bins | Bins with >0 counts | Bins with >2000 counts | High rate bins dominated by noise | Noise dominated (total time) | Noise dominated (detector-on time) | Marked lightcurve |
|---|---|---|---|---|---|---|---|
| A | 9207 | 7195 | 523 | 523 | 5.68% | 7.27% | 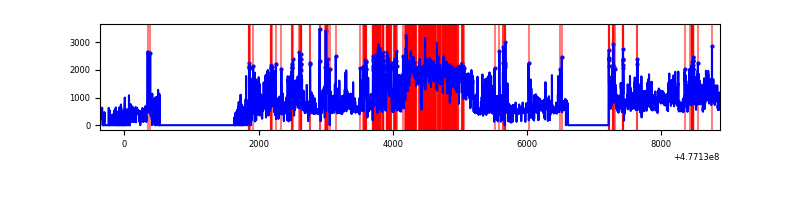 |
| B | 9237 | 7233 | 62 | 62 | 0.67% | 0.86% |  |
| C | 9016 | 6846 | 1380 | 1380 | 15.31% | 20.16% | 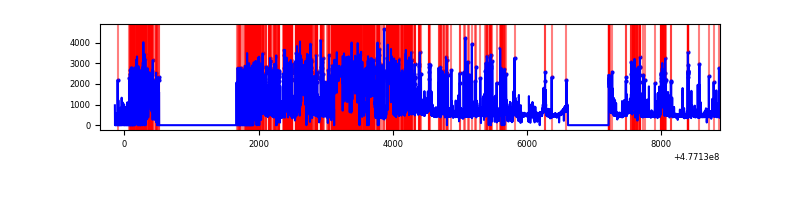 |
| D | 9238 | 7114 | 271 | 271 | 2.93% | 3.81% | 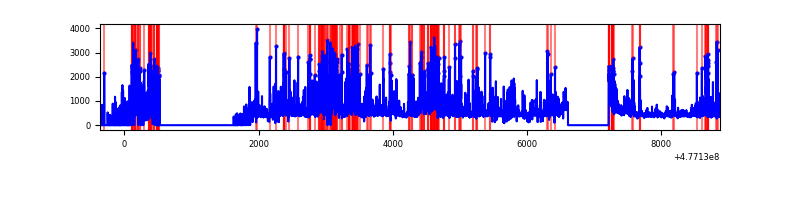 |
Top three noisy pixels from each quadrant. If the there are fewer than three noisy pixels in the level2.evt file, extra rows are filled as -1
| Pixel properties | Quadrant properties | ||||||
|---|---|---|---|---|---|---|---|
| Quadrant | DetID | PixID | Counts | Sigma | Mean | Median | Sigma |
| A | 12 | 80 | 2827080 | 15180.26 | 744 | 723 | 186.2 |
| A | 4 | 4 | 736630 | 3952.53 | 744 | 723 | 186.2 |
| A | 4 | 3 | 149052 | 796.67 | 744 | 723 | 186.2 |
| B | 8 | 128 | 172925 | 1076.22 | 749 | 722 | 160.0 |
| B | 3 | 249 | 115717 | 718.69 | 749 | 722 | 160.0 |
| B | 5 | 172 | 83731 | 518.78 | 749 | 722 | 160.0 |
| C | 15 | 179 | 3035824 | 17423.65 | 627 | 621 | 174.2 |
| C | 5 | 10 | 913661 | 5241.32 | 627 | 621 | 174.2 |
| C | 9 | 38 | 185910 | 1063.66 | 627 | 621 | 174.2 |
| D | 2 | 226 | 437423 | 2228.34 | 705 | 679 | 196.0 |
| D | 1 | 47 | 389372 | 1983.17 | 705 | 679 | 196.0 |
| D | 2 | 249 | 302864 | 1541.8 | 705 | 679 | 196.0 |
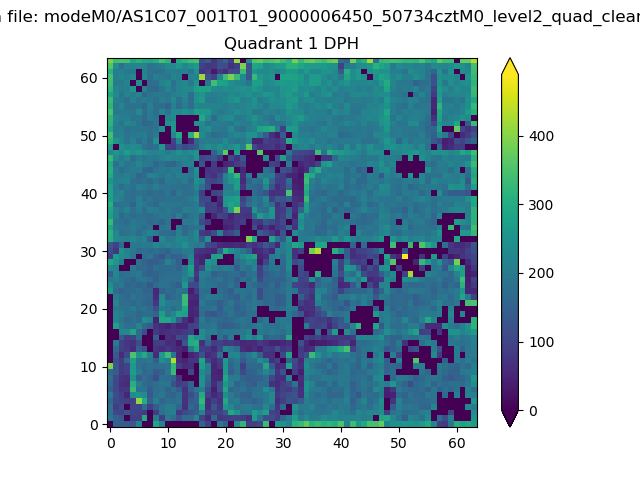
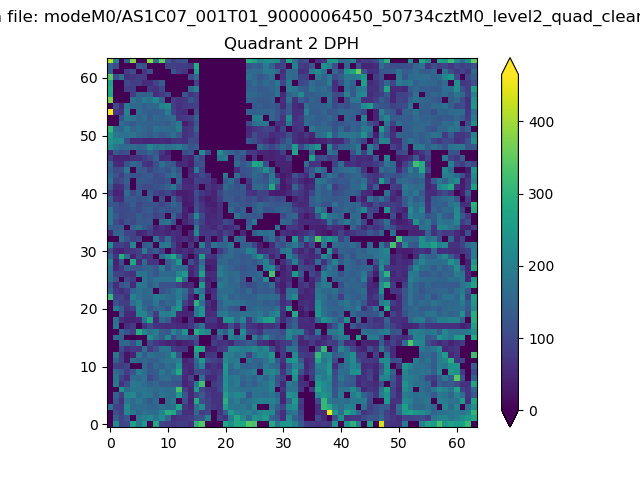
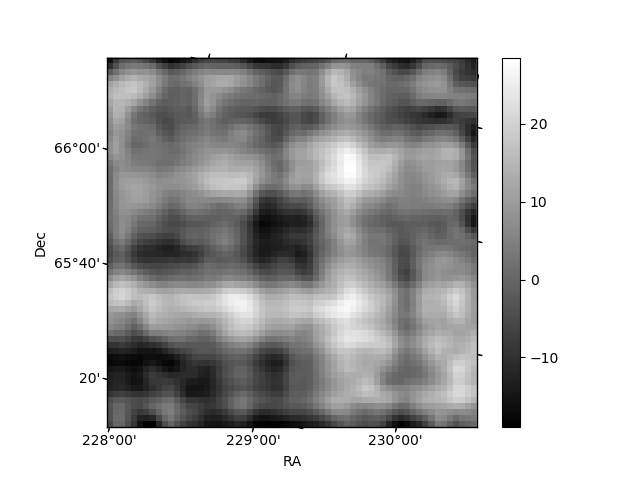
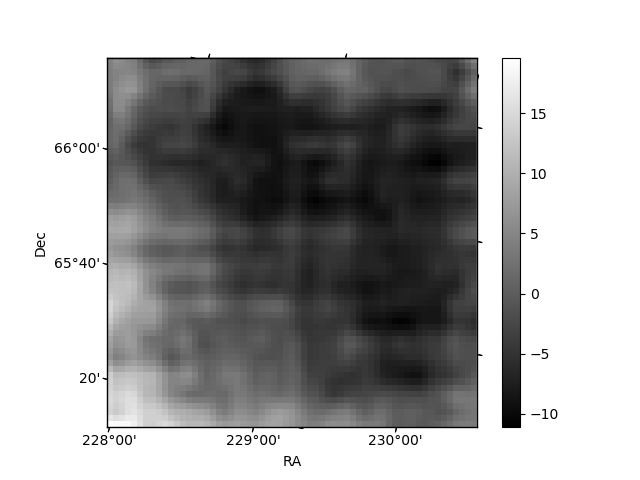
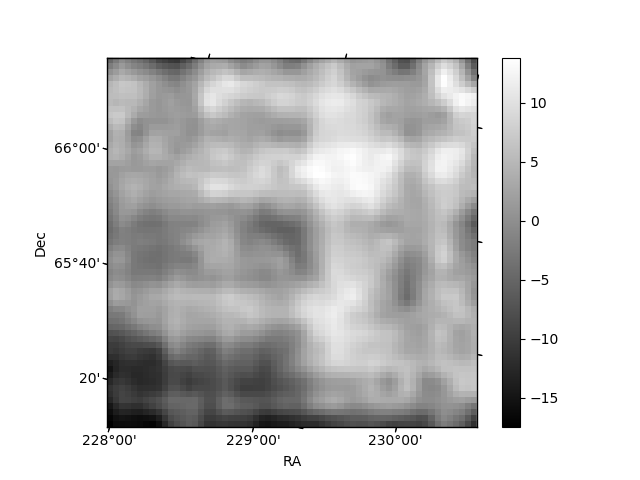
Histogram calculated using DETX and DETY for each event in the final _common_clean file
| Quadrant A | 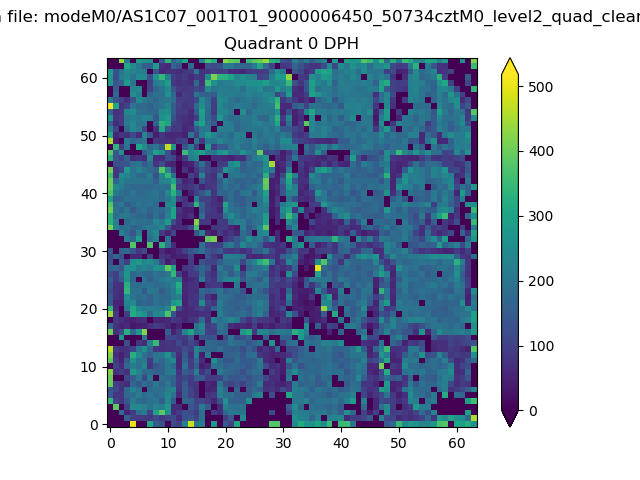 |
 |
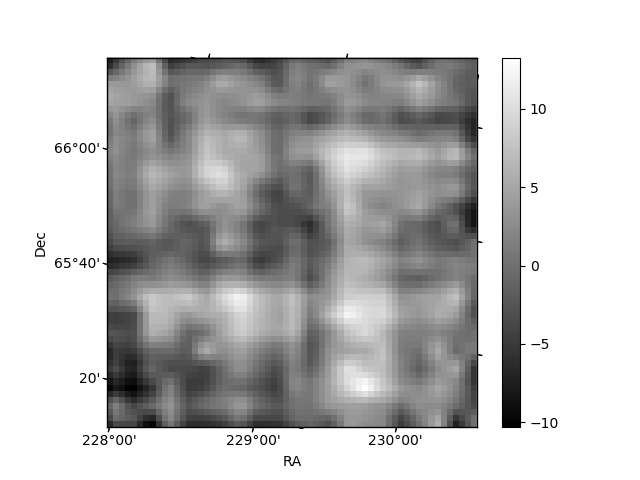
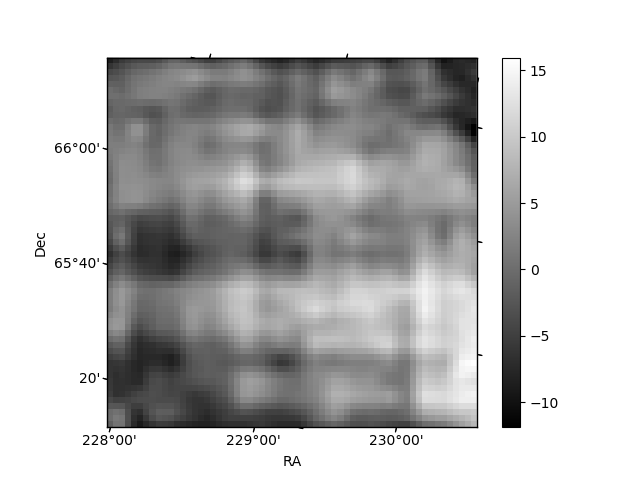
Quadrant B |
|---|---|---|---|
| Quadrant D | 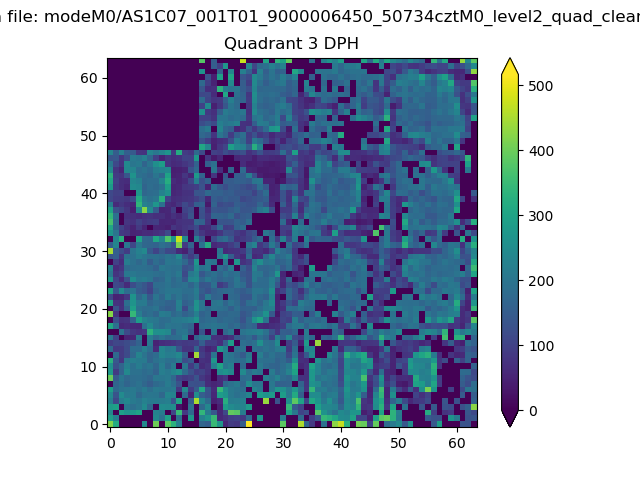 |
 |
Quadrant C |
| Plot type | Count rate plots | Images |
|---|---|---|
| Comparison with Poisson distribution Blue bars denote a histogram of data divided into 1 sec bins. Red curve is a Poisson curve with rate = median count rate of data. |
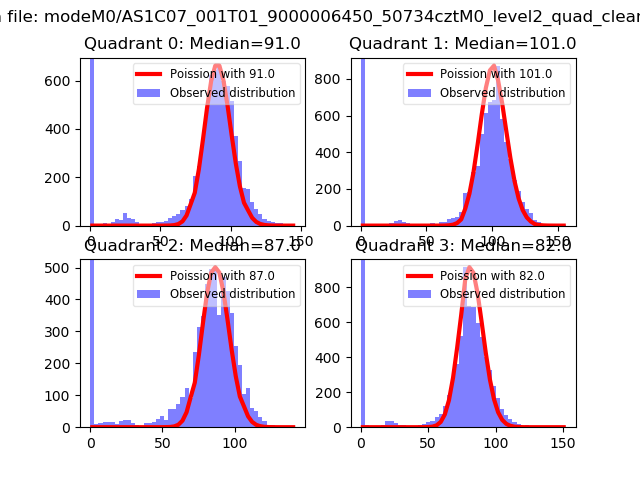 |
 |
| Quadrant-wise count rates Data is divided into 100 sec bins |
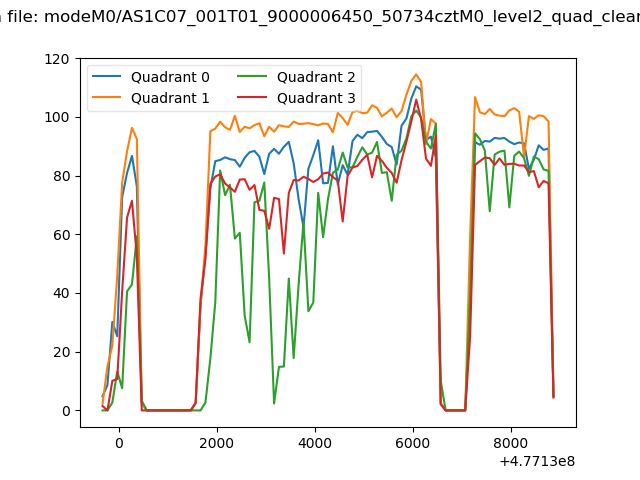 |
|
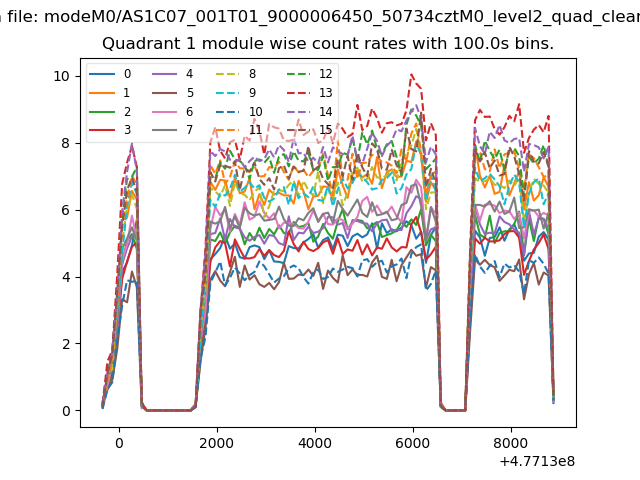
| Module-wise count rates for Quadrant A Data is divided into 100 sec bins |
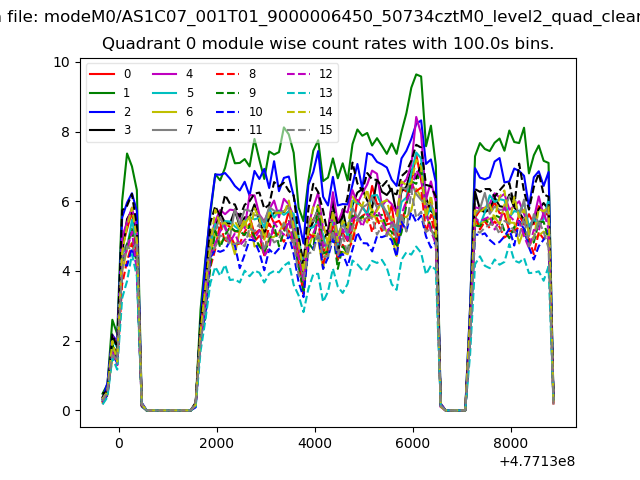 |
 |
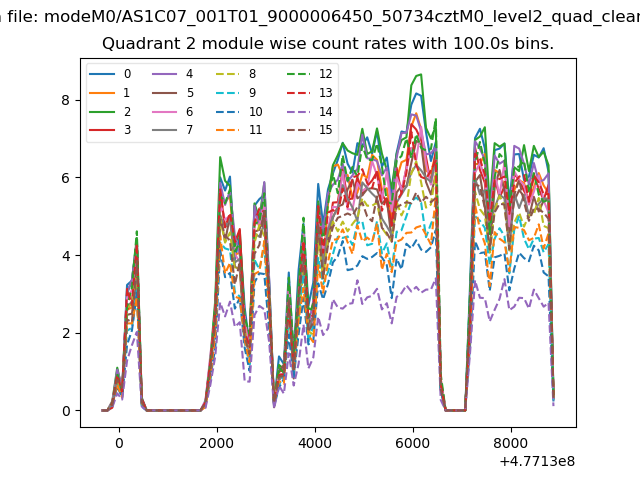
| Module-wise count rates for Quadrant B Data is divided into 100 sec bins |
 |
 |
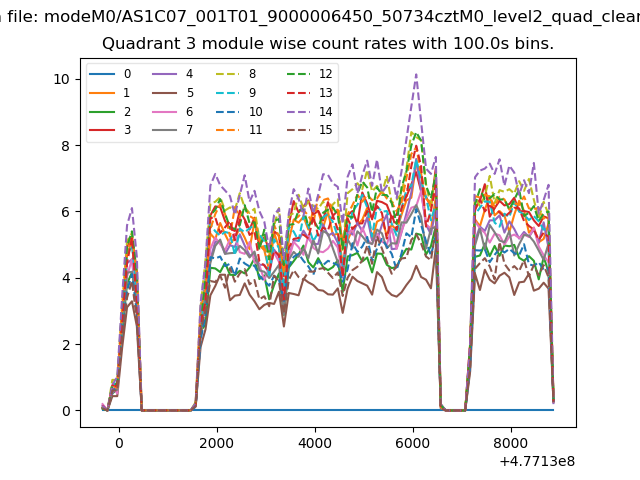
| Module-wise count rates for Quadrant C Data is divided into 100 sec bins |
 |
 |
| Module-wise count rates for Quadrant D Data is divided into 100 sec bins |
 |
 |
| Parameter | Plot |
|---|---|
| CZT HV Monitor | 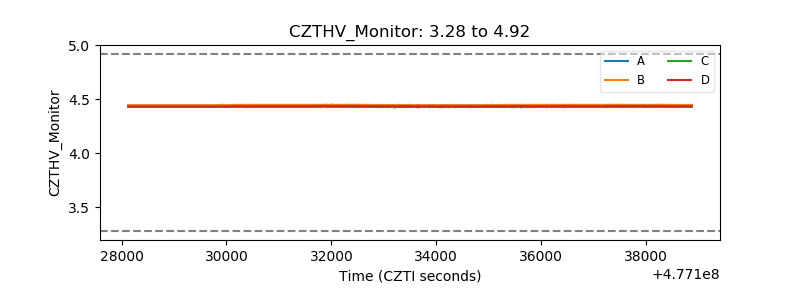 |
| D_VDD | 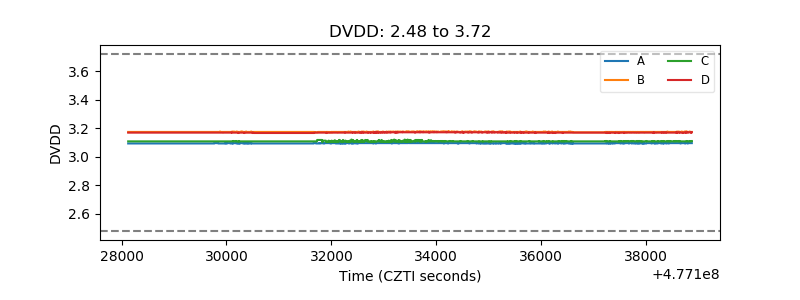 |
| Temperature 1 | 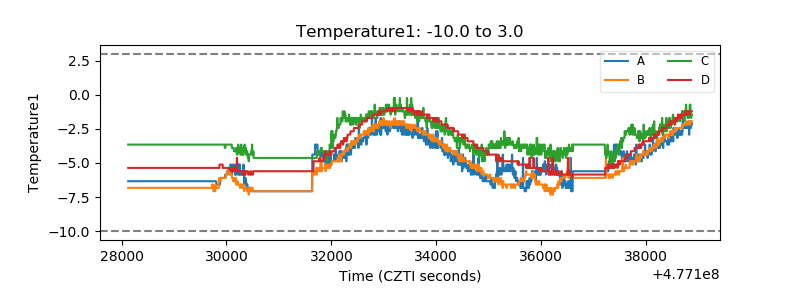 |
| Veto HV Monitor | 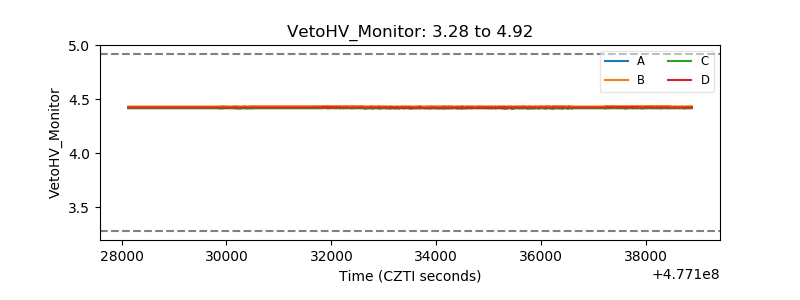 |
| Veto LLD | 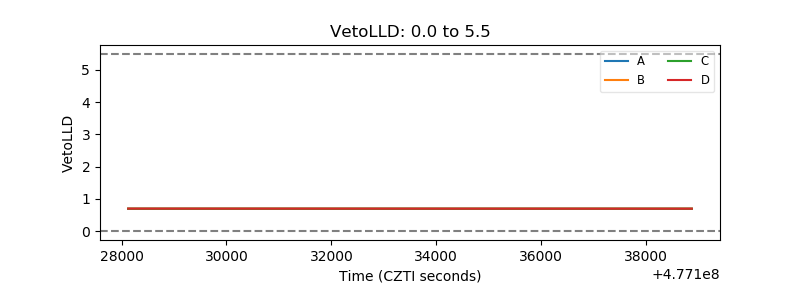 |
| Alpha Counter | 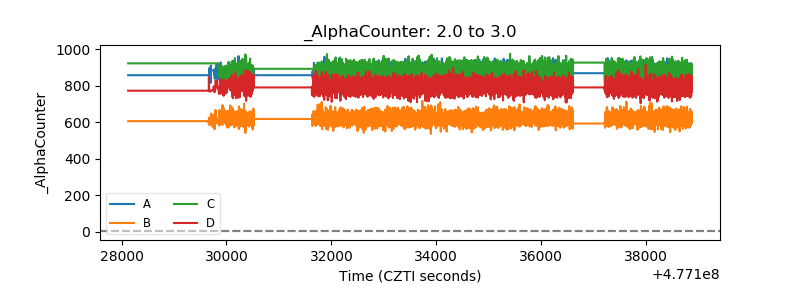 |
| _CPM_Rate | 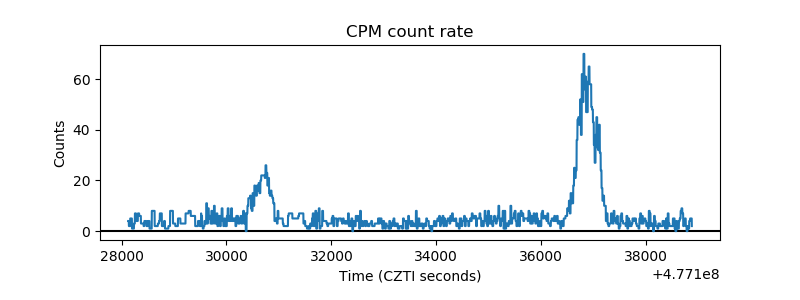 |
| CZT Counter | 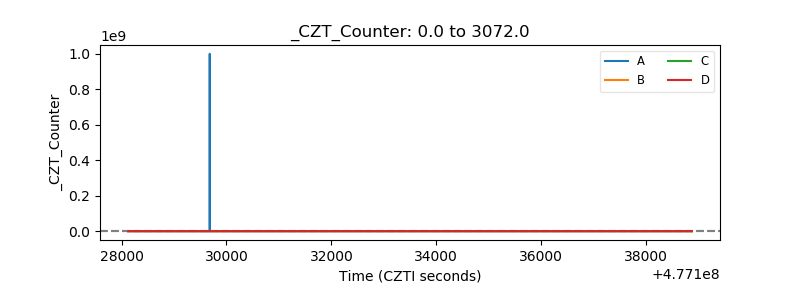 |
| +2.5 Volts monitor | 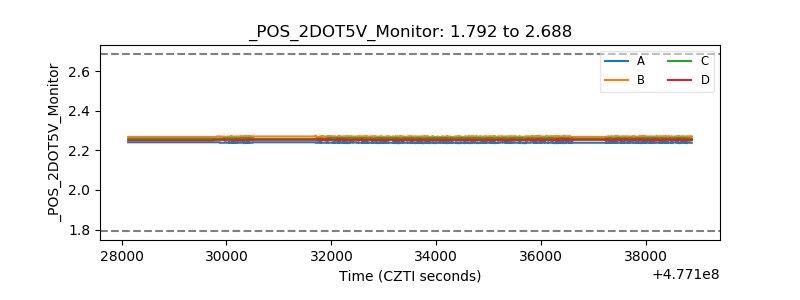 |
| +5 Volts monitor |  |
| _ROLL_ROT | 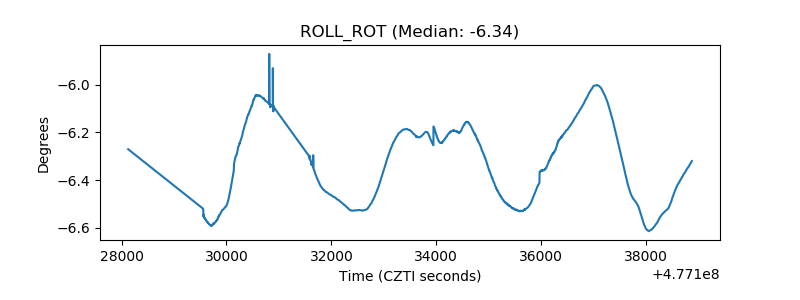 |
| _Roll_DEC | 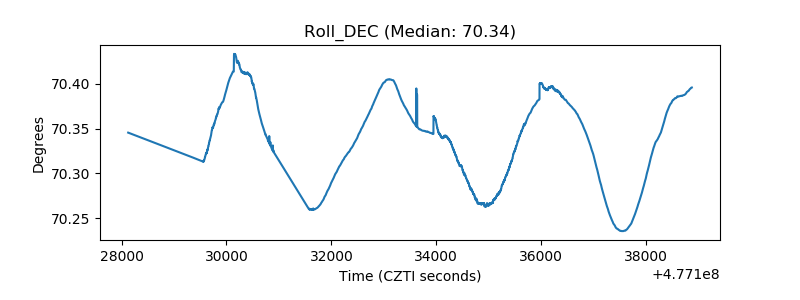 |
| _Roll_RA | 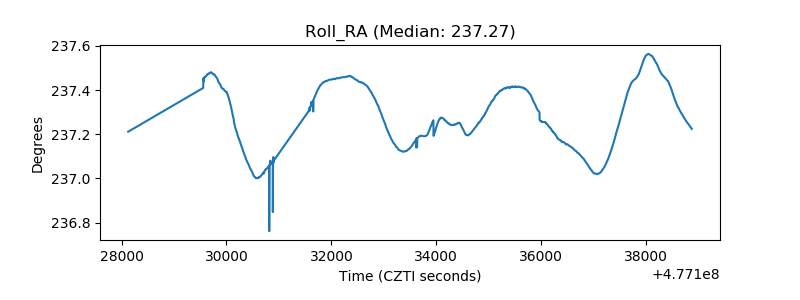 |
| Veto Counter | 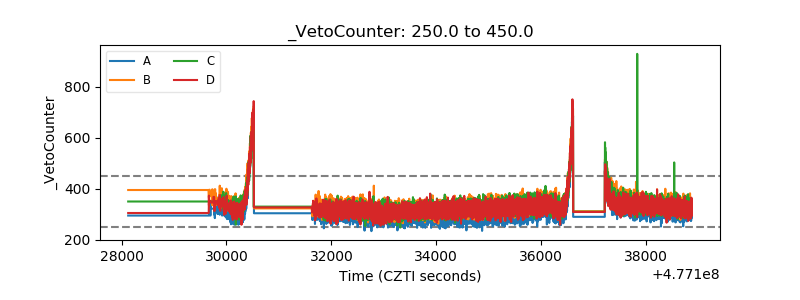 |