| Param | Original file | Final file |
|---|---|---|
| Filename | modeM0/AS1C07_001T01_9000006450_50735cztM0_level2.fits | modeM0/AS1C07_001T01_9000006450_50735cztM0_level2_quad_clean.evt |
| Size (bytes) | 482,529,600 | 89,441,280 |
| Size | 460.2 MB | 85.3 MB |
| Events in quadrant A | 5,345,458 | 578,286 |
| Events in quadrant B | 3,295,873 | 635,802 |
| Events in quadrant C | 4,300,390 | 542,119 |
| Events in quadrant D | 4,430,643 | 511,703 |
| Mode SS | |||
|---|---|---|---|
| Quadrant | BADHDUFLAG | Total packets | Discarded packets |
| A | 0 | 128 | 0 |
| B | 0 | 128 | 0 |
| C | 0 | 128 | 0 |
| D | 0 | 128 | 0 |
| Mode M0 | |||
|---|---|---|---|
| Quadrant | BADHDUFLAG | Total packets | Discarded packets |
| A | 0 | 20514 | 63 |
| B | 0 | 14192 | 43 |
| C | 0 | 17088 | 47 |
| D | 0 | 17558 | 39 |
| Mode M9 | |||
|---|---|---|---|
| Quadrant | BADHDUFLAG | Total packets | Discarded packets |
| A | 0 | 8 | 0 |
| B | 0 | 8 | 0 |
| C | 0 | 8 | 0 |
| D | 0 | 8 | 0 |
| Quadrant | Total seconds | Saturated seconds | Saturation percentage |
|---|---|---|---|
| A | 6304 | 224 | 3.553299% |
| B | 6304 | 120 | 1.903553% |
| C | 6306 | 328 | 5.201395% |
| D | 6305 | 293 | 4.647105% |
Noise dominated data is calculated using 1-second bins in cleaned event files. If a bin has >2000 counts, and if more than 50% of those come from <1% of pixels, then it is considered to be noise-dominated and hence unusable.
| Quadrant | # 1 sec bins | Bins with >0 counts | Bins with >2000 counts | High rate bins dominated by noise | Noise dominated (total time) | Noise dominated (detector-on time) | Marked lightcurve |
|---|---|---|---|---|---|---|---|
| A | 7122 | 6309 | 115 | 115 | 1.61% | 1.82% | 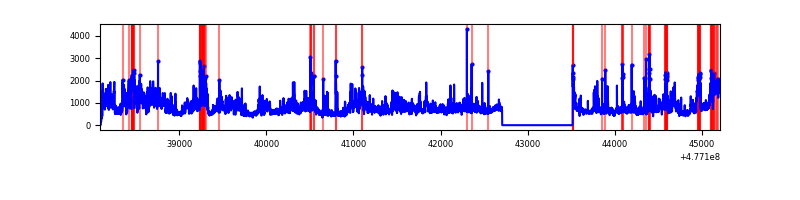 |
| B | 7121 | 6309 | 47 | 47 | 0.66% | 0.74% | 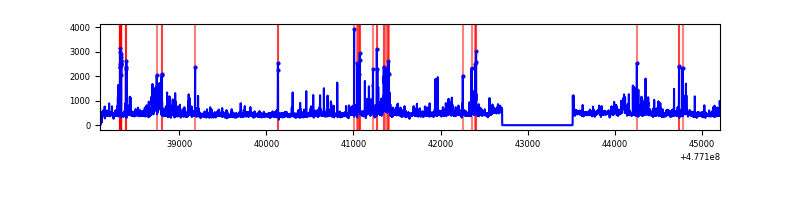 |
| C | 7123 | 6310 | 260 | 260 | 3.65% | 4.12% | 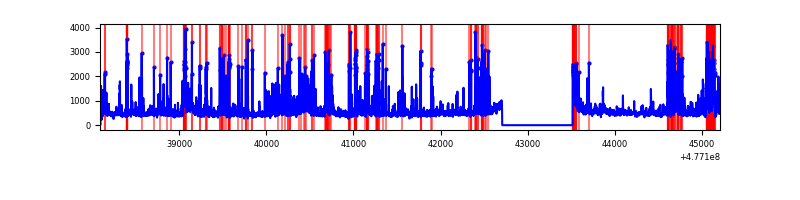 |
| D | 7120 | 6308 | 212 | 212 | 2.98% | 3.36% | 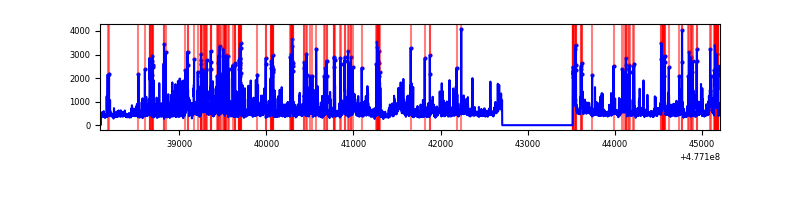 |
Top three noisy pixels from each quadrant. If the there are fewer than three noisy pixels in the level2.evt file, extra rows are filled as -1
| Pixel properties | Quadrant properties | ||||||
|---|---|---|---|---|---|---|---|
| Quadrant | DetID | PixID | Counts | Sigma | Mean | Median | Sigma |
| A | 4 | 4 | 1223033 | 7314.96 | 670 | 653 | 167.1 |
| A | 12 | 80 | 626936 | 3747.8 | 670 | 653 | 167.1 |
| A | 4 | 3 | 167280 | 997.13 | 670 | 653 | 167.1 |
| B | 8 | 128 | 120700 | 840.72 | 665 | 643 | 142.8 |
| B | 0 | 213 | 66545 | 461.49 | 665 | 643 | 142.8 |
| B | 5 | 172 | 55490 | 384.08 | 665 | 643 | 142.8 |
| C | 5 | 10 | 859464 | 4865.82 | 641 | 636 | 176.5 |
| C | 13 | 3 | 175912 | 993.05 | 641 | 636 | 176.5 |
| C | 15 | 179 | 113130 | 637.35 | 641 | 636 | 176.5 |
| D | 2 | 249 | 408179 | 2300.73 | 640 | 619 | 177.1 |
| D | 1 | 47 | 316221 | 1781.62 | 640 | 619 | 177.1 |
| D | 15 | 169 | 278922 | 1571.06 | 640 | 619 | 177.1 |
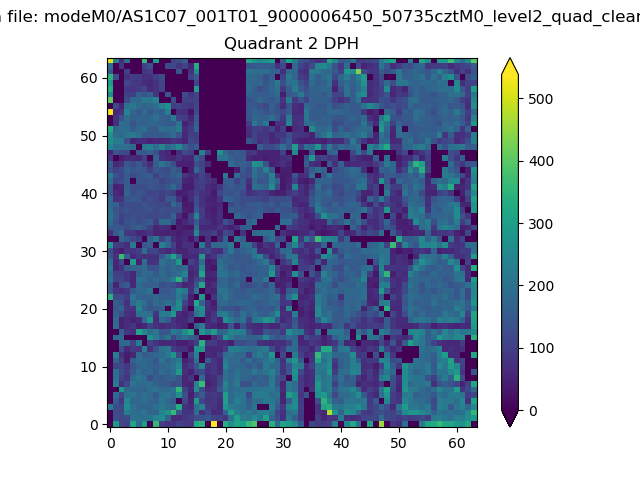
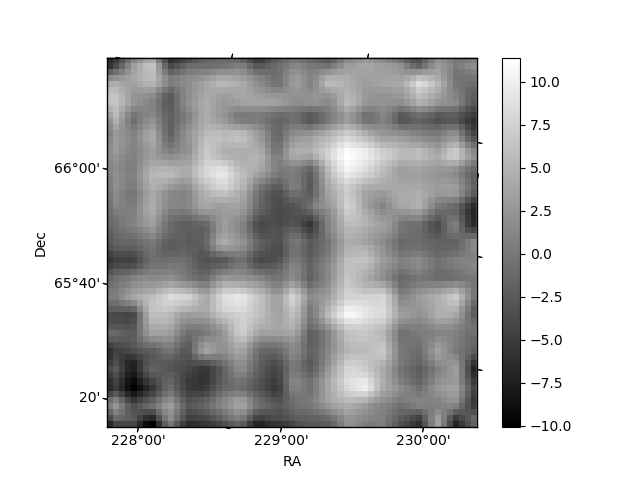
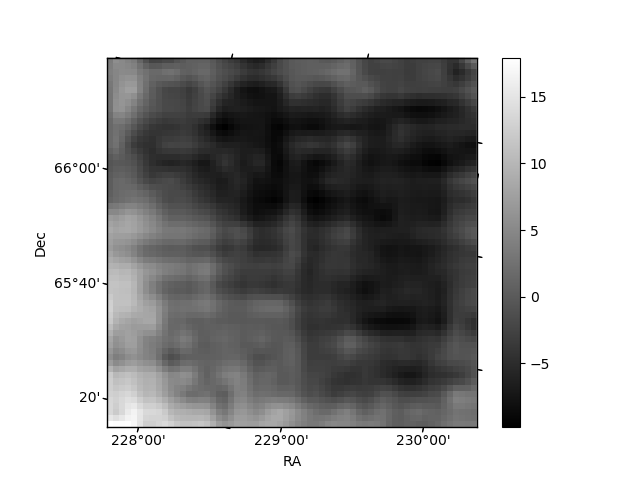
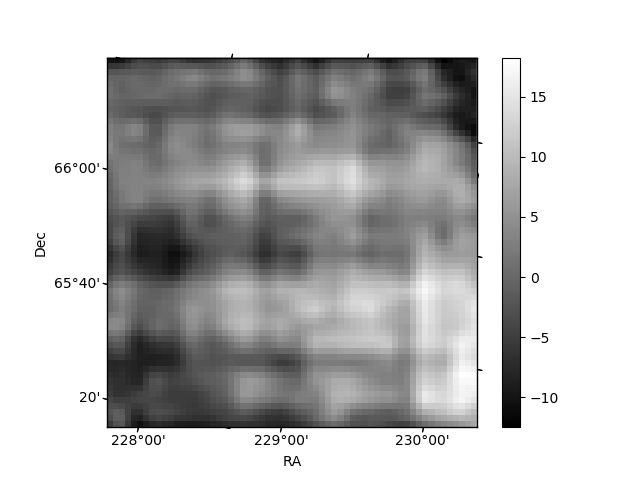
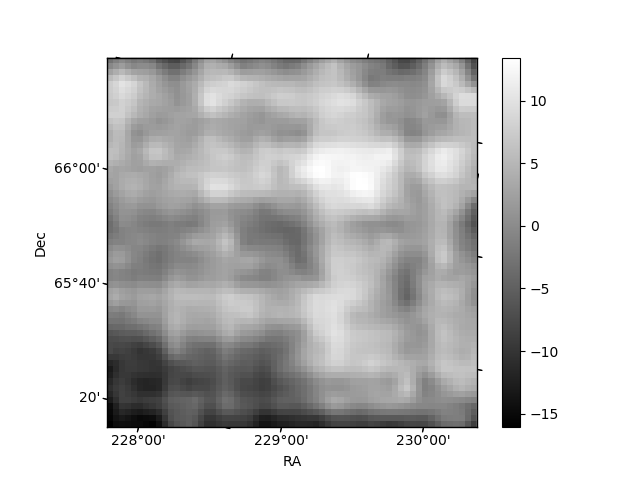
Histogram calculated using DETX and DETY for each event in the final _common_clean file
| Quadrant A | 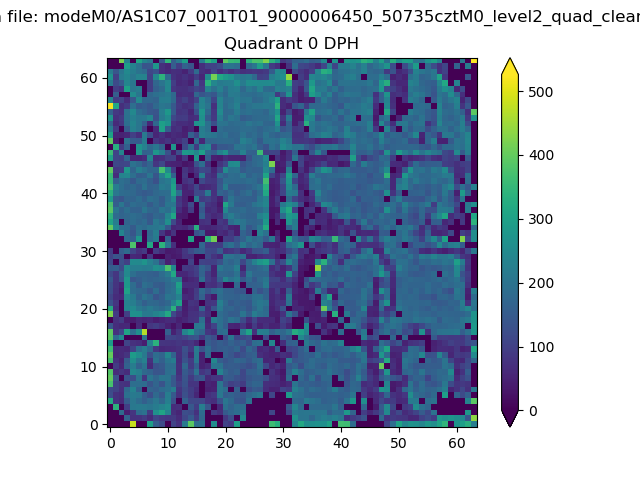 |
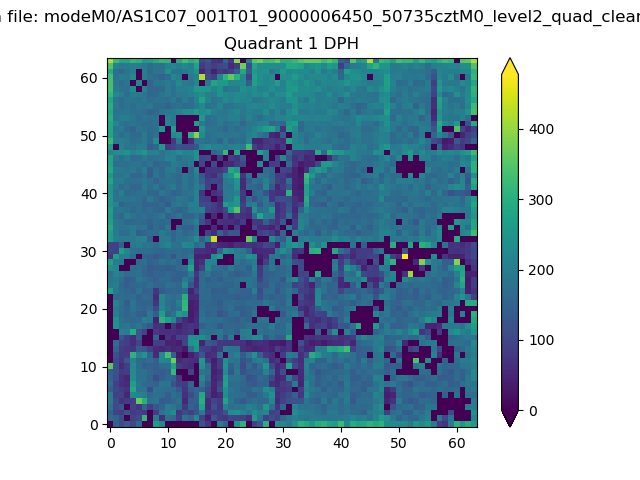 |
Quadrant B |
|---|---|---|---|
| Quadrant D | 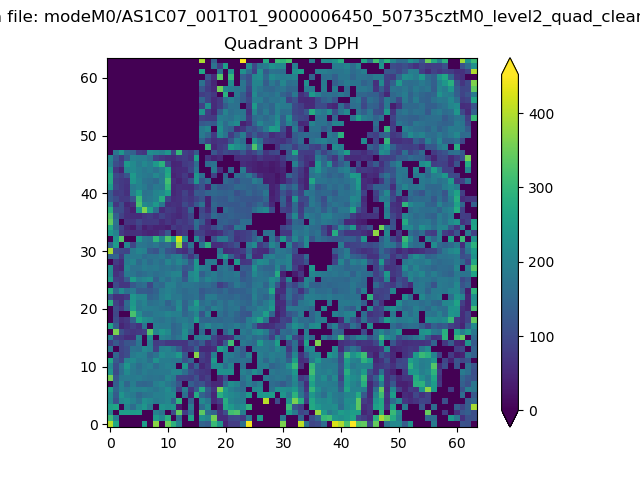 |
 |
Quadrant C |
| Plot type | Count rate plots | Images |
|---|---|---|
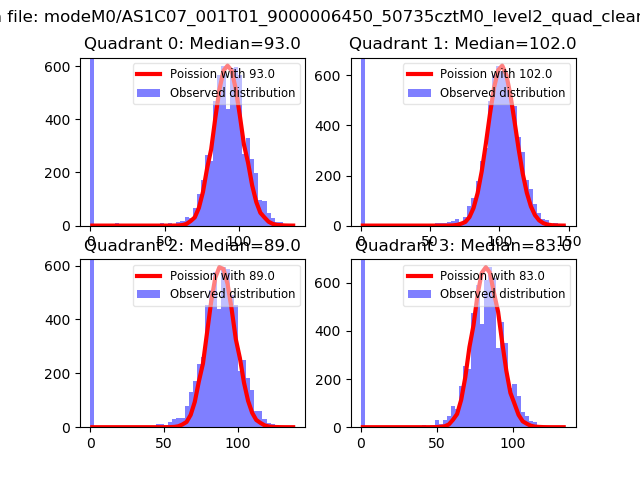
| Comparison with Poisson distribution Blue bars denote a histogram of data divided into 1 sec bins. Red curve is a Poisson curve with rate = median count rate of data. |
 |
 |
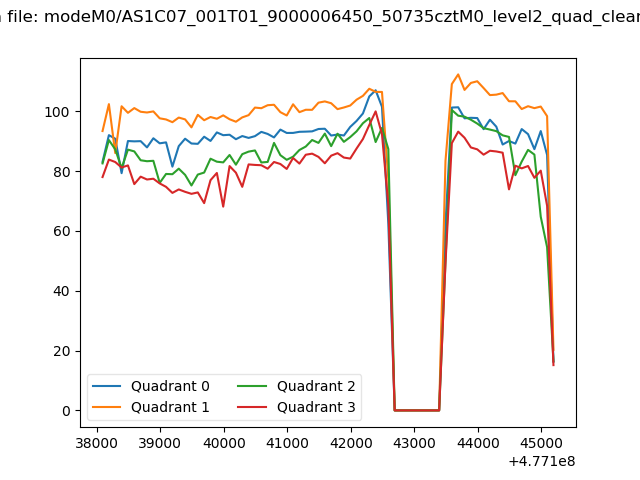
| Quadrant-wise count rates Data is divided into 100 sec bins |
 |
|
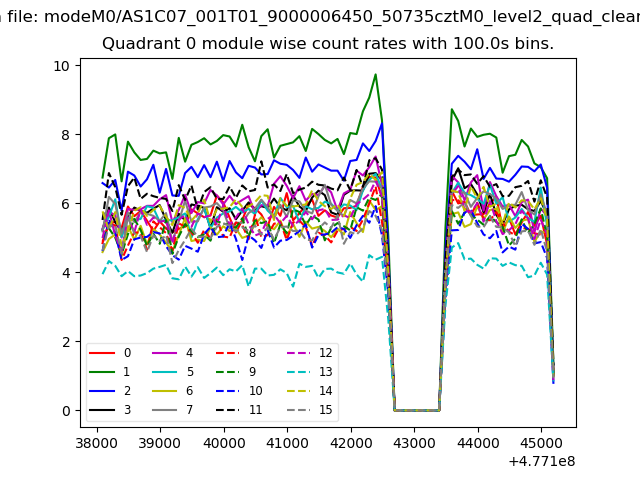
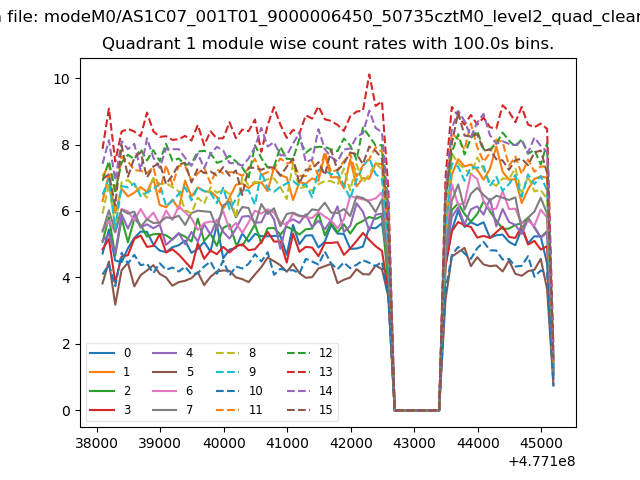
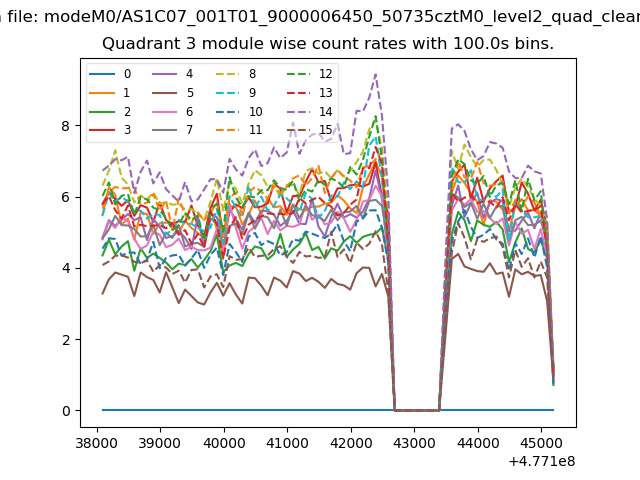
| Module-wise count rates for Quadrant A Data is divided into 100 sec bins |
 |
 |
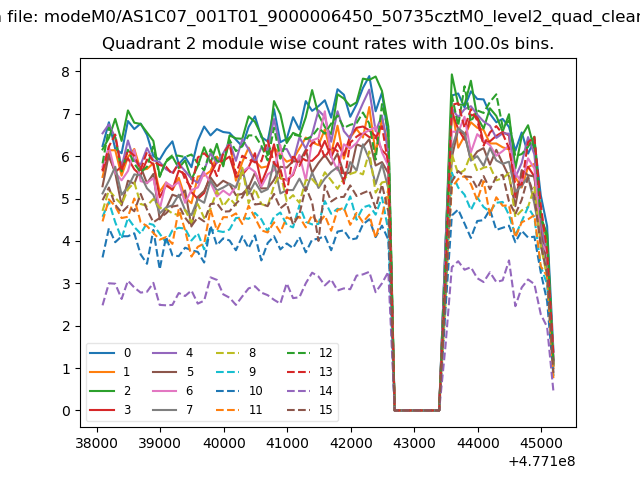
| Module-wise count rates for Quadrant B Data is divided into 100 sec bins |
 |
 |
| Module-wise count rates for Quadrant C Data is divided into 100 sec bins |
 |
 |
| Module-wise count rates for Quadrant D Data is divided into 100 sec bins |
 |
 |
| Parameter | Plot |
|---|---|
| CZT HV Monitor | 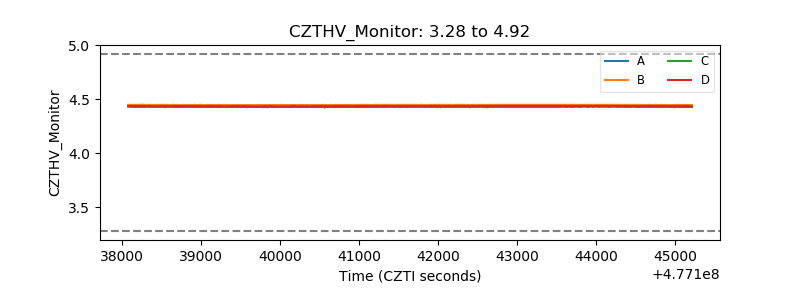 |
| D_VDD | 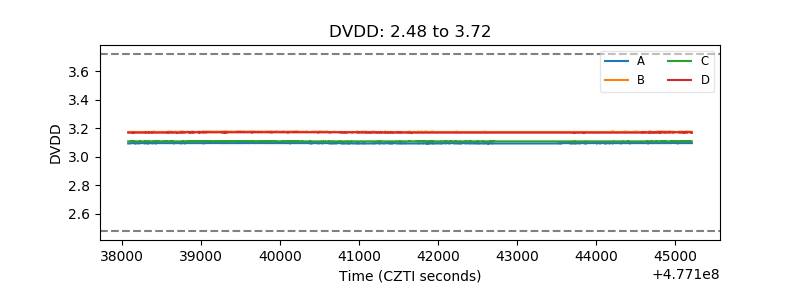 |
| Temperature 1 |  |
| Veto HV Monitor | 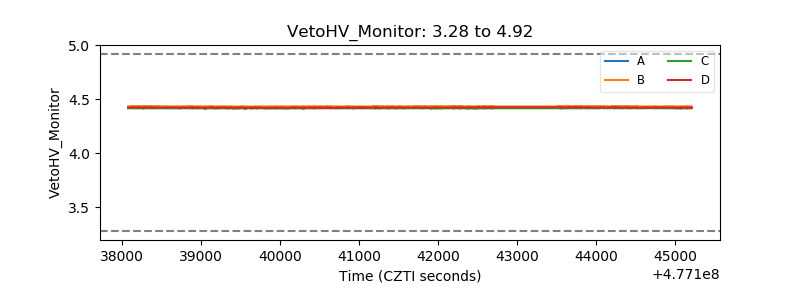 |
| Veto LLD | 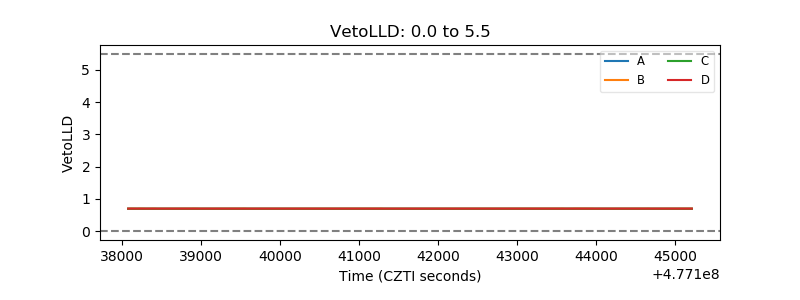 |
| Alpha Counter | 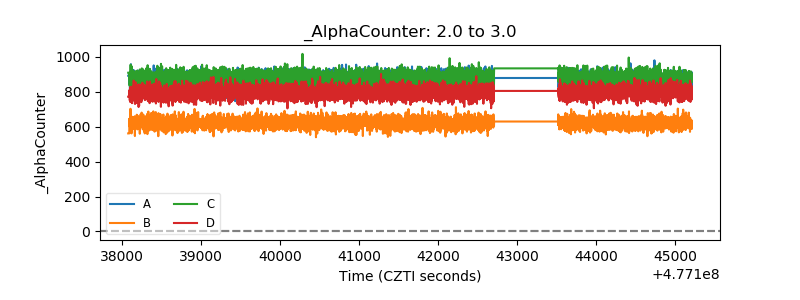 |
| _CPM_Rate | 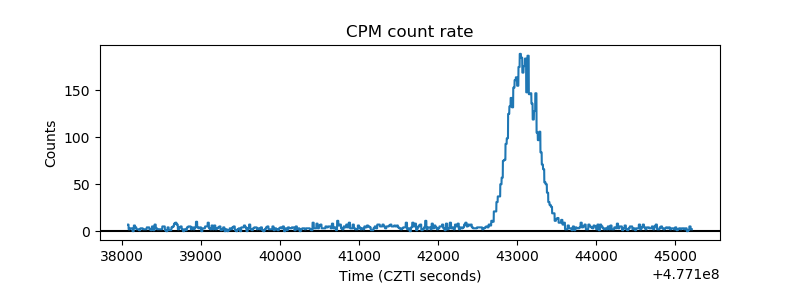 |
| CZT Counter | 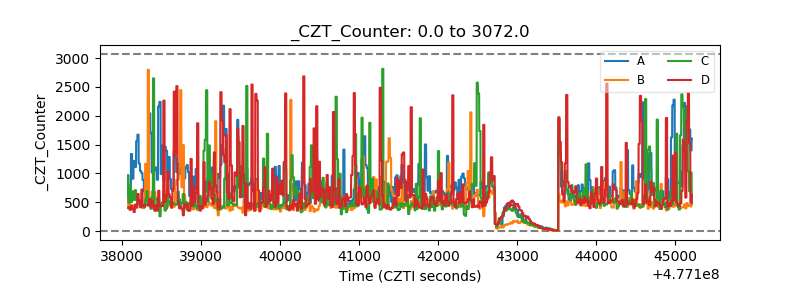 |
| +2.5 Volts monitor | 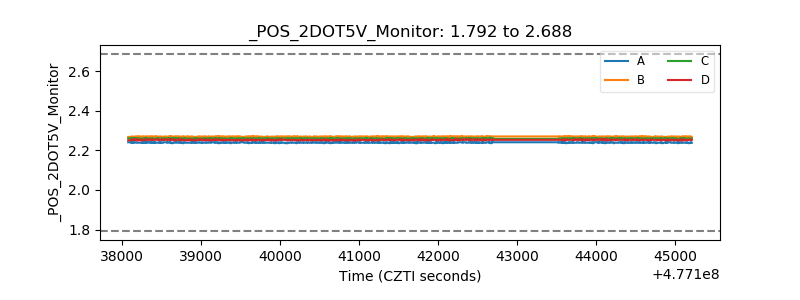 |
| +5 Volts monitor | 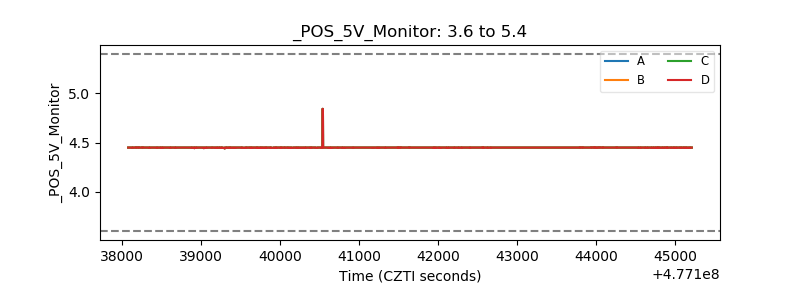 |
| _ROLL_ROT | 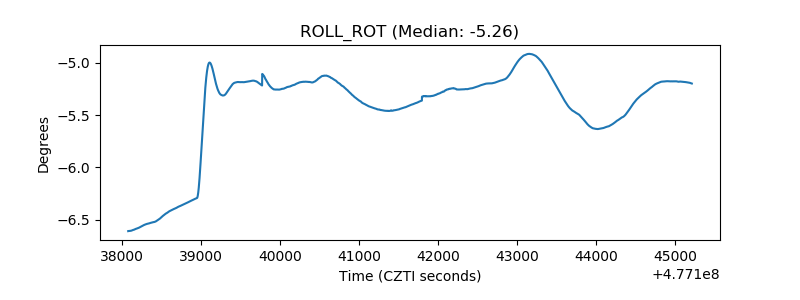 |
| _Roll_DEC | 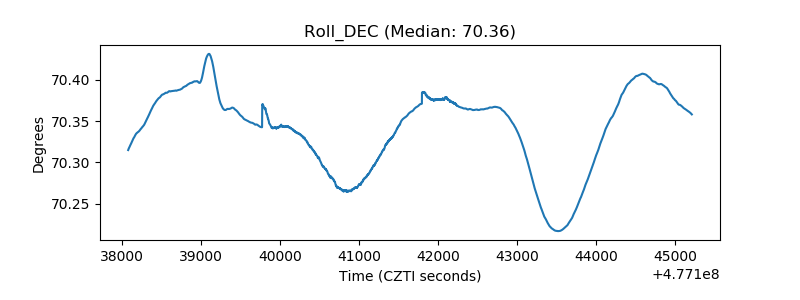 |
| _Roll_RA | 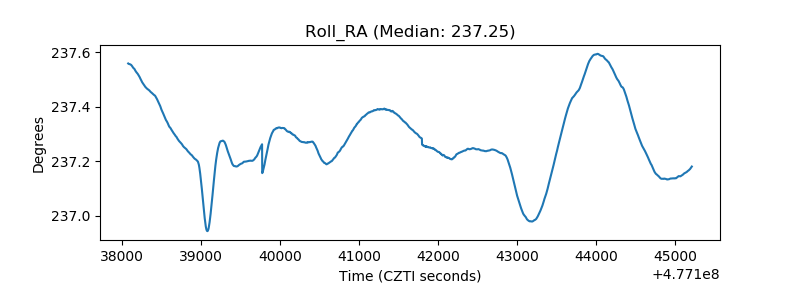 |
| Veto Counter | 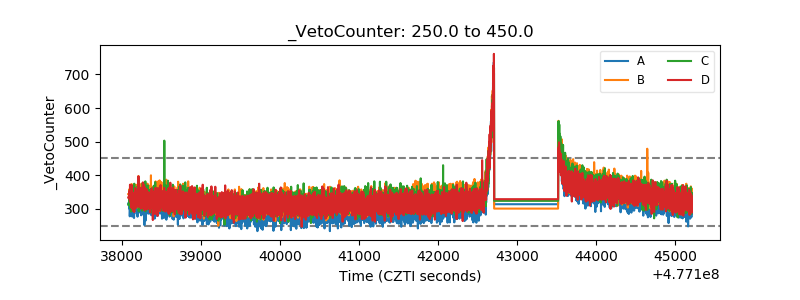 |