| Param | Original file | Final file |
|---|---|---|
| Filename | modeM0/AS1C07_001T01_9000006450_50737cztM0_level2.fits | modeM0/AS1C07_001T01_9000006450_50737cztM0_level2_quad_clean.evt |
| Size (bytes) | 493,657,920 | 89,196,480 |
| Size | 470.8 MB | 85.1 MB |
| Events in quadrant A | 5,227,540 | 577,384 |
| Events in quadrant B | 3,224,673 | 638,351 |
| Events in quadrant C | 5,088,256 | 533,115 |
| Events in quadrant D | 4,252,775 | 520,123 |
| Mode SS | |||
|---|---|---|---|
| Quadrant | BADHDUFLAG | Total packets | Discarded packets |
| A | 0 | 126 | 0 |
| B | 0 | 126 | 0 |
| C | 0 | 126 | 2 |
| D | 0 | 126 | 0 |
| Mode M0 | |||
|---|---|---|---|
| Quadrant | BADHDUFLAG | Total packets | Discarded packets |
| A | 0 | 20105 | 139 |
| B | 0 | 13968 | 102 |
| C | 0 | 19367 | 77 |
| D | 0 | 17073 | 109 |
| Mode M9 | |||
|---|---|---|---|
| Quadrant | BADHDUFLAG | Total packets | Discarded packets |
| A | 0 | 10 | 0 |
| B | 0 | 10 | 0 |
| C | 0 | 10 | 0 |
| D | 0 | 10 | 0 |
| Quadrant | Total seconds | Saturated seconds | Saturation percentage |
|---|---|---|---|
| A | 6184 | 324 | 5.239327% |
| B | 6189 | 130 | 2.100501% |
| C | 6190 | 569 | 9.192246% |
| D | 6190 | 288 | 4.652666% |
Noise dominated data is calculated using 1-second bins in cleaned event files. If a bin has >2000 counts, and if more than 50% of those come from <1% of pixels, then it is considered to be noise-dominated and hence unusable.
| Quadrant | # 1 sec bins | Bins with >0 counts | Bins with >2000 counts | High rate bins dominated by noise | Noise dominated (total time) | Noise dominated (detector-on time) | Marked lightcurve |
|---|---|---|---|---|---|---|---|
| A | 7143 | 6193 | 210 | 210 | 2.94% | 3.39% | 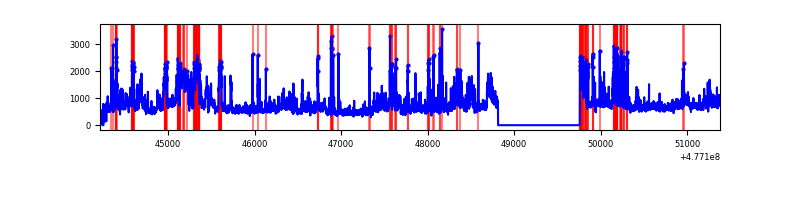 |
| B | 7150 | 6195 | 54 | 54 | 0.76% | 0.87% | 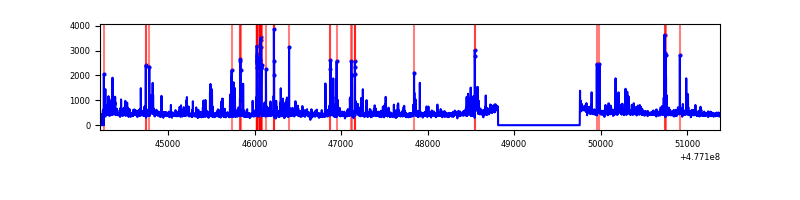 |
| C | 7167 | 6200 | 471 | 471 | 6.57% | 7.60% | 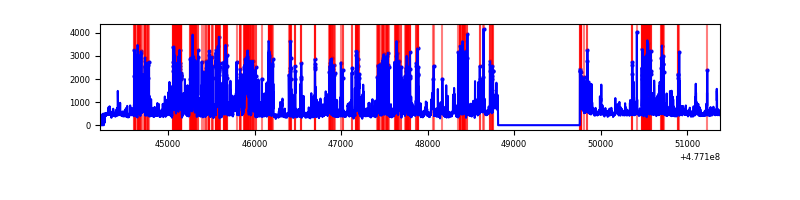 |
| D | 7158 | 6200 | 236 | 236 | 3.30% | 3.81% | 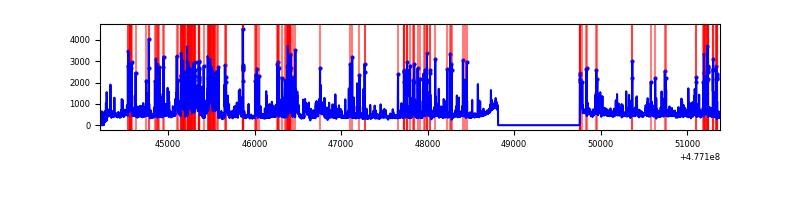 |
Top three noisy pixels from each quadrant. If the there are fewer than three noisy pixels in the level2.evt file, extra rows are filled as -1
| Pixel properties | Quadrant properties | ||||||
|---|---|---|---|---|---|---|---|
| Quadrant | DetID | PixID | Counts | Sigma | Mean | Median | Sigma |
| A | 4 | 4 | 773869 | 4715.45 | 659 | 644 | 164.0 |
| A | 12 | 80 | 704468 | 4292.22 | 659 | 644 | 164.0 |
| A | 3 | 114 | 193811 | 1178.01 | 659 | 644 | 164.0 |
| B | 0 | 200 | 104334 | 740.11 | 659 | 636 | 140.1 |
| B | 10 | 247 | 80811 | 572.22 | 659 | 636 | 140.1 |
| B | 8 | 128 | 69692 | 492.86 | 659 | 636 | 140.1 |
| C | 5 | 10 | 1614941 | 9511.18 | 624 | 619 | 169.7 |
| C | 0 | 177 | 204567 | 1201.61 | 624 | 619 | 169.7 |
| C | 1 | 3 | 126137 | 739.52 | 624 | 619 | 169.7 |
| D | 2 | 249 | 380575 | 2143.98 | 639 | 617 | 177.2 |
| D | 15 | 169 | 316312 | 1781.37 | 639 | 617 | 177.2 |
| D | 1 | 47 | 312889 | 1762.05 | 639 | 617 | 177.2 |
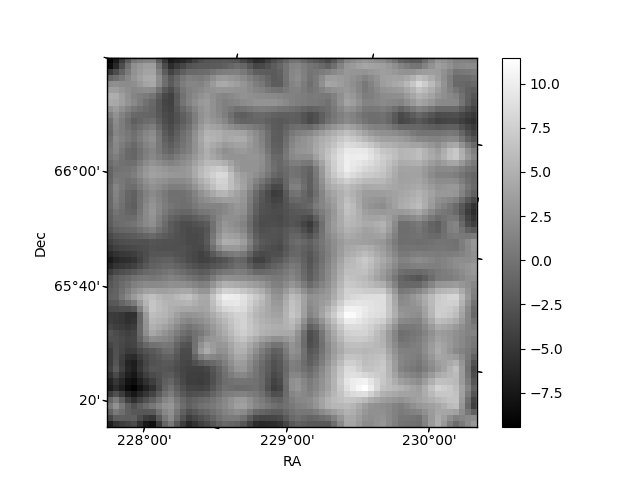
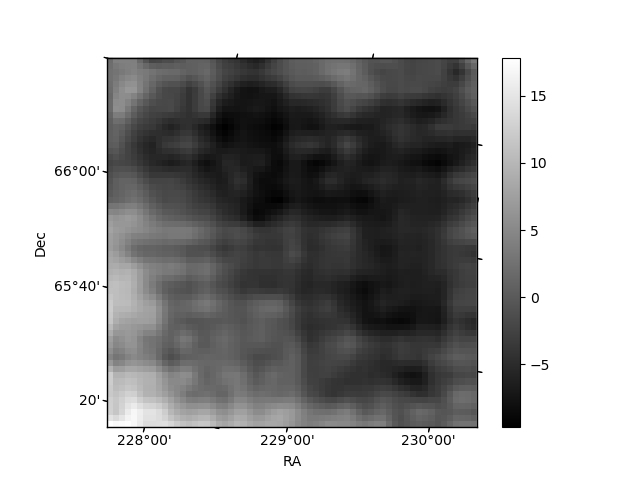
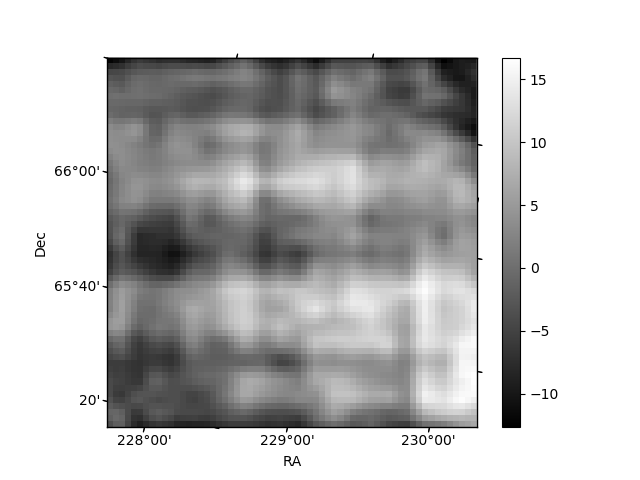
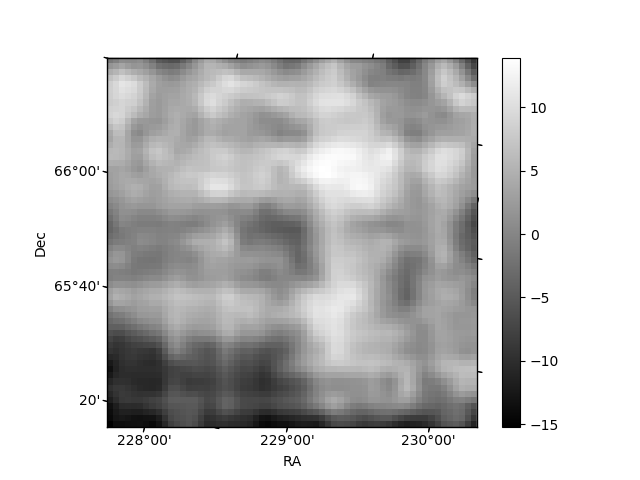
Histogram calculated using DETX and DETY for each event in the final _common_clean file
| Quadrant A | 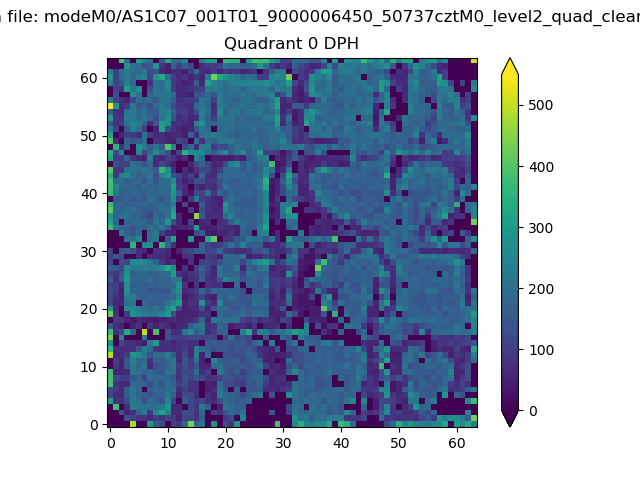 |
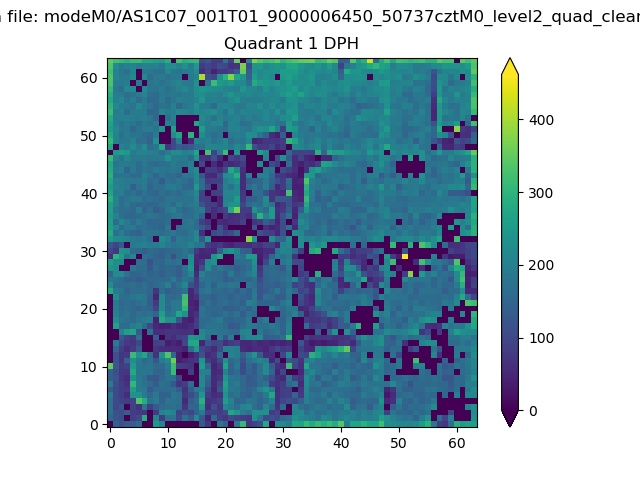 |
Quadrant B |
|---|---|---|---|
| Quadrant D | 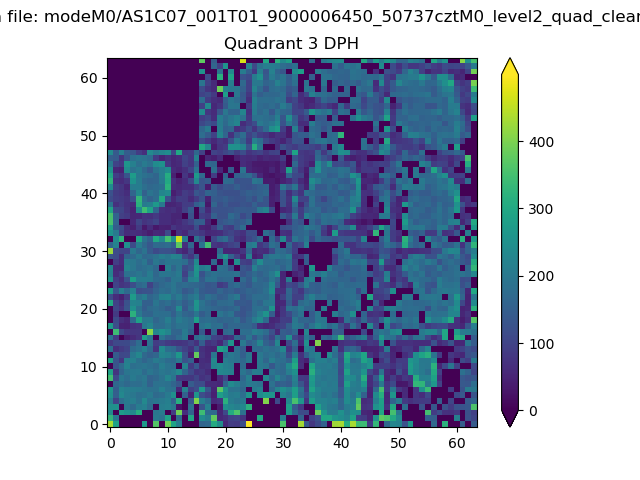 |
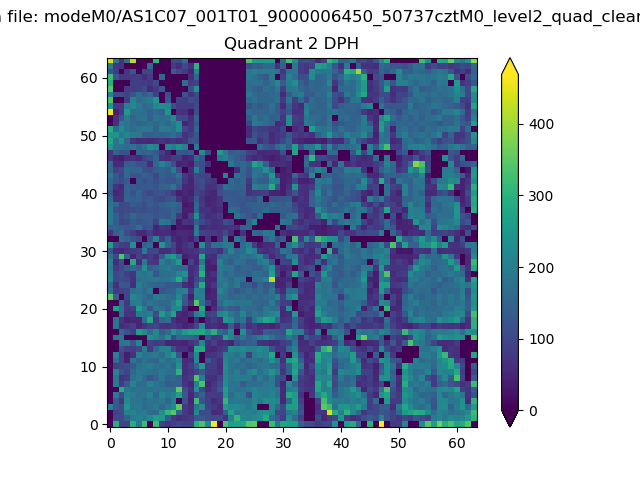 |
Quadrant C |
| Plot type | Count rate plots | Images |
|---|---|---|
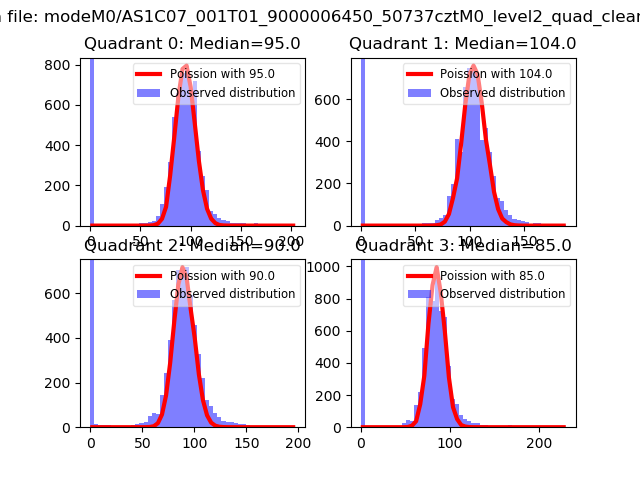
| Comparison with Poisson distribution Blue bars denote a histogram of data divided into 1 sec bins. Red curve is a Poisson curve with rate = median count rate of data. |
 |
 |
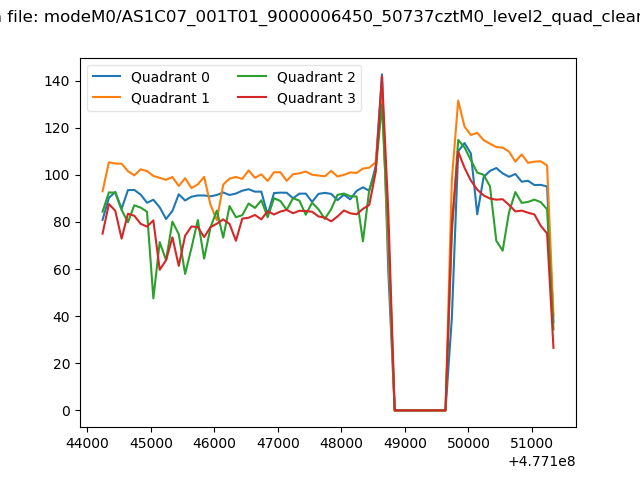
| Quadrant-wise count rates Data is divided into 100 sec bins |
 |
|
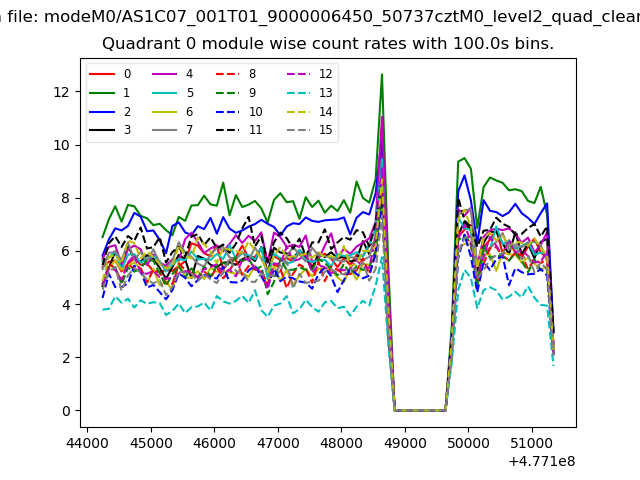
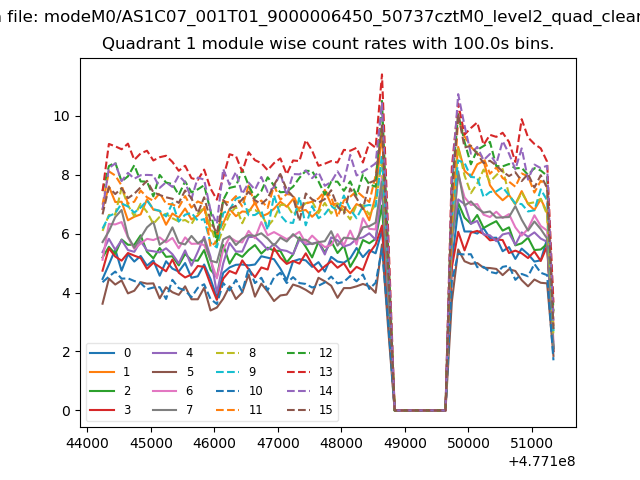
| Module-wise count rates for Quadrant A Data is divided into 100 sec bins |
 |
 |
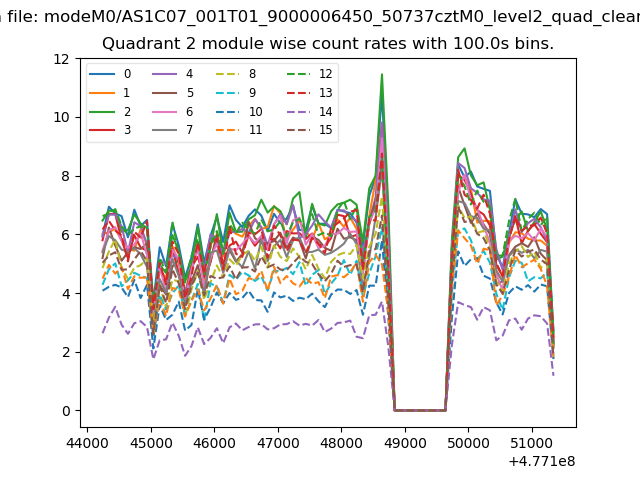
| Module-wise count rates for Quadrant B Data is divided into 100 sec bins |
 |
 |
| Module-wise count rates for Quadrant C Data is divided into 100 sec bins |
 |
 |
| Module-wise count rates for Quadrant D Data is divided into 100 sec bins |
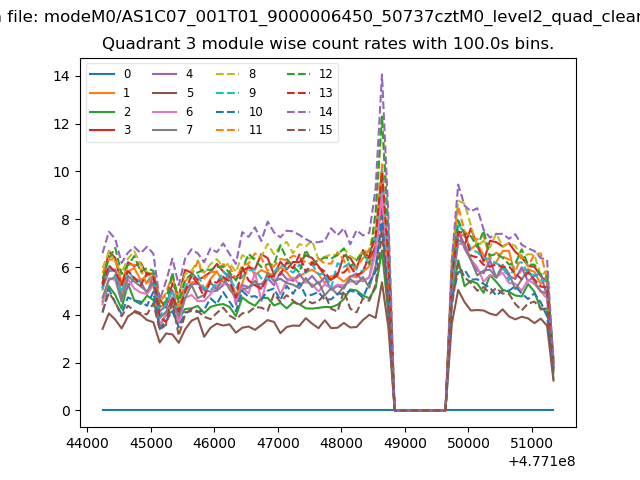 |
 |
| Parameter | Plot |
|---|---|
| CZT HV Monitor | 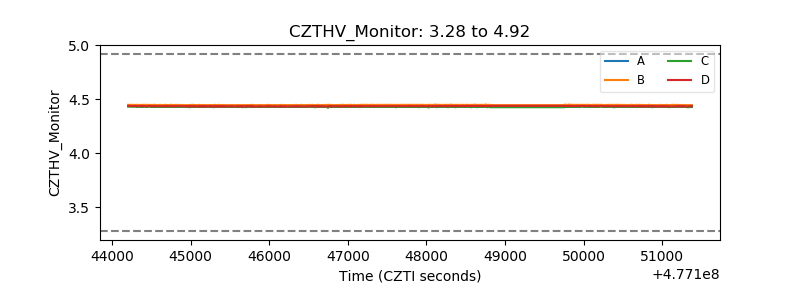 |
| D_VDD | 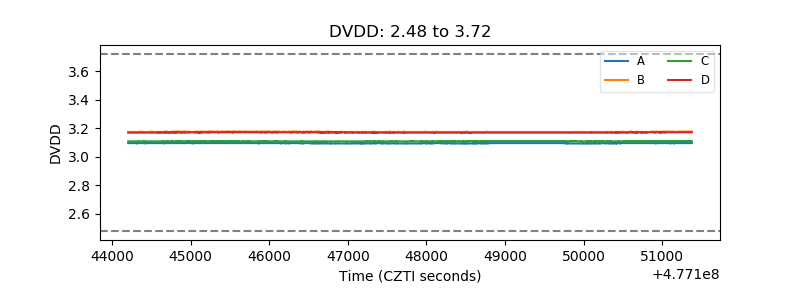 |
| Temperature 1 | 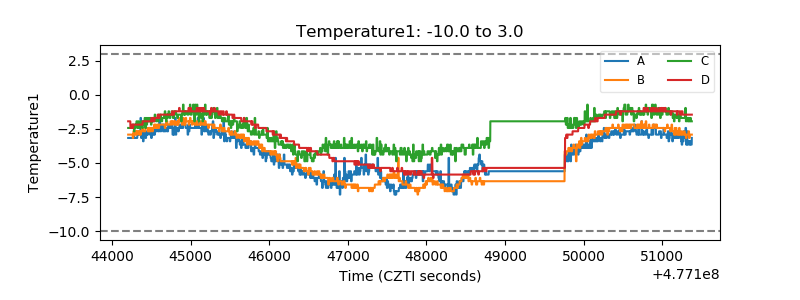 |
| Veto HV Monitor |  |
| Veto LLD | 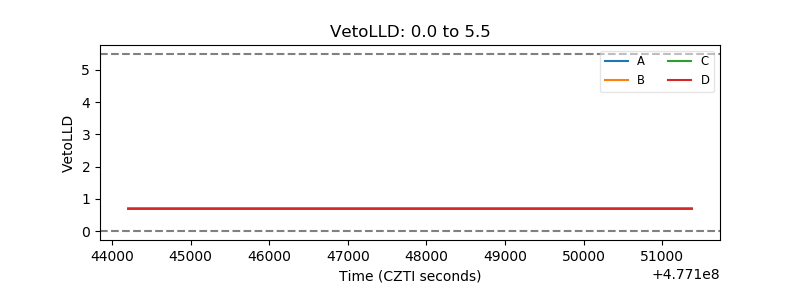 |
| Alpha Counter | 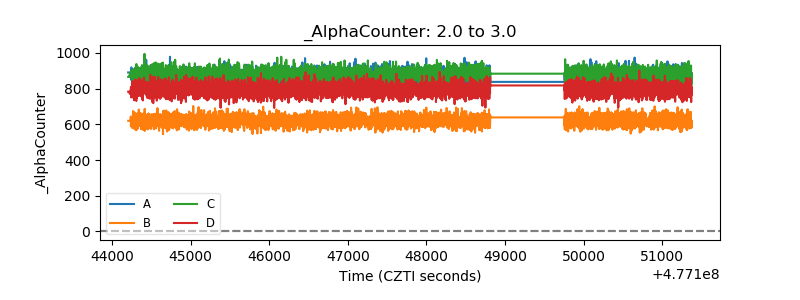 |
| _CPM_Rate | 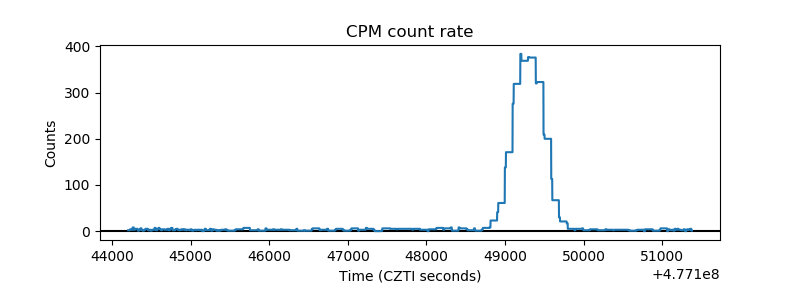 |
| CZT Counter | 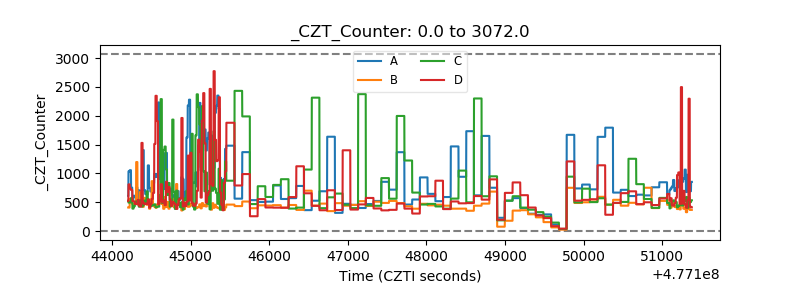 |
| +2.5 Volts monitor | 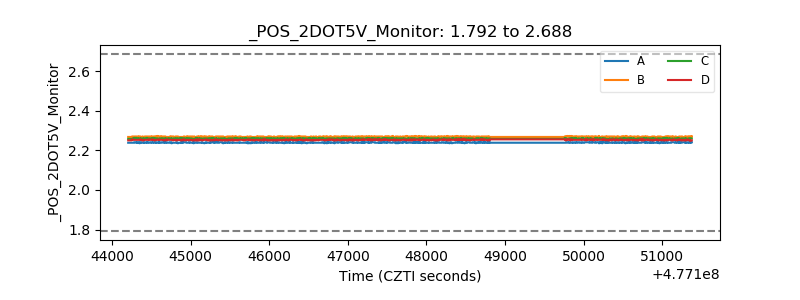 |
| +5 Volts monitor | 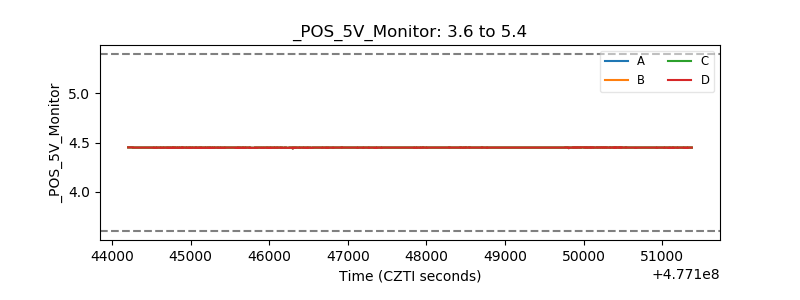 |
| _ROLL_ROT | 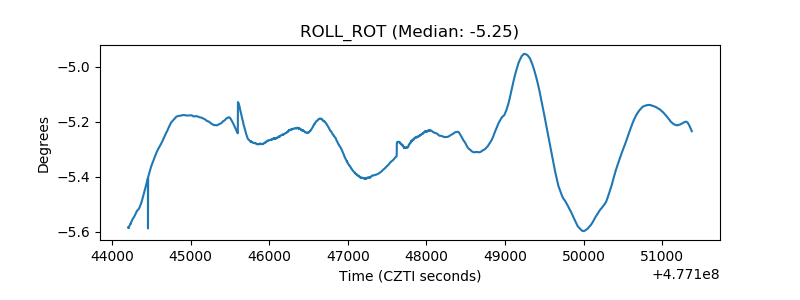 |
| _Roll_DEC | 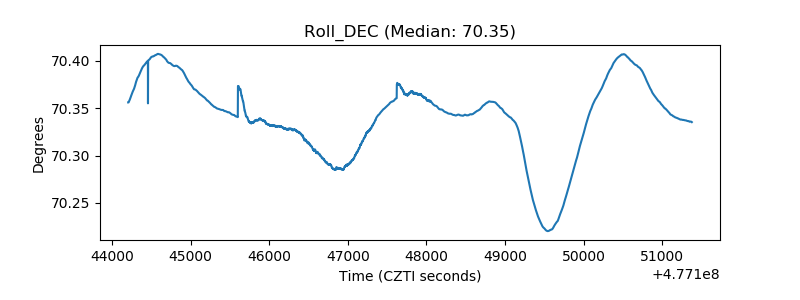 |
| _Roll_RA | 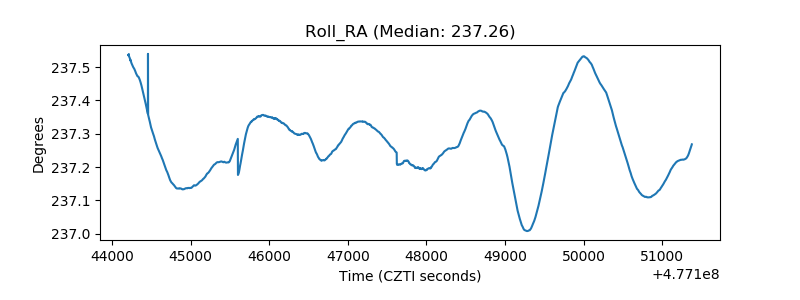 |
| Veto Counter | 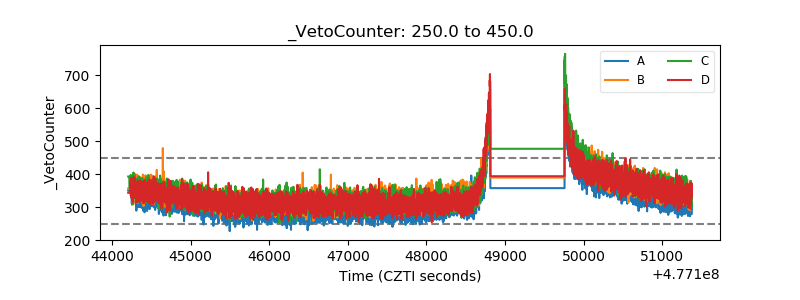 |