| Param | Original file | Final file |
|---|---|---|
| Filename | modeM0/AS1C07_001T01_9000006450_50738cztM0_level2.fits | modeM0/AS1C07_001T01_9000006450_50738cztM0_level2_quad_clean.evt |
| Size (bytes) | 553,530,240 | 86,281,920 |
| Size | 527.9 MB | 82.3 MB |
| Events in quadrant A | 7,452,979 | 515,606 |
| Events in quadrant B | 3,278,218 | 640,495 |
| Events in quadrant C | 4,902,001 | 528,649 |
| Events in quadrant D | 4,381,884 | 500,045 |
| Mode SS | |||
|---|---|---|---|
| Quadrant | BADHDUFLAG | Total packets | Discarded packets |
| A | 0 | 126 | 0 |
| B | 0 | 126 | 0 |
| C | 0 | 126 | 0 |
| D | 0 | 126 | 0 |
| Mode M0 | |||
|---|---|---|---|
| Quadrant | BADHDUFLAG | Total packets | Discarded packets |
| A | 0 | 26726 | 91 |
| B | 0 | 14013 | 59 |
| C | 0 | 18689 | 55 |
| D | 0 | 17248 | 45 |
| Mode M9 | |||
|---|---|---|---|
| Quadrant | BADHDUFLAG | Total packets | Discarded packets |
| A | 0 | 10 | 0 |
| B | 0 | 10 | 0 |
| C | 0 | 10 | 0 |
| D | 0 | 10 | 0 |
| Quadrant | Total seconds | Saturated seconds | Saturation percentage |
|---|---|---|---|
| A | 6118 | 1037 | 16.949984% |
| B | 6121 | 142 | 2.319882% |
| C | 6119 | 540 | 8.824971% |
| D | 6123 | 404 | 6.598073% |
Noise dominated data is calculated using 1-second bins in cleaned event files. If a bin has >2000 counts, and if more than 50% of those come from <1% of pixels, then it is considered to be noise-dominated and hence unusable.
| Quadrant | # 1 sec bins | Bins with >0 counts | Bins with >2000 counts | High rate bins dominated by noise | Noise dominated (total time) | Noise dominated (detector-on time) | Marked lightcurve |
|---|---|---|---|---|---|---|---|
| A | 7193 | 6122 | 852 | 852 | 11.84% | 13.92% | 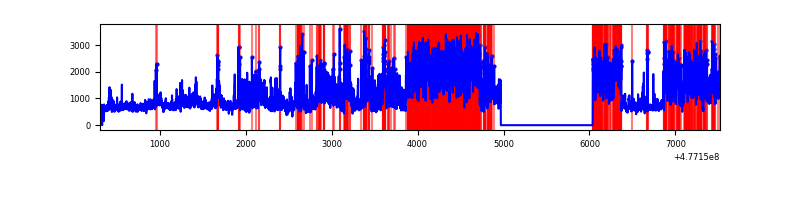 |
| B | 7202 | 6125 | 44 | 44 | 0.61% | 0.72% | 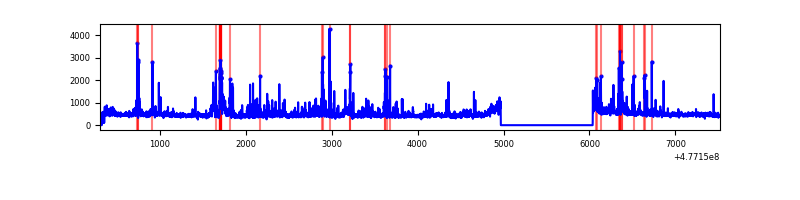 |
| C | 7197 | 6124 | 421 | 421 | 5.85% | 6.87% | 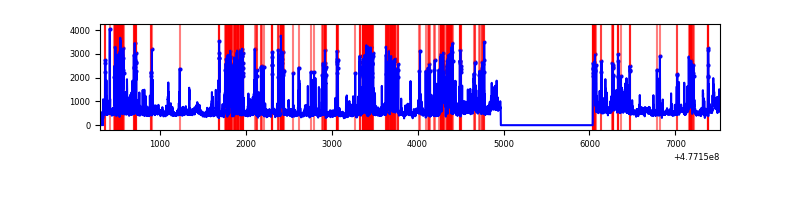 |
| D | 7214 | 6129 | 315 | 315 | 4.37% | 5.14% | 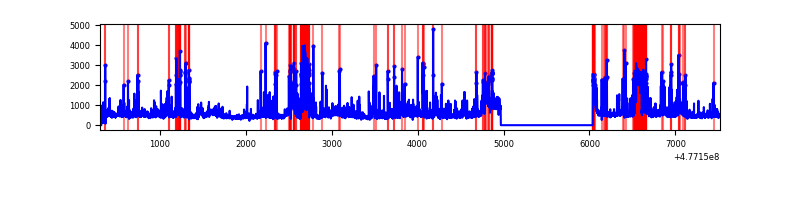 |
Top three noisy pixels from each quadrant. If the there are fewer than three noisy pixels in the level2.evt file, extra rows are filled as -1
| Pixel properties | Quadrant properties | ||||||
|---|---|---|---|---|---|---|---|
| Quadrant | DetID | PixID | Counts | Sigma | Mean | Median | Sigma |
| A | 4 | 4 | 3928408 | 24889.55 | 631 | 614 | 157.8 |
| A | 6 | 195 | 285985 | 1808.33 | 631 | 614 | 157.8 |
| A | 10 | 253 | 135935 | 857.5 | 631 | 614 | 157.8 |
| B | 5 | 185 | 139824 | 992.7 | 658 | 634 | 140.2 |
| B | 10 | 246 | 122762 | 871.01 | 658 | 634 | 140.2 |
| B | 10 | 247 | 60107 | 424.16 | 658 | 634 | 140.2 |
| C | 5 | 10 | 1324294 | 7740.59 | 627 | 620 | 171.0 |
| C | 1 | 3 | 228664 | 1333.55 | 627 | 620 | 171.0 |
| C | 12 | 247 | 211566 | 1233.57 | 627 | 620 | 171.0 |
| D | 1 | 47 | 428468 | 2414.42 | 628 | 604 | 177.2 |
| D | 2 | 249 | 270477 | 1522.88 | 628 | 604 | 177.2 |
| D | 15 | 174 | 256206 | 1442.35 | 628 | 604 | 177.2 |
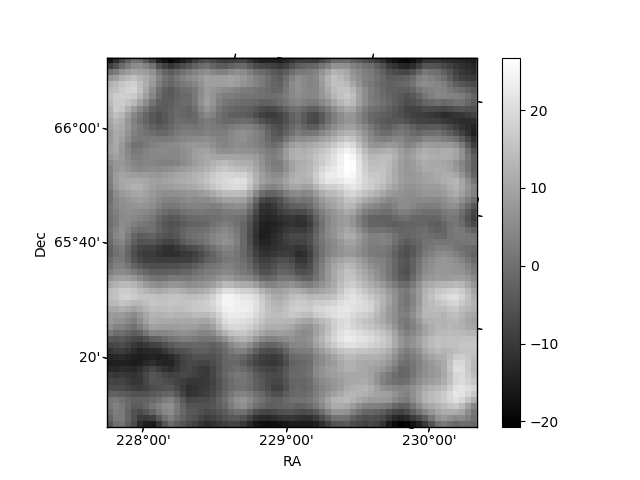
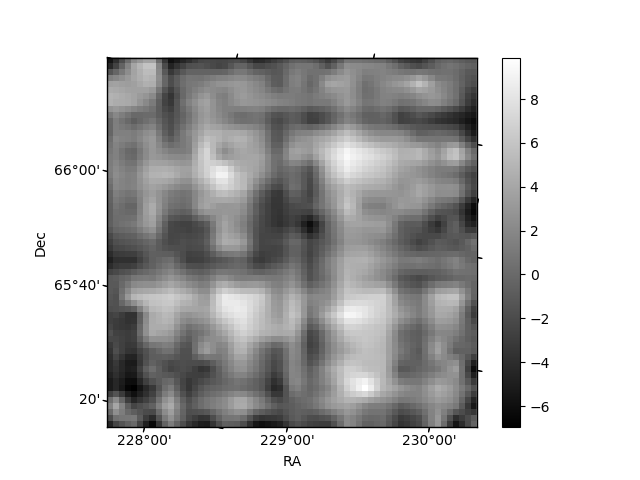
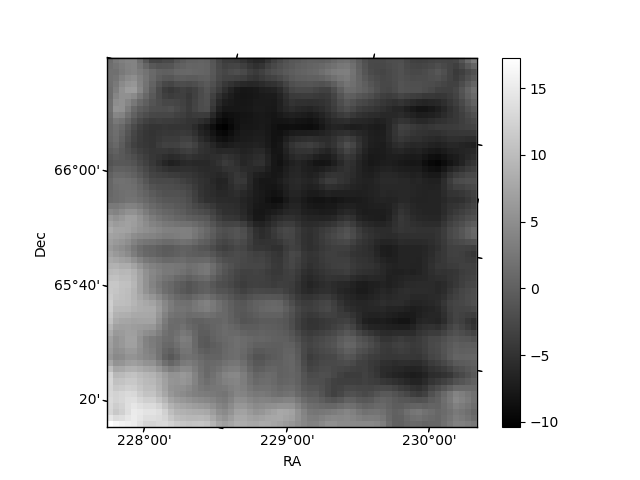
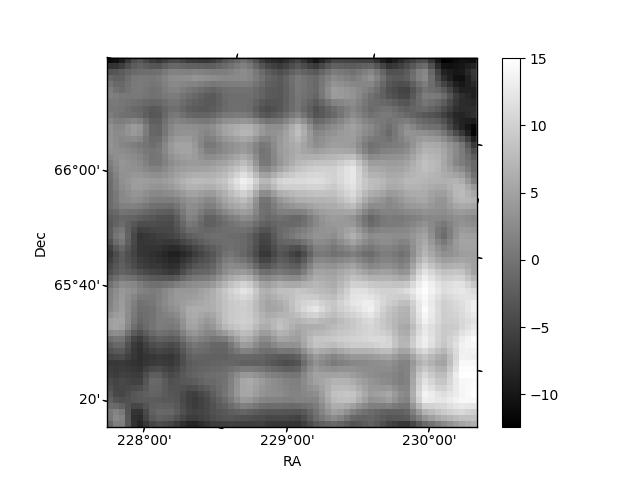
Histogram calculated using DETX and DETY for each event in the final _common_clean file
| Quadrant A | 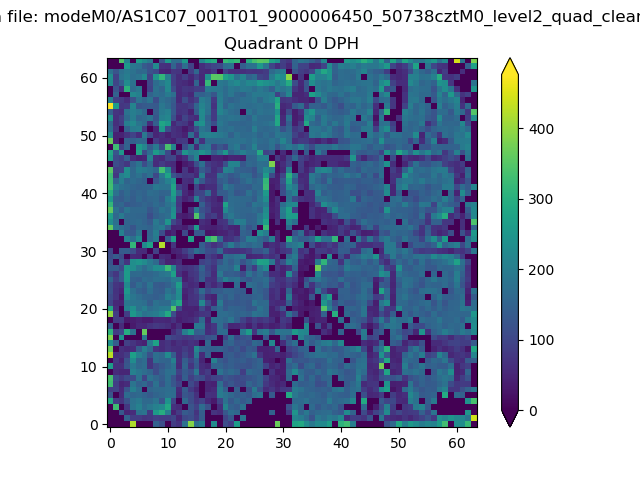 |
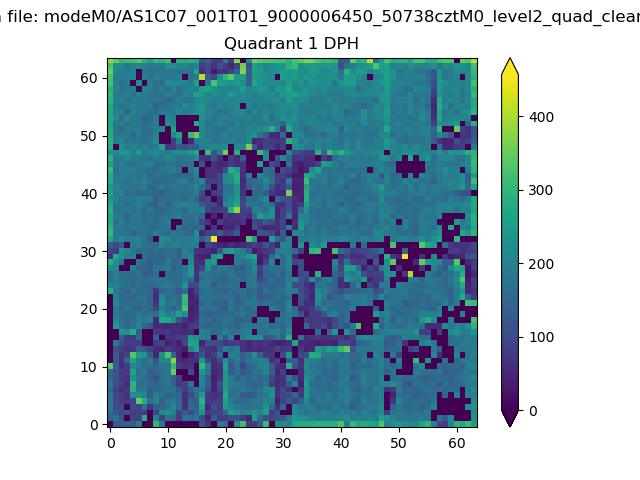 |
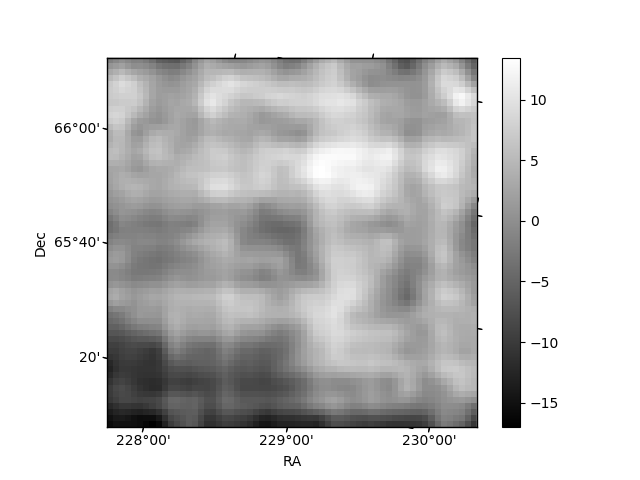
Quadrant B |
|---|---|---|---|
| Quadrant D | 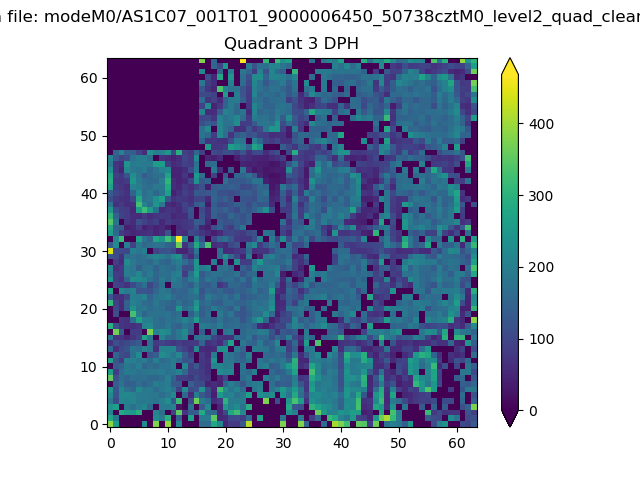 |
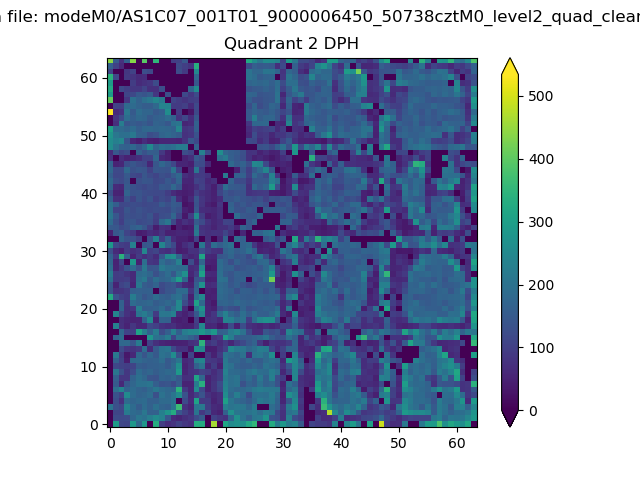 |
Quadrant C |
| Plot type | Count rate plots | Images |
|---|---|---|
| Comparison with Poisson distribution Blue bars denote a histogram of data divided into 1 sec bins. Red curve is a Poisson curve with rate = median count rate of data. |
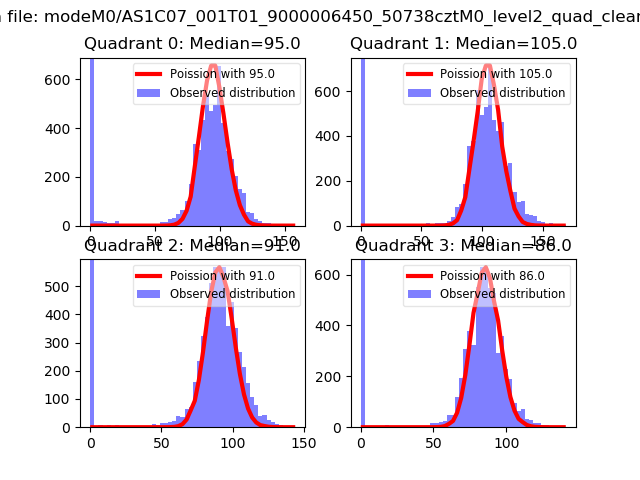 |
 |
| Quadrant-wise count rates Data is divided into 100 sec bins |
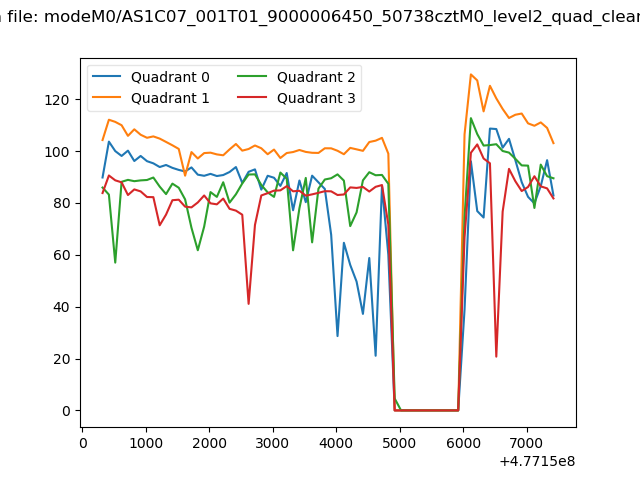 |
|
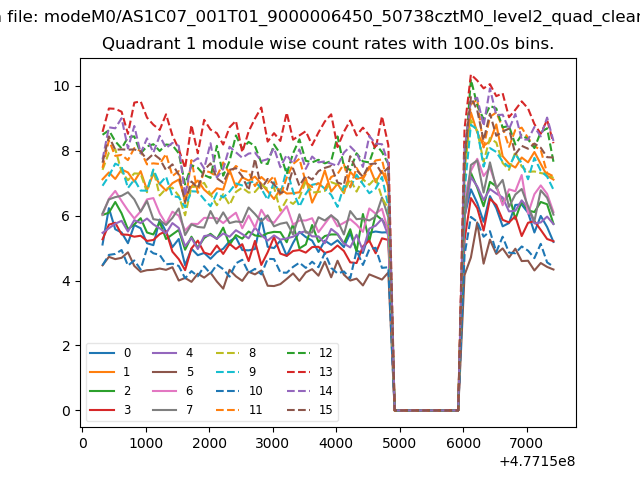
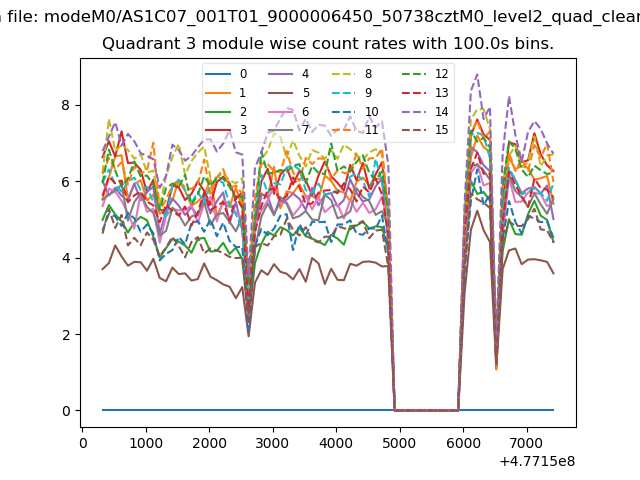
| Module-wise count rates for Quadrant A Data is divided into 100 sec bins |
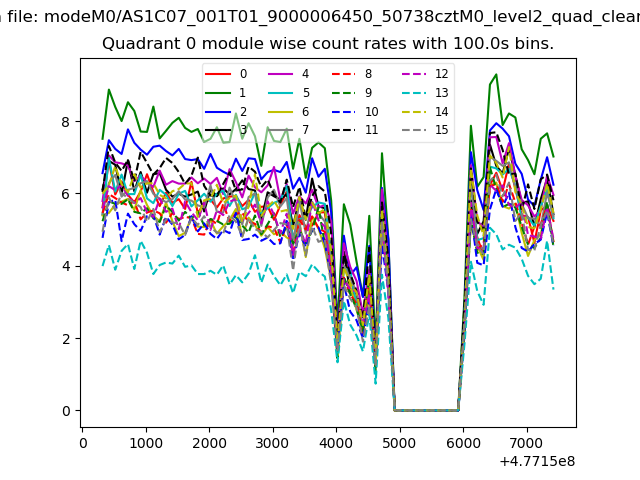 |
 |
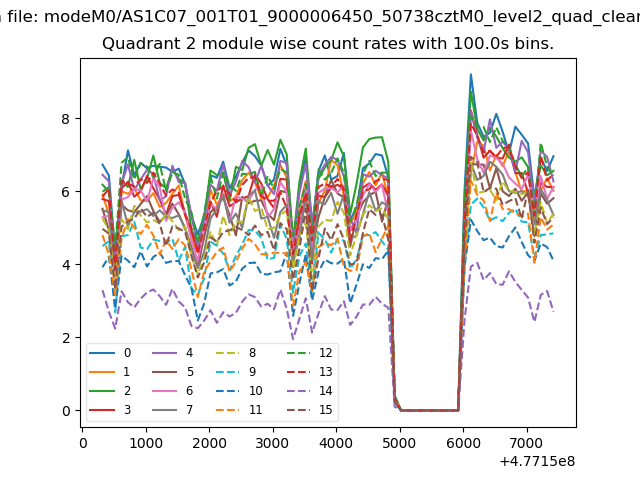
| Module-wise count rates for Quadrant B Data is divided into 100 sec bins |
 |
 |
| Module-wise count rates for Quadrant C Data is divided into 100 sec bins |
 |
 |
| Module-wise count rates for Quadrant D Data is divided into 100 sec bins |
 |
 |
| Parameter | Plot |
|---|---|
| CZT HV Monitor | 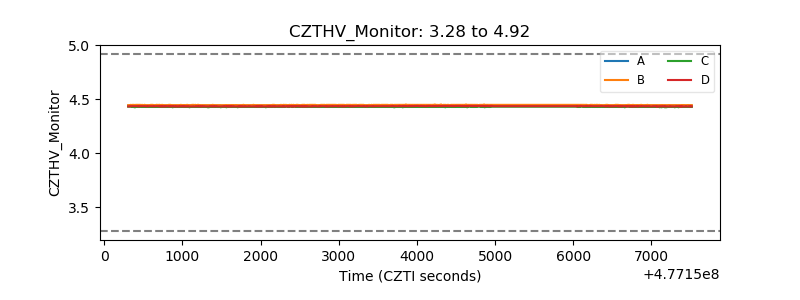 |
| D_VDD | 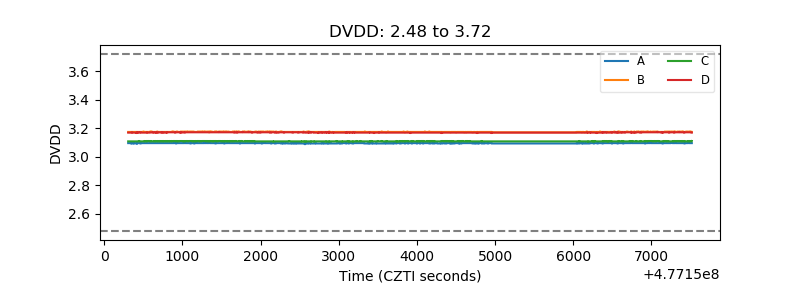 |
| Temperature 1 | 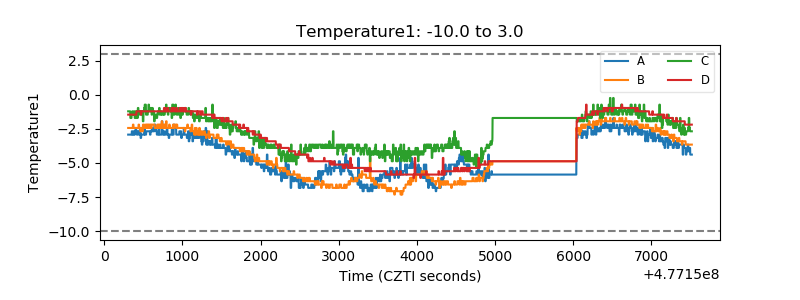 |
| Veto HV Monitor | 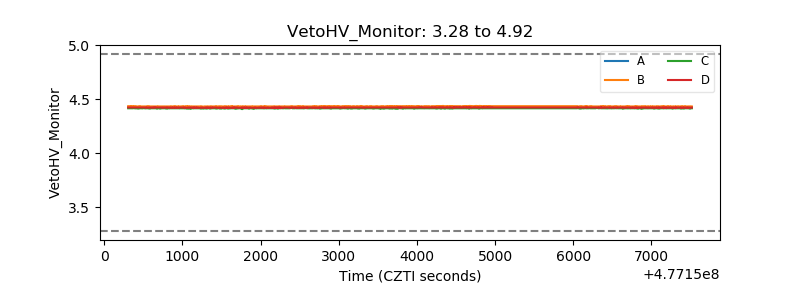 |
| Veto LLD | 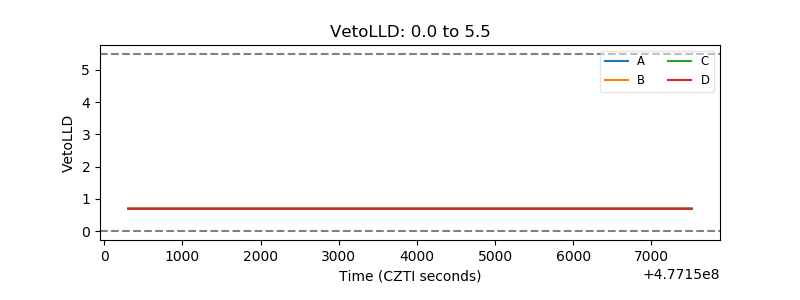 |
| Alpha Counter | 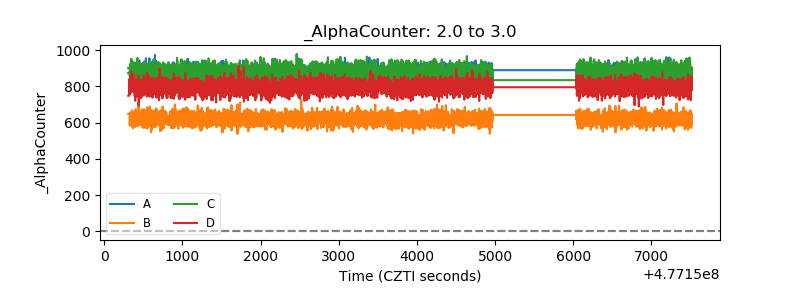 |
| _CPM_Rate | 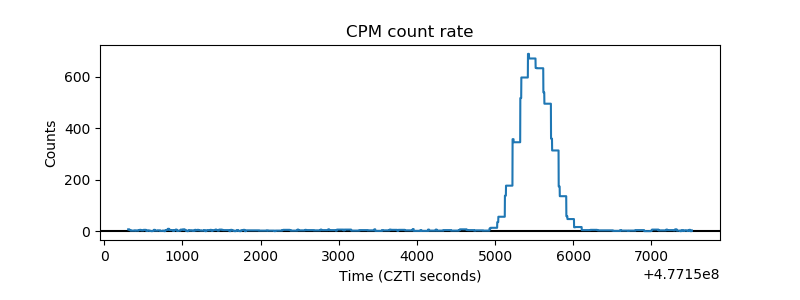 |
| CZT Counter | 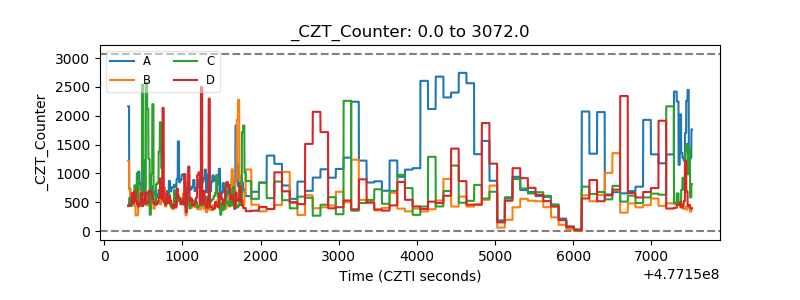 |
| +2.5 Volts monitor | 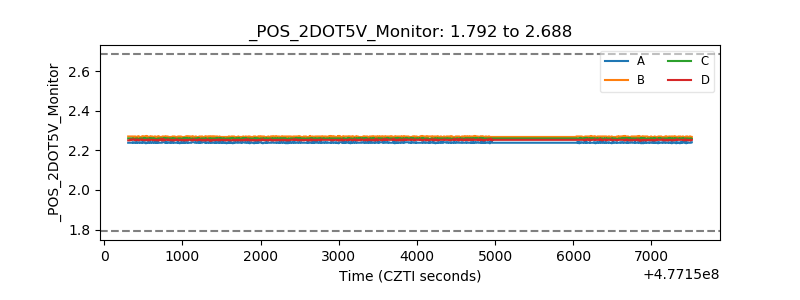 |
| +5 Volts monitor | 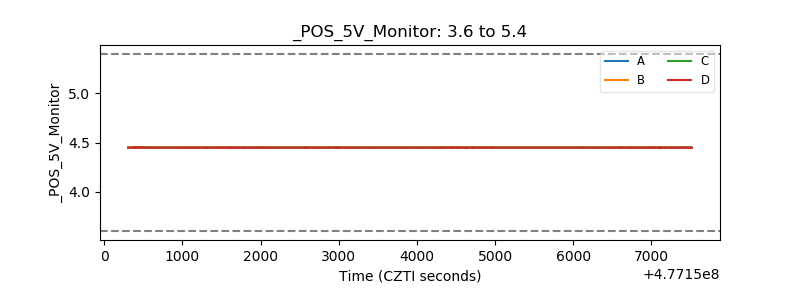 |
| _ROLL_ROT | 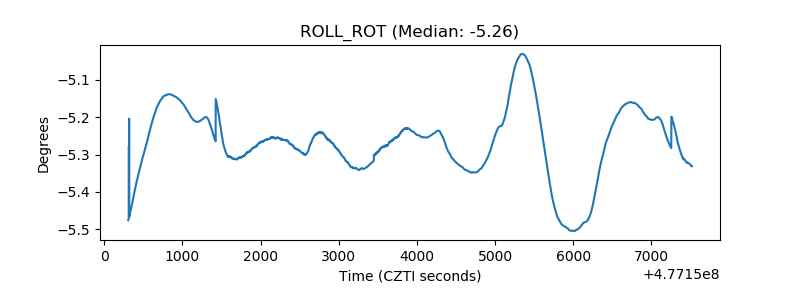 |
| _Roll_DEC | 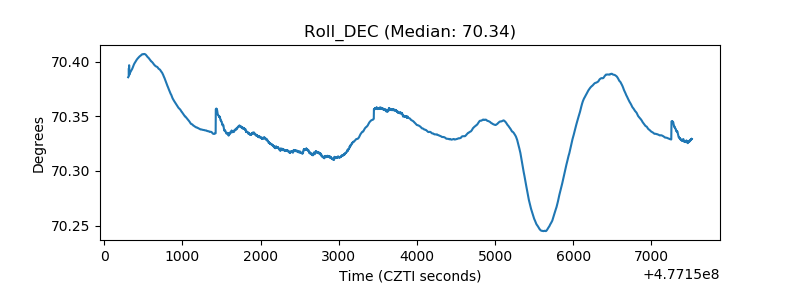 |
| _Roll_RA | 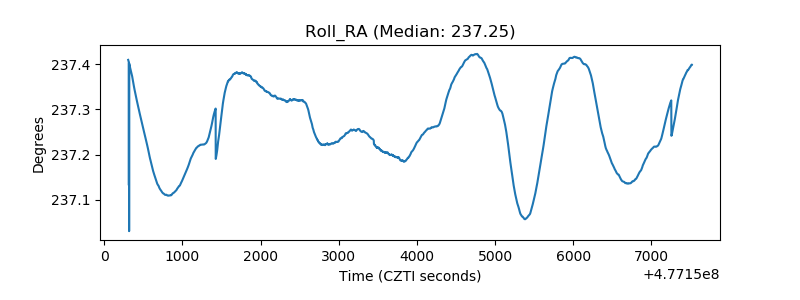 |
| Veto Counter | 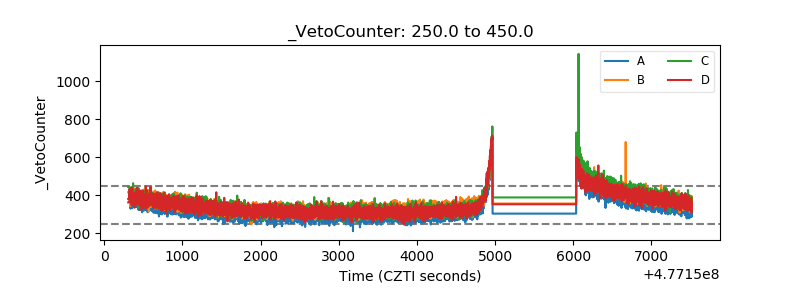 |