| Param | Original file | Final file |
|---|---|---|
| Filename | modeM0/AS1C07_001T01_9000006450_50739cztM0_level2.fits | modeM0/AS1C07_001T01_9000006450_50739cztM0_level2_quad_clean.evt |
| Size (bytes) | 562,786,560 | 89,003,520 |
| Size | 536.7 MB | 84.9 MB |
| Events in quadrant A | 6,608,874 | 558,670 |
| Events in quadrant B | 3,559,004 | 652,153 |
| Events in quadrant C | 4,564,731 | 565,991 |
| Events in quadrant D | 5,627,932 | 492,925 |
| Mode SS | |||
|---|---|---|---|
| Quadrant | BADHDUFLAG | Total packets | Discarded packets |
| A | 0 | 122 | 0 |
| B | 0 | 122 | 0 |
| C | 0 | 122 | 0 |
| D | 0 | 122 | 0 |
| Mode M0 | |||
|---|---|---|---|
| Quadrant | BADHDUFLAG | Total packets | Discarded packets |
| A | 0 | 24032 | 12 |
| B | 0 | 14702 | 13 |
| C | 0 | 17765 | 1 |
| D | 0 | 20863 | 1 |
| Mode M9 | |||
|---|---|---|---|
| Quadrant | BADHDUFLAG | Total packets | Discarded packets |
| A | 0 | 12 | 0 |
| B | 0 | 12 | 0 |
| C | 0 | 12 | 0 |
| D | 0 | 12 | 0 |
| Quadrant | Total seconds | Saturated seconds | Saturation percentage |
|---|---|---|---|
| A | 6092 | 644 | 10.571241% |
| B | 6091 | 192 | 3.152192% |
| C | 6095 | 263 | 4.315012% |
| D | 6095 | 709 | 11.632486% |
Noise dominated data is calculated using 1-second bins in cleaned event files. If a bin has >2000 counts, and if more than 50% of those come from <1% of pixels, then it is considered to be noise-dominated and hence unusable.
| Quadrant | # 1 sec bins | Bins with >0 counts | Bins with >2000 counts | High rate bins dominated by noise | Noise dominated (total time) | Noise dominated (detector-on time) | Marked lightcurve |
|---|---|---|---|---|---|---|---|
| A | 7254 | 6094 | 573 | 573 | 7.90% | 9.40% | 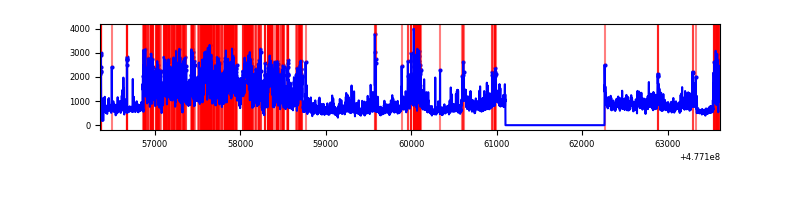 |
| B | 7254 | 6094 | 116 | 116 | 1.60% | 1.90% | 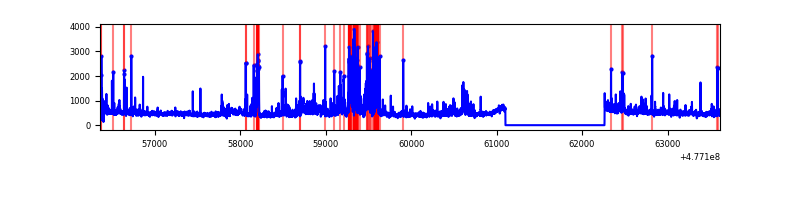 |
| C | 7255 | 6095 | 218 | 218 | 3.00% | 3.58% | 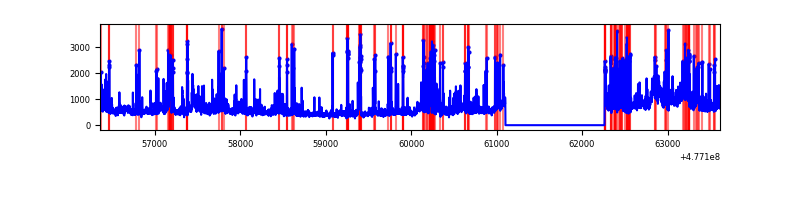 |
| D | 7254 | 6094 | 642 | 642 | 8.85% | 10.53% |  |
Top three noisy pixels from each quadrant. If the there are fewer than three noisy pixels in the level2.evt file, extra rows are filled as -1
| Pixel properties | Quadrant properties | ||||||
|---|---|---|---|---|---|---|---|
| Quadrant | DetID | PixID | Counts | Sigma | Mean | Median | Sigma |
| A | 4 | 4 | 3037587 | 18564.61 | 650 | 632 | 163.6 |
| A | 6 | 195 | 557885 | 3406.43 | 650 | 632 | 163.6 |
| A | 14 | 254 | 122573 | 745.41 | 650 | 632 | 163.6 |
| B | 0 | 172 | 379042 | 2694.47 | 663 | 639 | 140.4 |
| B | 7 | 0 | 75213 | 531.01 | 663 | 639 | 140.4 |
| B | 0 | 213 | 69430 | 489.84 | 663 | 639 | 140.4 |
| C | 12 | 247 | 426753 | 2422.02 | 647 | 641 | 175.9 |
| C | 3 | 233 | 363909 | 2064.82 | 647 | 641 | 175.9 |
| C | 13 | 3 | 254168 | 1441.05 | 647 | 641 | 175.9 |
| D | 15 | 174 | 945519 | 5506.58 | 618 | 596 | 171.6 |
| D | 15 | 108 | 673927 | 3923.87 | 618 | 596 | 171.6 |
| D | 1 | 47 | 471158 | 2742.22 | 618 | 596 | 171.6 |
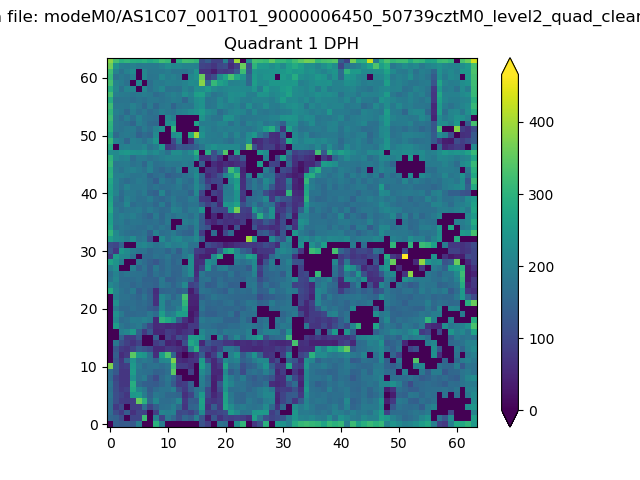
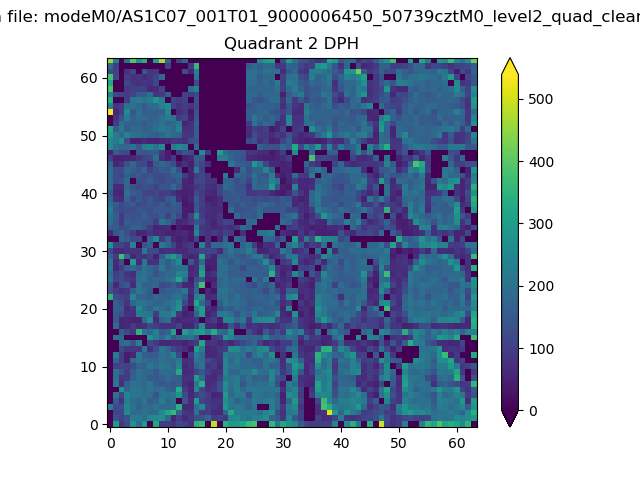
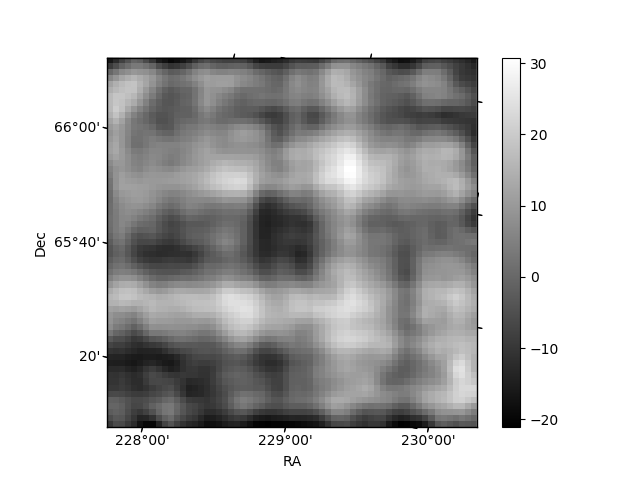
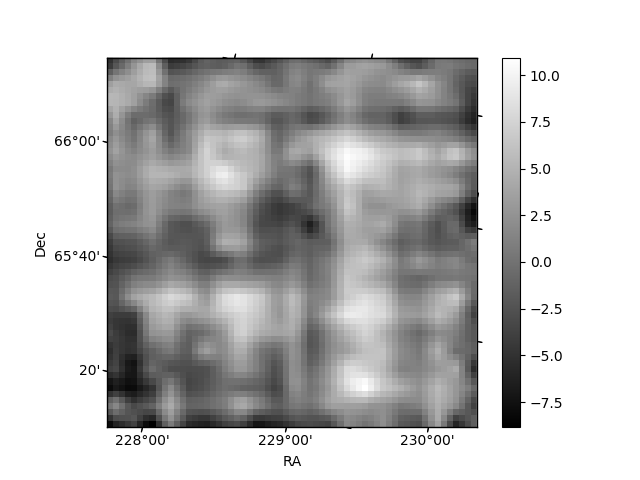
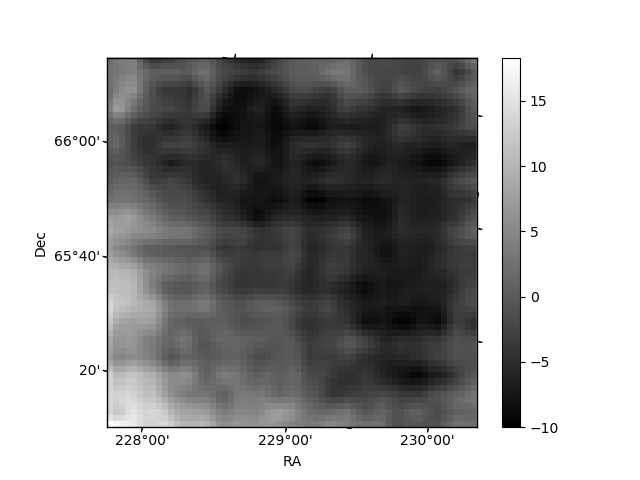
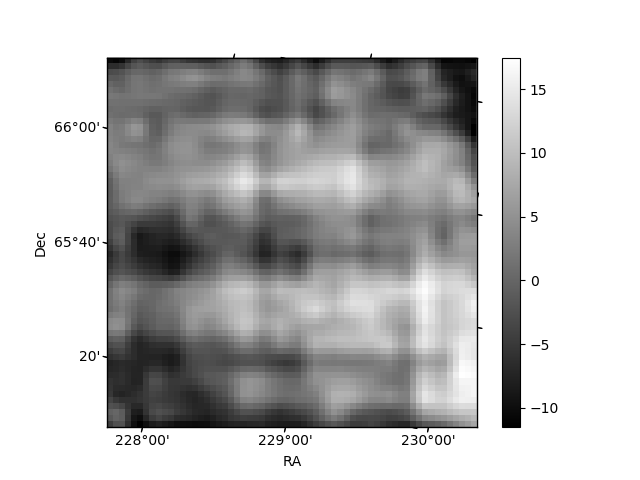
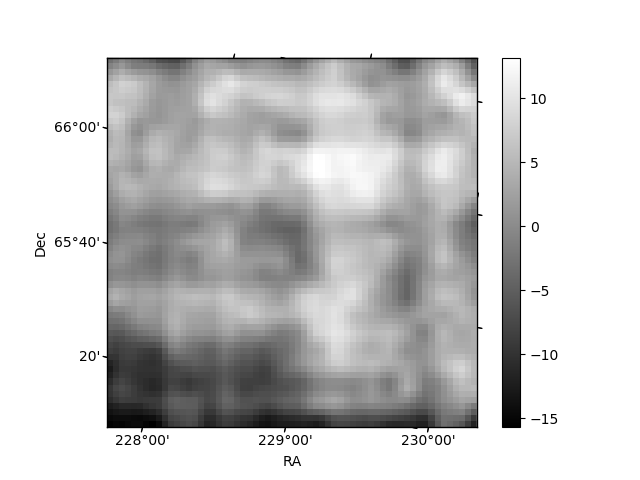
Histogram calculated using DETX and DETY for each event in the final _common_clean file
| Quadrant A | 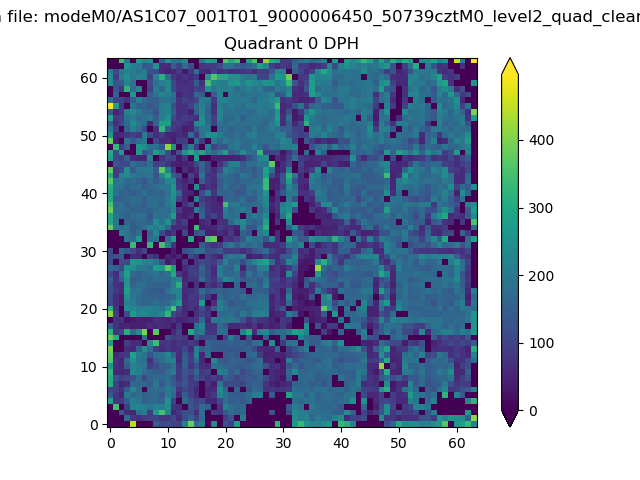 |
 |
Quadrant B |
|---|---|---|---|
| Quadrant D | 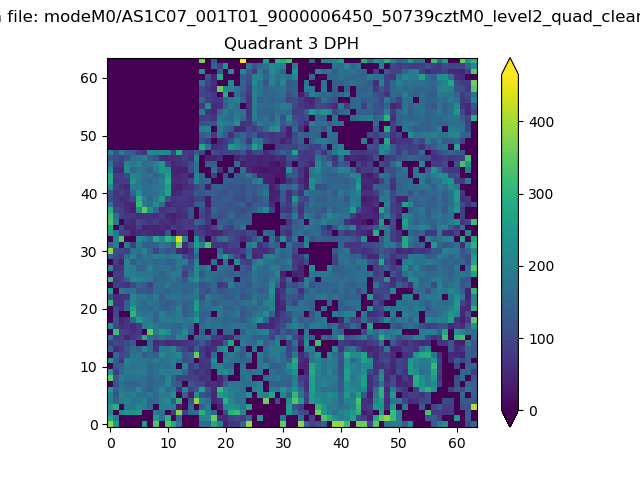 |
 |
Quadrant C |
| Plot type | Count rate plots | Images |
|---|---|---|
| Comparison with Poisson distribution Blue bars denote a histogram of data divided into 1 sec bins. Red curve is a Poisson curve with rate = median count rate of data. |
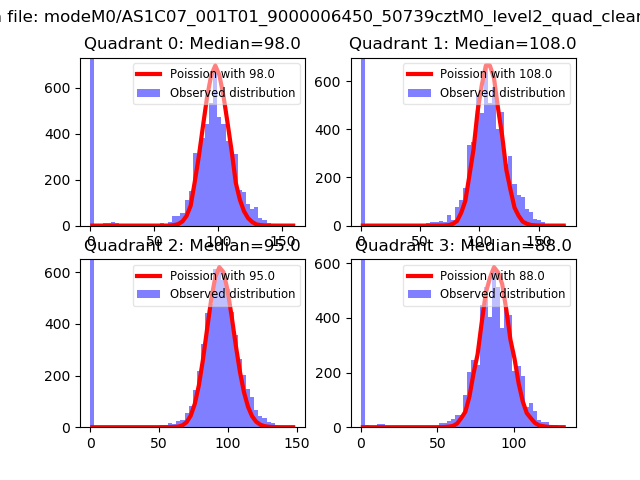 |
 |
| Quadrant-wise count rates Data is divided into 100 sec bins |
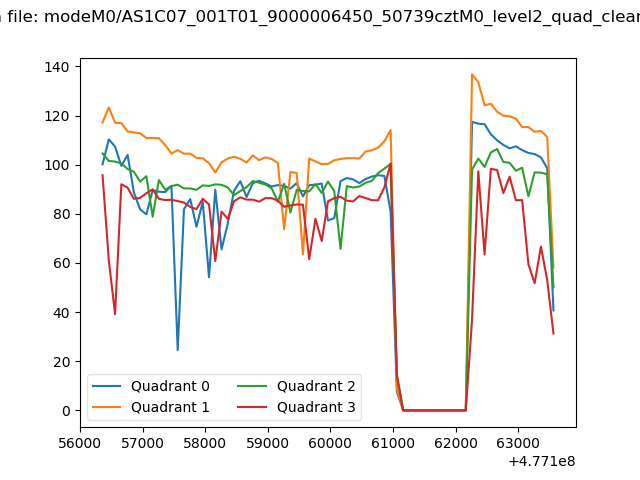 |
|
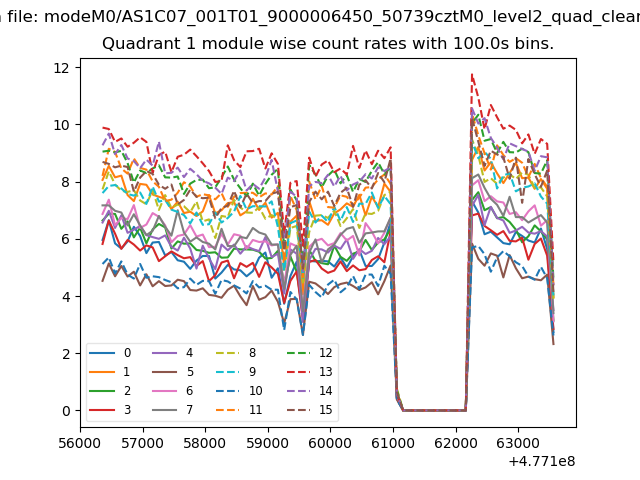
| Module-wise count rates for Quadrant A Data is divided into 100 sec bins |
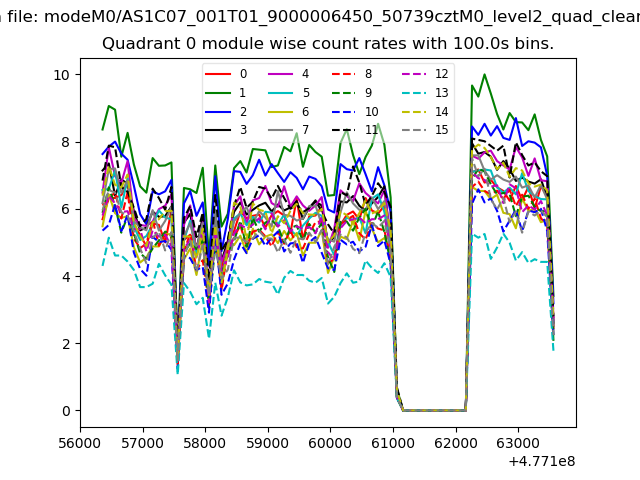 |
 |
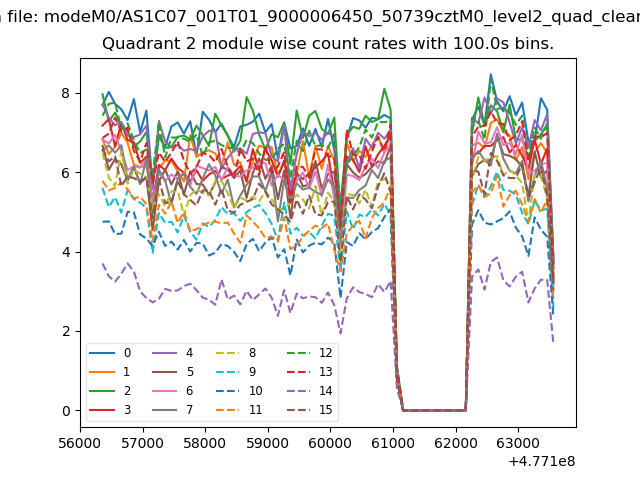
| Module-wise count rates for Quadrant B Data is divided into 100 sec bins |
 |
 |
| Module-wise count rates for Quadrant C Data is divided into 100 sec bins |
 |
 |
| Module-wise count rates for Quadrant D Data is divided into 100 sec bins |
 |
 |
| Parameter | Plot |
|---|---|
| CZT HV Monitor | 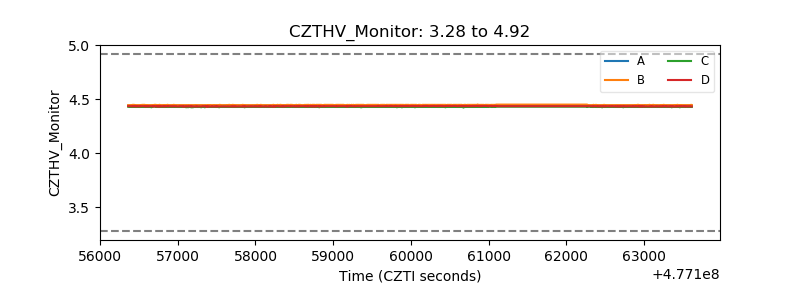 |
| D_VDD | 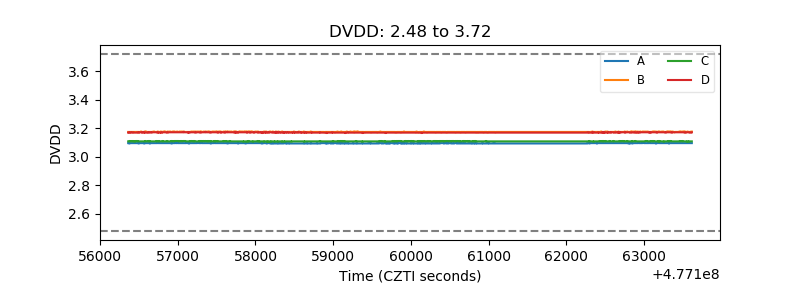 |
| Temperature 1 | 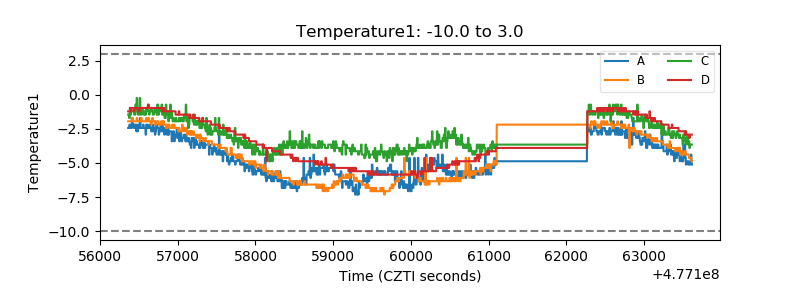 |
| Veto HV Monitor | 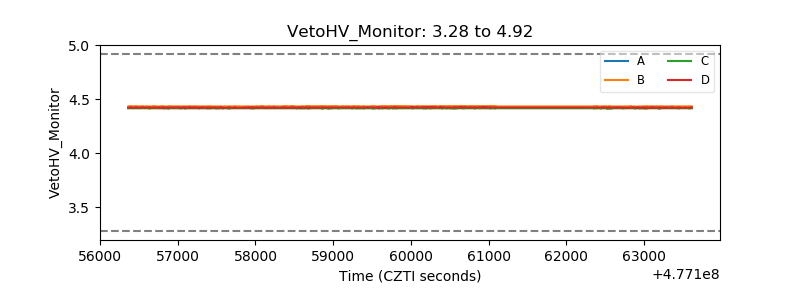 |
| Veto LLD | 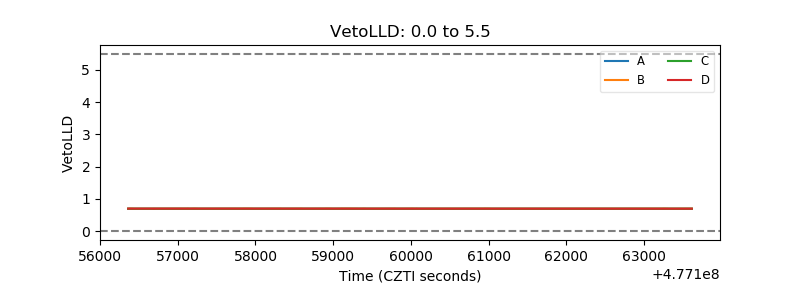 |
| Alpha Counter | 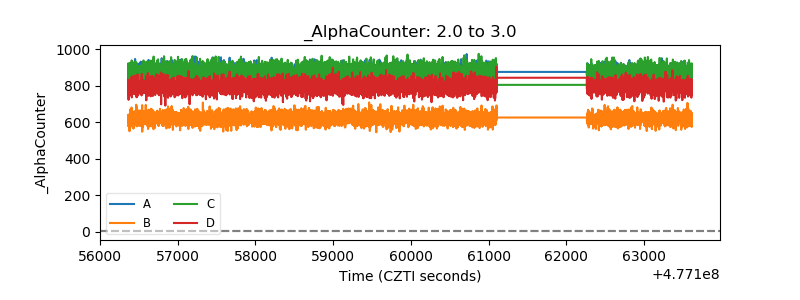 |
| _CPM_Rate | 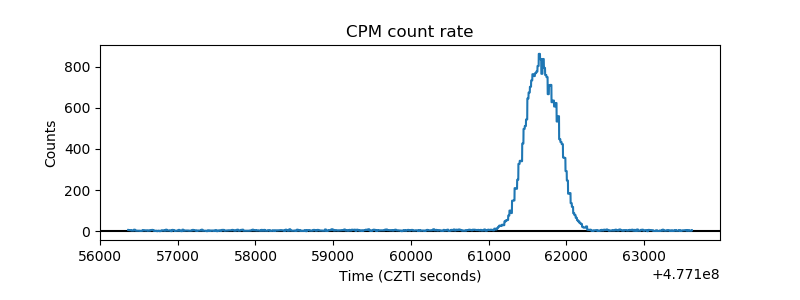 |
| CZT Counter | 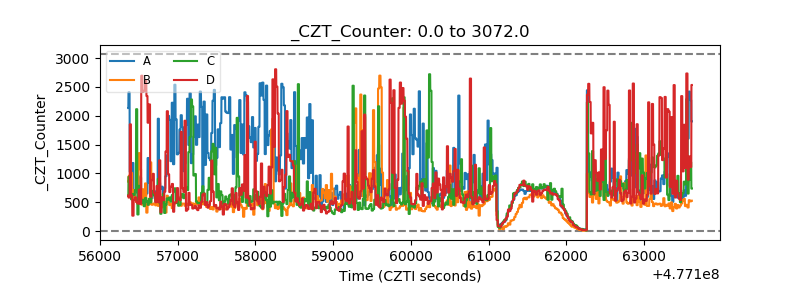 |
| +2.5 Volts monitor | 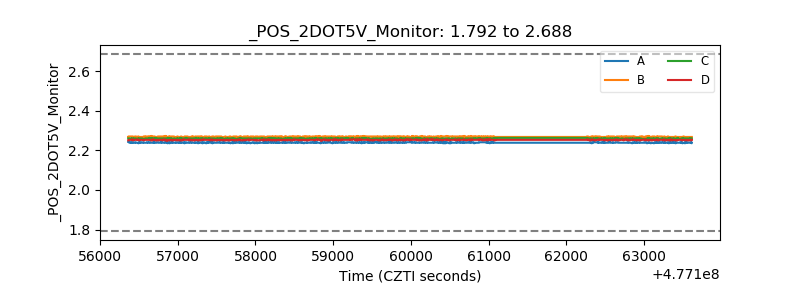 |
| +5 Volts monitor | 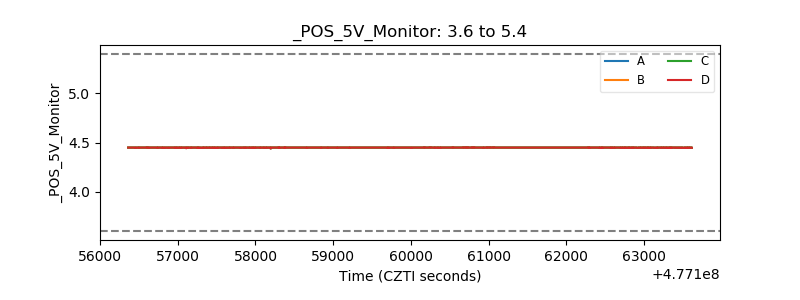 |
| _ROLL_ROT | 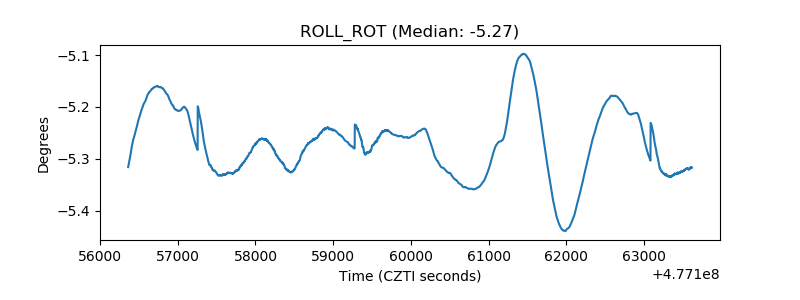 |
| _Roll_DEC | 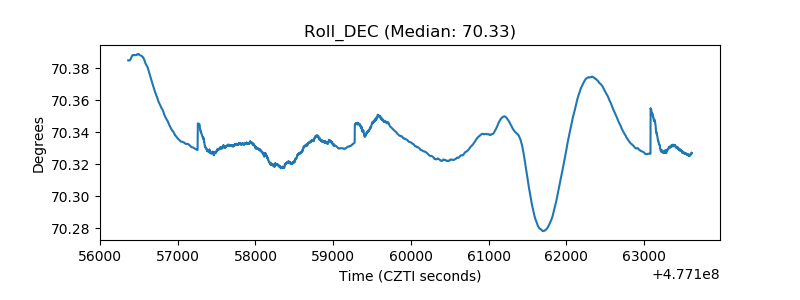 |
| _Roll_RA | 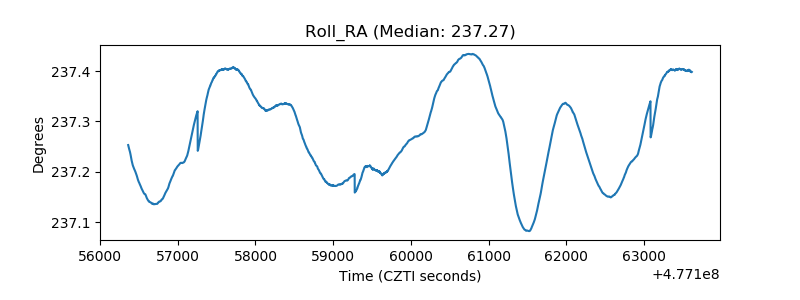 |
| Veto Counter | 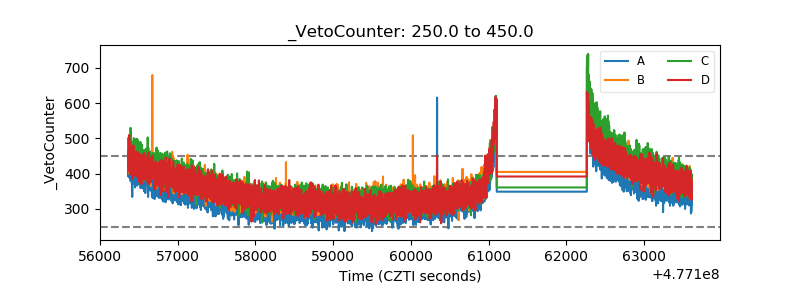 |