| Param | Original file | Final file |
|---|---|---|
| Filename | modeM0/AS1C07_001T01_9000006450_50740cztM0_level2.fits | modeM0/AS1C07_001T01_9000006450_50740cztM0_level2_quad_clean.evt |
| Size (bytes) | 612,869,760 | 87,621,120 |
| Size | 584.5 MB | 83.6 MB |
| Events in quadrant A | 5,386,806 | 590,837 |
| Events in quadrant B | 3,359,959 | 659,501 |
| Events in quadrant C | 7,059,572 | 533,757 |
| Events in quadrant D | 6,408,302 | 443,757 |
| Mode SS | |||
|---|---|---|---|
| Quadrant | BADHDUFLAG | Total packets | Discarded packets |
| A | 0 | 126 | 4 |
| B | 0 | 126 | 4 |
| C | 0 | 126 | 4 |
| D | 0 | 126 | 4 |
| Mode M0 | |||
|---|---|---|---|
| Quadrant | BADHDUFLAG | Total packets | Discarded packets |
| A | 0 | 20666 | 433 |
| B | 0 | 14496 | 242 |
| C | 0 | 25795 | 469 |
| D | 0 | 23867 | 604 |
| Mode M9 | |||
|---|---|---|---|
| Quadrant | BADHDUFLAG | Total packets | Discarded packets |
| A | 0 | 12 | 0 |
| B | 0 | 12 | 0 |
| C | 0 | 12 | 0 |
| D | 0 | 12 | 0 |
| Quadrant | Total seconds | Saturated seconds | Saturation percentage |
|---|---|---|---|
| A | 6090 | 264 | 4.334975% |
| B | 6116 | 148 | 2.419882% |
| C | 6086 | 693 | 11.386789% |
| D | 6094 | 1263 | 20.725304% |
Noise dominated data is calculated using 1-second bins in cleaned event files. If a bin has >2000 counts, and if more than 50% of those come from <1% of pixels, then it is considered to be noise-dominated and hence unusable.
| Quadrant | # 1 sec bins | Bins with >0 counts | Bins with >2000 counts | High rate bins dominated by noise | Noise dominated (total time) | Noise dominated (detector-on time) | Marked lightcurve |
|---|---|---|---|---|---|---|---|
| A | 7286 | 6117 | 171 | 171 | 2.35% | 2.80% | 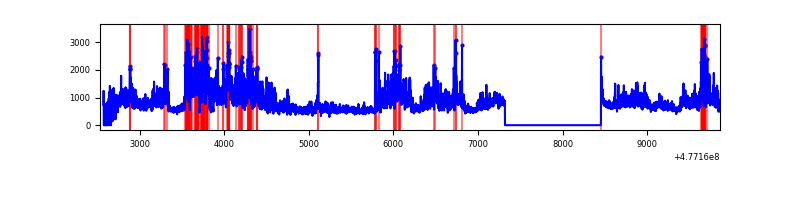 |
| B | 7308 | 6138 | 41 | 41 | 0.56% | 0.67% | 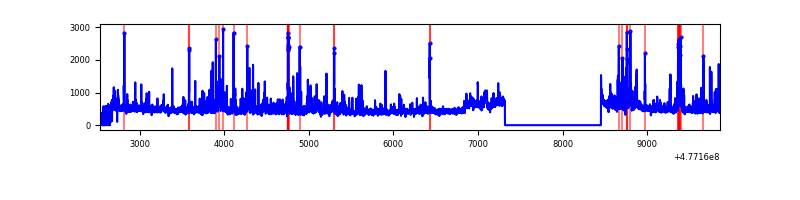 |
| C | 7328 | 6116 | 566 | 566 | 7.72% | 9.25% | 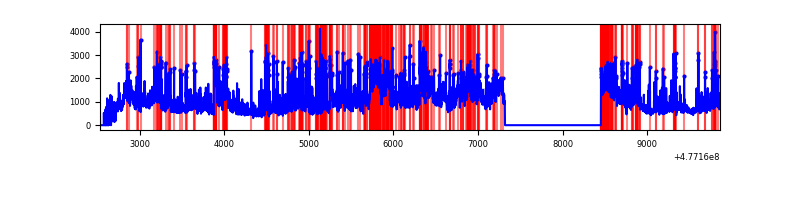 |
| D | 7309 | 6120 | 1122 | 1122 | 15.35% | 18.33% |  |
Top three noisy pixels from each quadrant. If the there are fewer than three noisy pixels in the level2.evt file, extra rows are filled as -1
| Pixel properties | Quadrant properties | ||||||
|---|---|---|---|---|---|---|---|
| Quadrant | DetID | PixID | Counts | Sigma | Mean | Median | Sigma |
| A | 4 | 4 | 2168699 | 13173.78 | 658 | 641 | 164.6 |
| A | 8 | 38 | 151382 | 915.95 | 658 | 641 | 164.6 |
| A | 6 | 195 | 150882 | 912.91 | 658 | 641 | 164.6 |
| B | 0 | 172 | 153669 | 1082.17 | 668 | 644 | 141.4 |
| B | 7 | 0 | 115809 | 814.43 | 668 | 644 | 141.4 |
| B | 8 | 128 | 83154 | 583.5 | 668 | 644 | 141.4 |
| C | 3 | 233 | 1537884 | 8844.57 | 630 | 621 | 173.8 |
| C | 12 | 247 | 1090019 | 6267.8 | 630 | 621 | 173.8 |
| C | 5 | 10 | 427198 | 2454.29 | 630 | 621 | 173.8 |
| D | 2 | 226 | 1121786 | 7108.77 | 572 | 550 | 157.7 |
| D | 15 | 174 | 1105128 | 7003.15 | 572 | 550 | 157.7 |
| D | 2 | 216 | 697116 | 4416.31 | 572 | 550 | 157.7 |
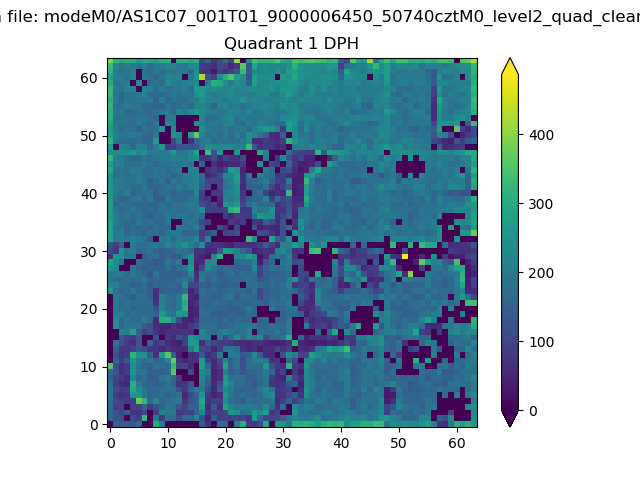
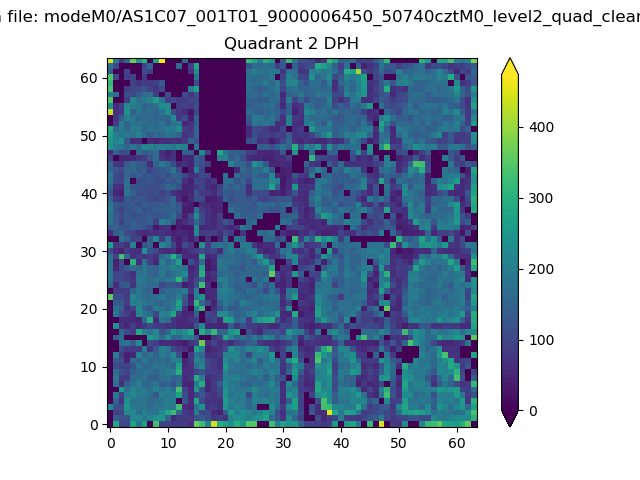
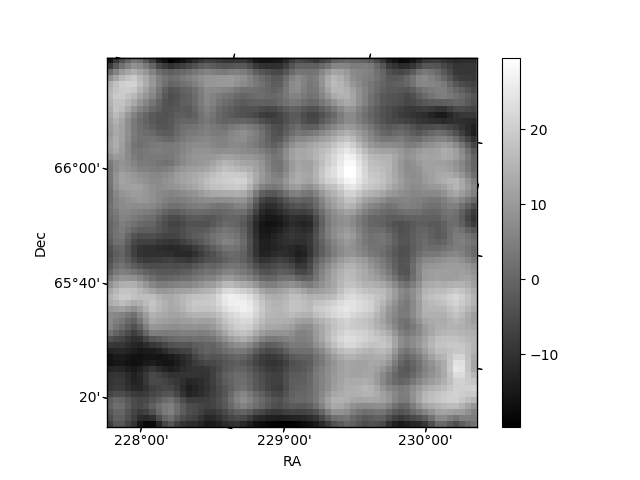
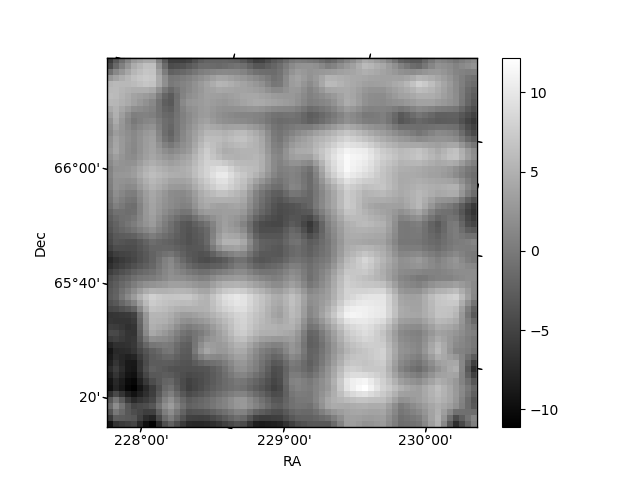
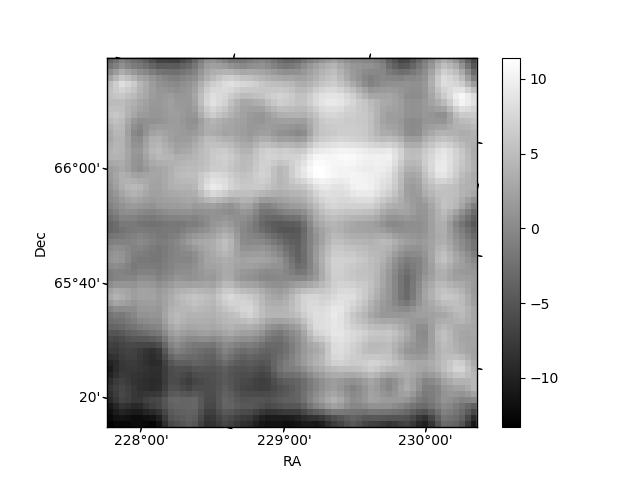
Histogram calculated using DETX and DETY for each event in the final _common_clean file
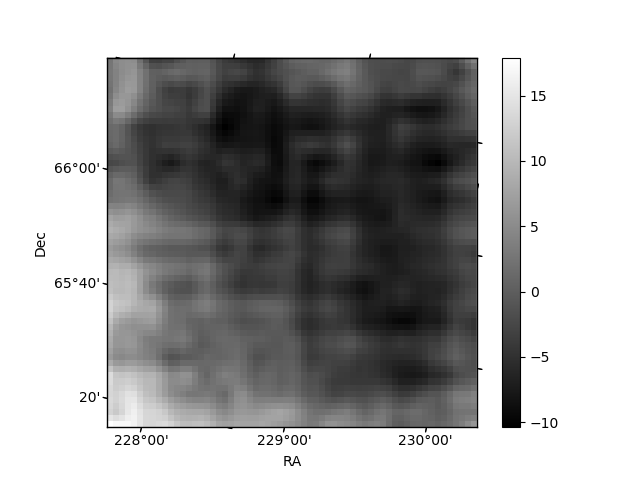
| Quadrant A | 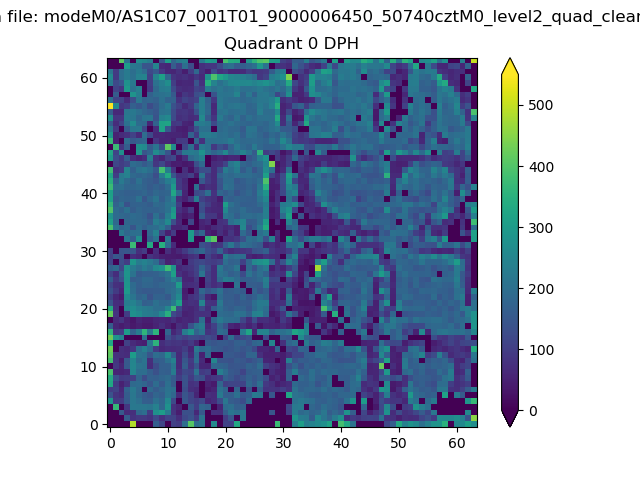 |
 |
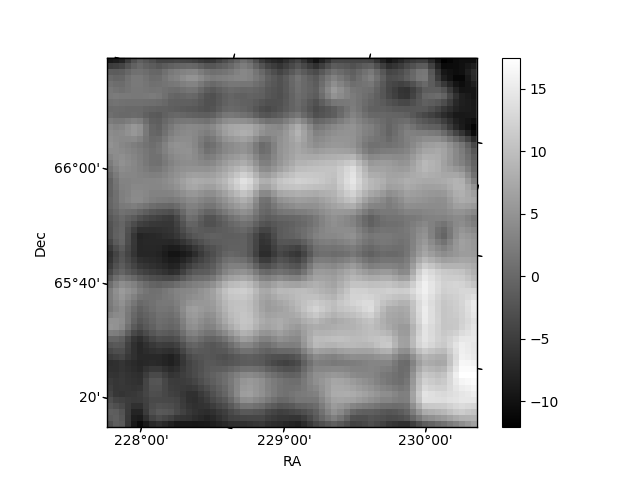
Quadrant B |
|---|---|---|---|
| Quadrant D | 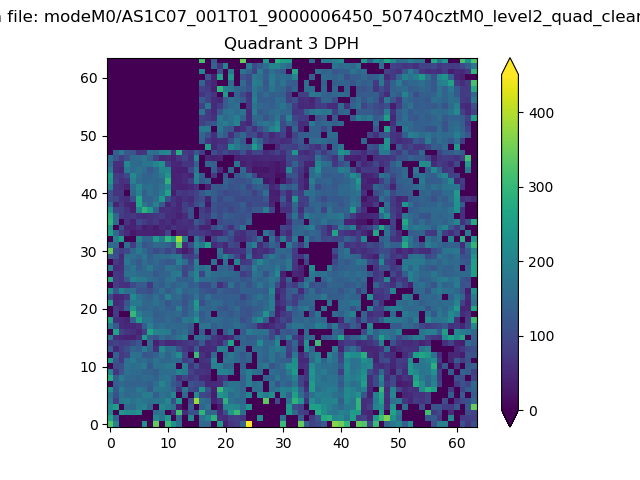 |
 |
Quadrant C |
| Plot type | Count rate plots | Images |
|---|---|---|
| Comparison with Poisson distribution Blue bars denote a histogram of data divided into 1 sec bins. Red curve is a Poisson curve with rate = median count rate of data. |
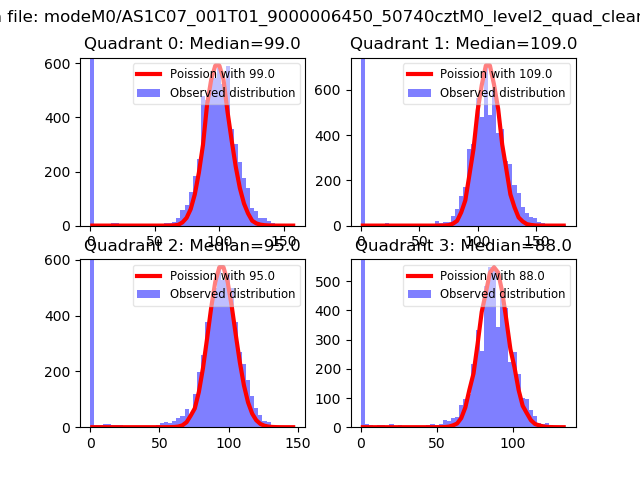 |
 |
| Quadrant-wise count rates Data is divided into 100 sec bins |
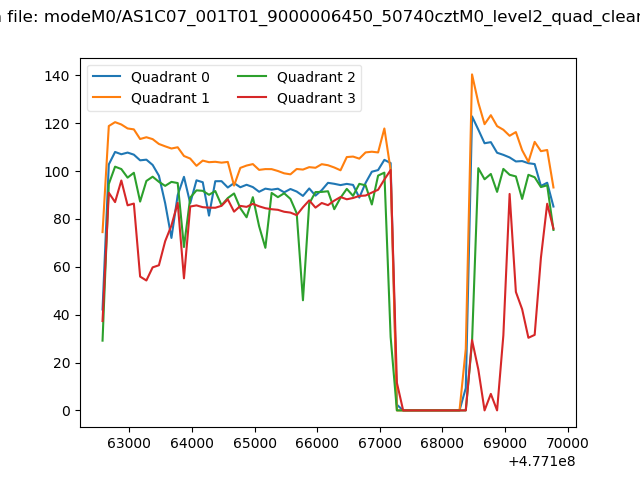 |
|
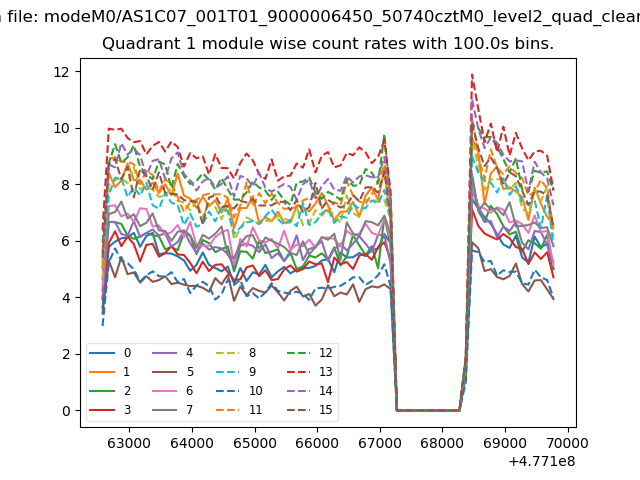
| Module-wise count rates for Quadrant A Data is divided into 100 sec bins |
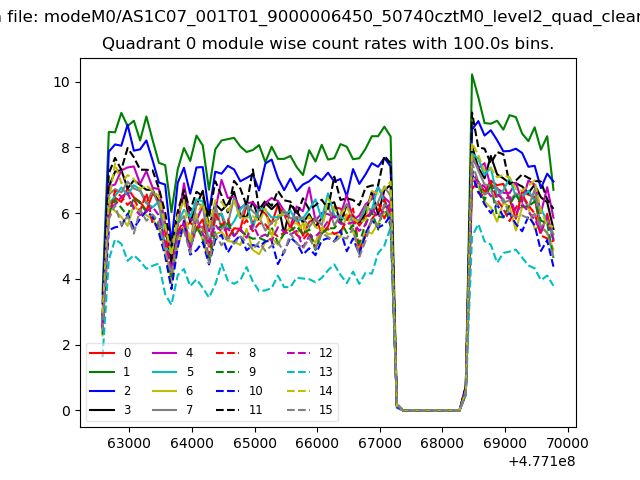 |
 |
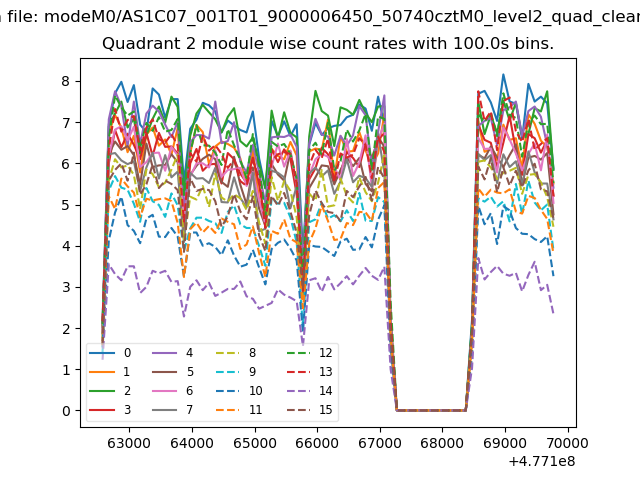
| Module-wise count rates for Quadrant B Data is divided into 100 sec bins |
 |
 |
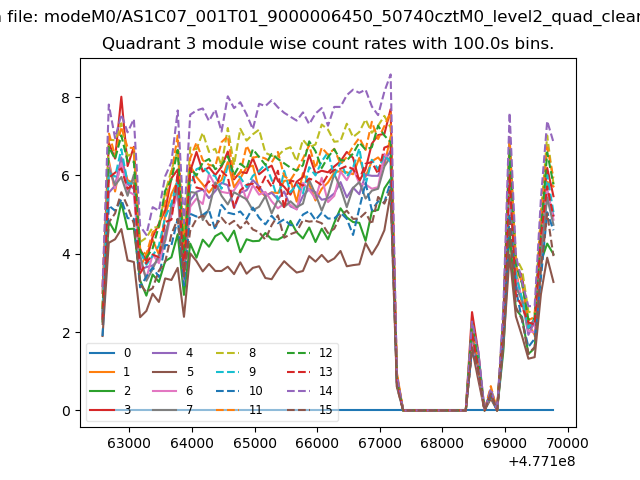
| Module-wise count rates for Quadrant C Data is divided into 100 sec bins |
 |
 |
| Module-wise count rates for Quadrant D Data is divided into 100 sec bins |
 |
 |
| Parameter | Plot |
|---|---|
| CZT HV Monitor | 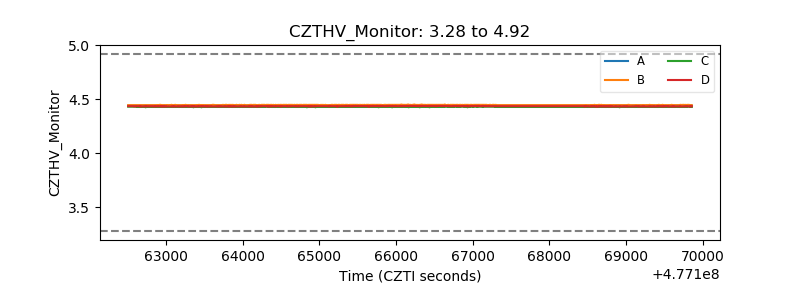 |
| D_VDD | 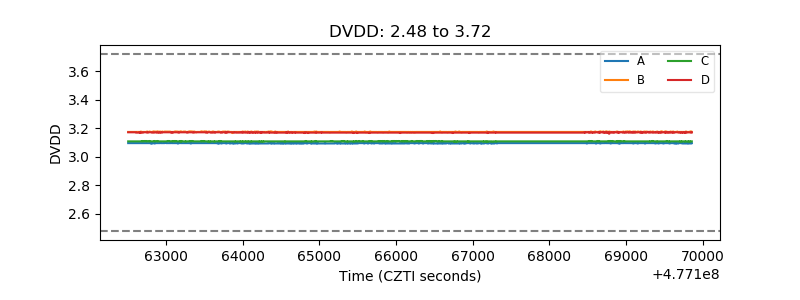 |
| Temperature 1 | 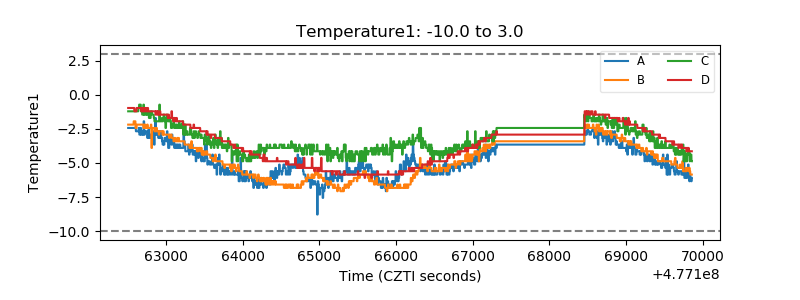 |
| Veto HV Monitor | 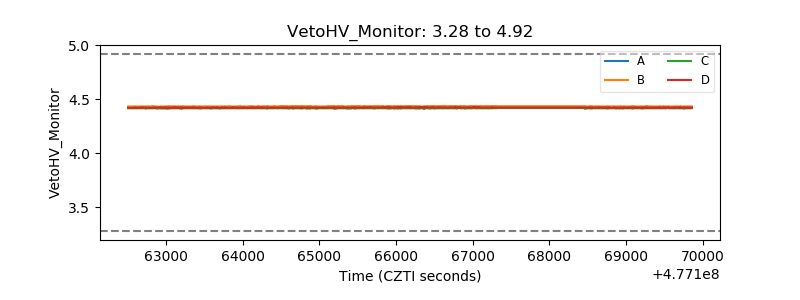 |
| Veto LLD | 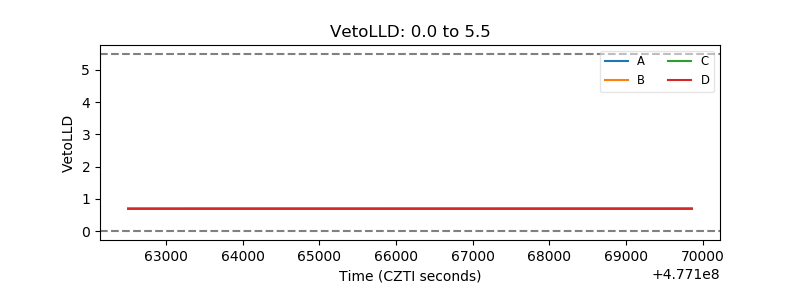 |
| Alpha Counter | 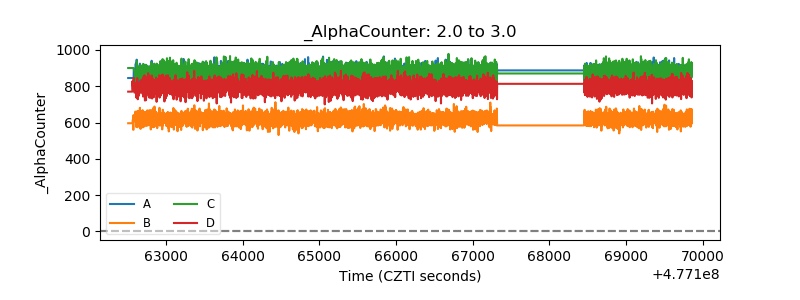 |
| _CPM_Rate | 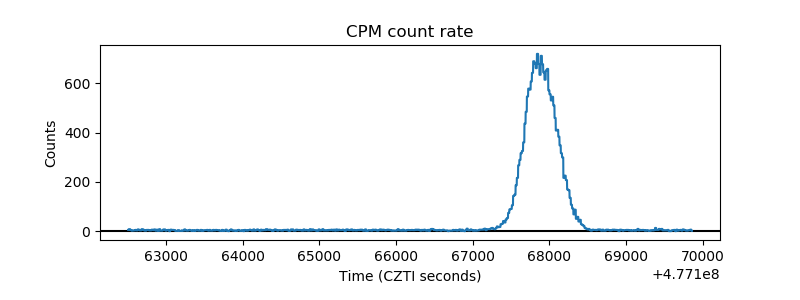 |
| CZT Counter | 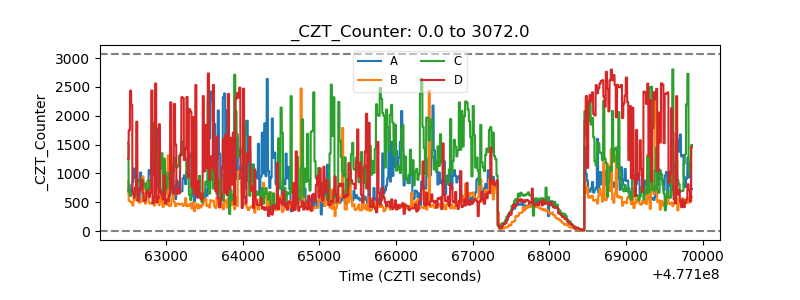 |
| +2.5 Volts monitor | 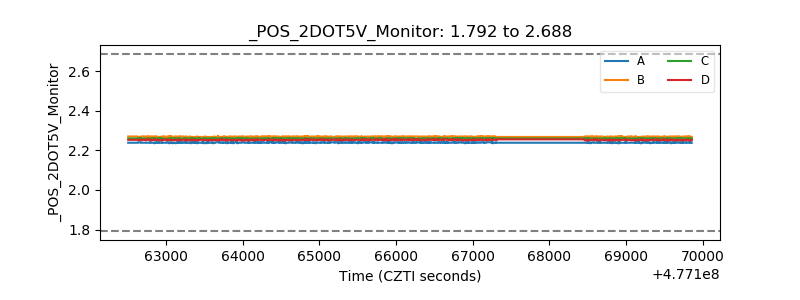 |
| +5 Volts monitor | 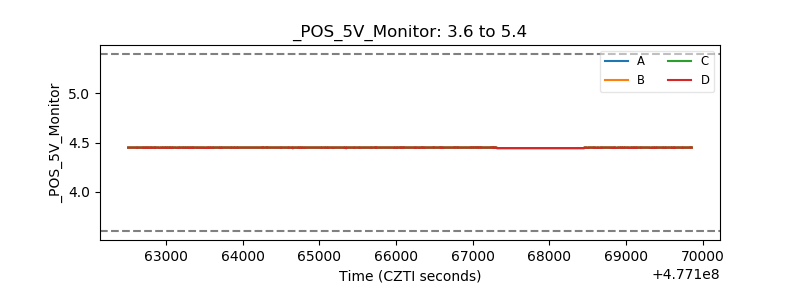 |
| _ROLL_ROT | 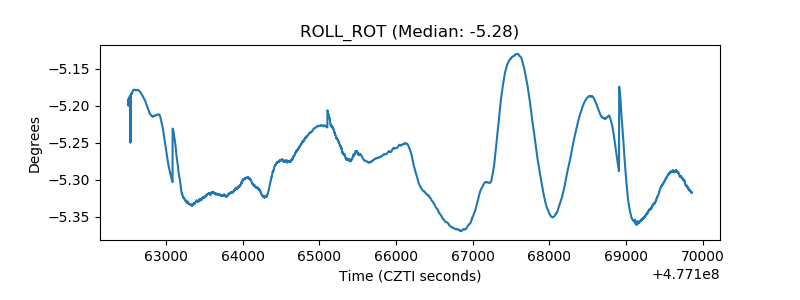 |
| _Roll_DEC | 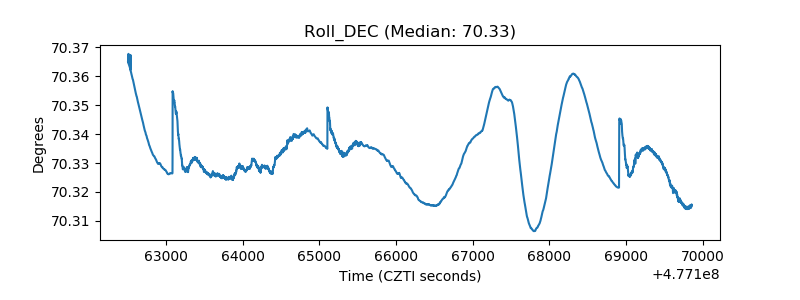 |
| _Roll_RA | 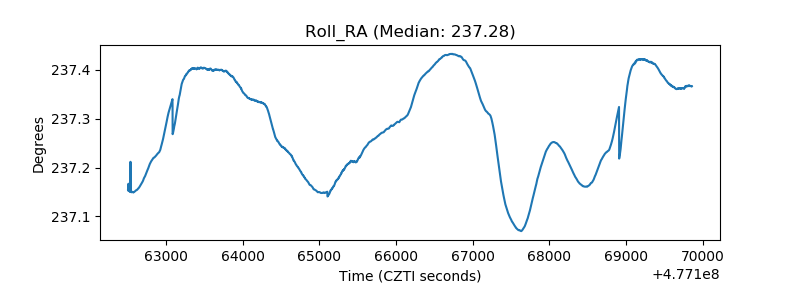 |
| Veto Counter | 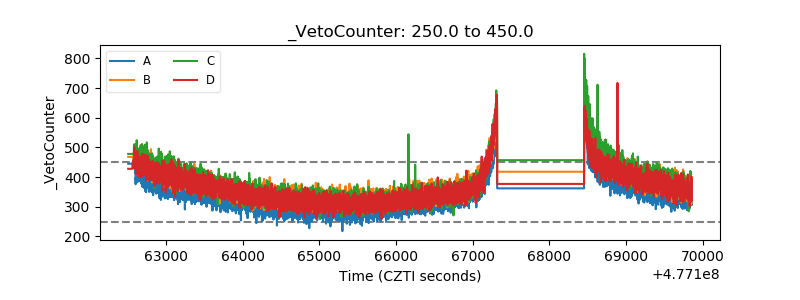 |