| Param | Original file | Final file |
|---|---|---|
| Filename | modeM0/AS1C07_001T01_9000006450_50741cztM0_level2.fits | modeM0/AS1C07_001T01_9000006450_50741cztM0_level2_quad_clean.evt |
| Size (bytes) | 603,080,640 | 88,894,080 |
| Size | 575.1 MB | 84.8 MB |
| Events in quadrant A | 5,404,090 | 607,916 |
| Events in quadrant B | 3,490,283 | 667,156 |
| Events in quadrant C | 5,514,197 | 567,487 |
| Events in quadrant D | 7,427,781 | 409,633 |
| Mode SS | |||
|---|---|---|---|
| Quadrant | BADHDUFLAG | Total packets | Discarded packets |
| A | 0 | 128 | 0 |
| B | 0 | 128 | 0 |
| C | 0 | 128 | 0 |
| D | 0 | 128 | 0 |
| Mode M0 | |||
|---|---|---|---|
| Quadrant | BADHDUFLAG | Total packets | Discarded packets |
| A | 0 | 20708 | 62 |
| B | 0 | 14820 | 56 |
| C | 0 | 20974 | 144 |
| D | 0 | 26603 | 165 |
| Mode M9 | |||
|---|---|---|---|
| Quadrant | BADHDUFLAG | Total packets | Discarded packets |
| A | 0 | 11 | 0 |
| B | 0 | 11 | 0 |
| C | 0 | 11 | 0 |
| D | 0 | 11 | 0 |
| Quadrant | Total seconds | Saturated seconds | Saturation percentage |
|---|---|---|---|
| A | 6299 | 169 | 2.682966% |
| B | 6298 | 175 | 2.778660% |
| C | 6293 | 464 | 7.373272% |
| D | 6292 | 1747 | 27.765416% |
Noise dominated data is calculated using 1-second bins in cleaned event files. If a bin has >2000 counts, and if more than 50% of those come from <1% of pixels, then it is considered to be noise-dominated and hence unusable.
| Quadrant | # 1 sec bins | Bins with >0 counts | Bins with >2000 counts | High rate bins dominated by noise | Noise dominated (total time) | Noise dominated (detector-on time) | Marked lightcurve |
|---|---|---|---|---|---|---|---|
| A | 7401 | 6303 | 76 | 76 | 1.03% | 1.21% | 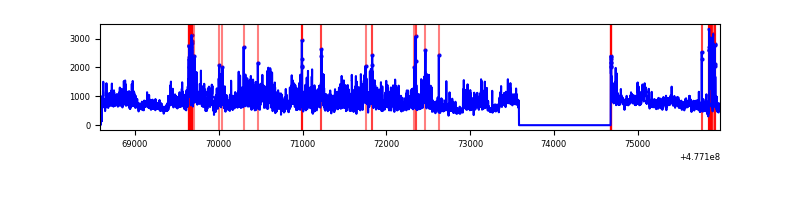 |
| B | 7397 | 6302 | 60 | 60 | 0.81% | 0.95% | 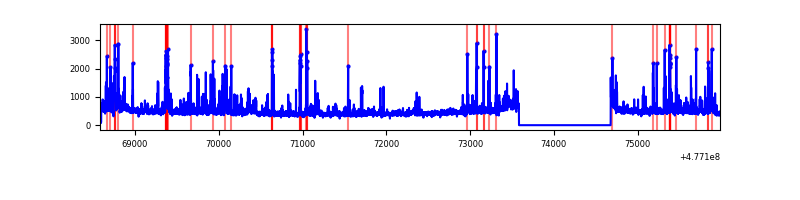 |
| C | 7398 | 6302 | 372 | 372 | 5.03% | 5.90% | 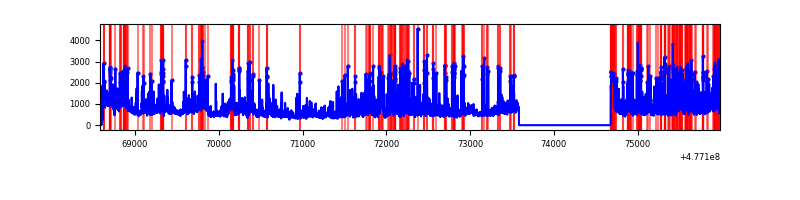 |
| D | 7397 | 6293 | 1620 | 1620 | 21.90% | 25.74% | 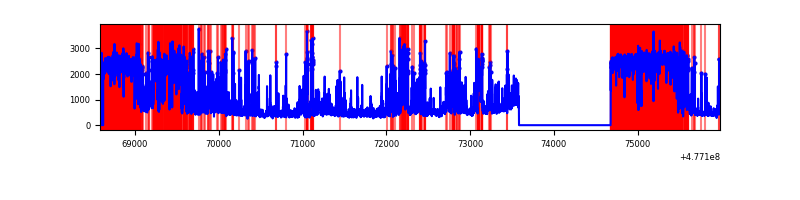 |
Top three noisy pixels from each quadrant. If the there are fewer than three noisy pixels in the level2.evt file, extra rows are filled as -1
| Pixel properties | Quadrant properties | ||||||
|---|---|---|---|---|---|---|---|
| Quadrant | DetID | PixID | Counts | Sigma | Mean | Median | Sigma |
| A | 4 | 4 | 2115681 | 12419.29 | 678 | 661 | 170.3 |
| A | 8 | 38 | 154618 | 904.03 | 678 | 661 | 170.3 |
| A | 4 | 3 | 132729 | 775.5 | 678 | 661 | 170.3 |
| B | 0 | 171 | 119414 | 825.45 | 679 | 657 | 143.9 |
| B | 10 | 247 | 106200 | 733.6 | 679 | 657 | 143.9 |
| B | 0 | 172 | 88650 | 611.62 | 679 | 657 | 143.9 |
| C | 9 | 38 | 625896 | 3503.64 | 653 | 647 | 178.5 |
| C | 5 | 10 | 539635 | 3020.27 | 653 | 647 | 178.5 |
| C | 12 | 247 | 482444 | 2699.79 | 653 | 647 | 178.5 |
| D | 2 | 216 | 1664117 | 10842.95 | 552 | 532 | 153.4 |
| D | 2 | 226 | 1117518 | 7280.31 | 552 | 532 | 153.4 |
| D | 15 | 174 | 886174 | 5772.46 | 552 | 532 | 153.4 |
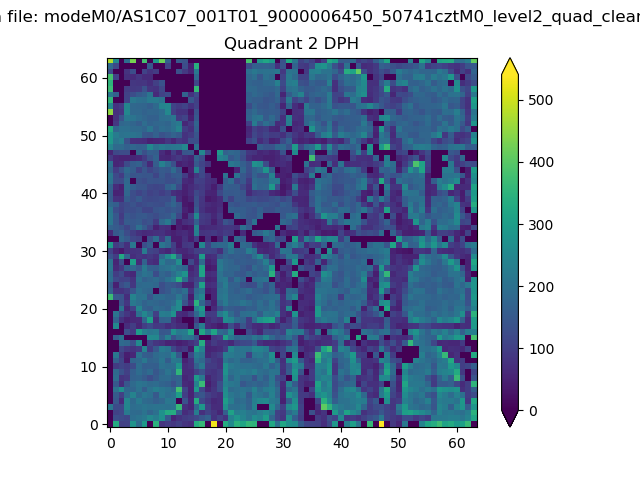
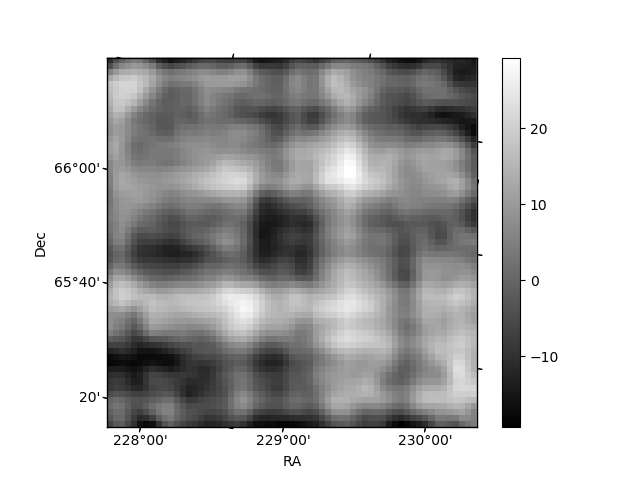
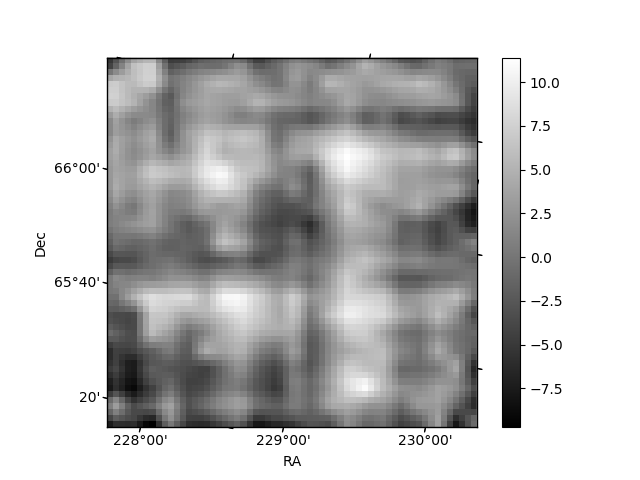
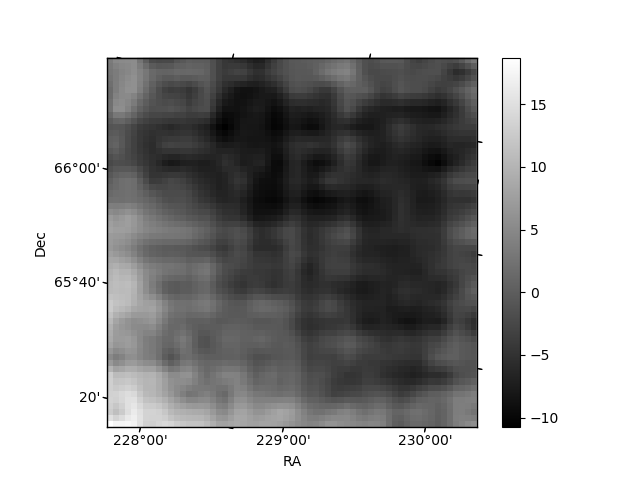
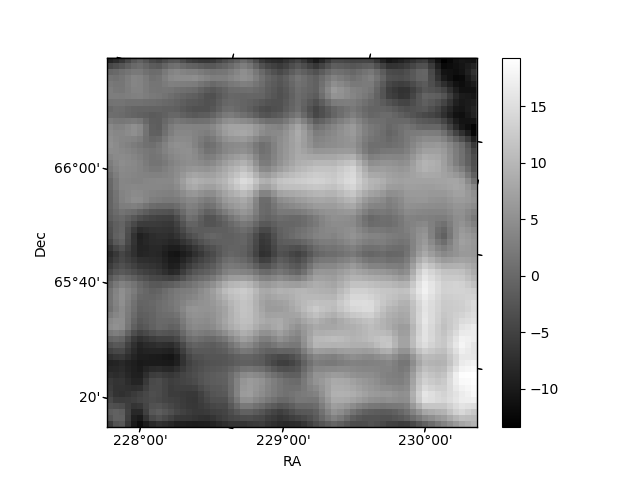
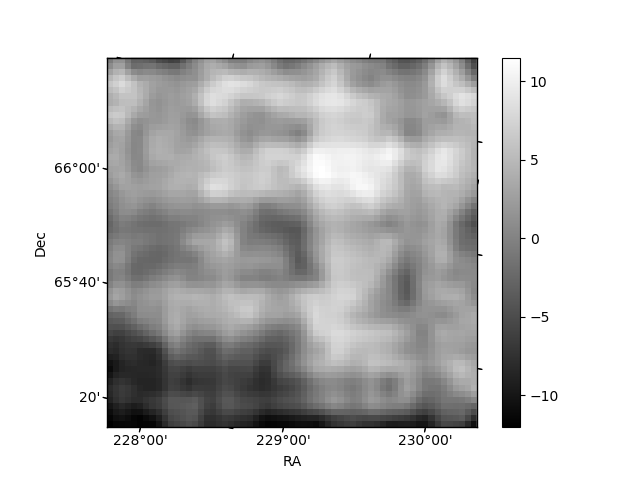
Histogram calculated using DETX and DETY for each event in the final _common_clean file
| Quadrant A | 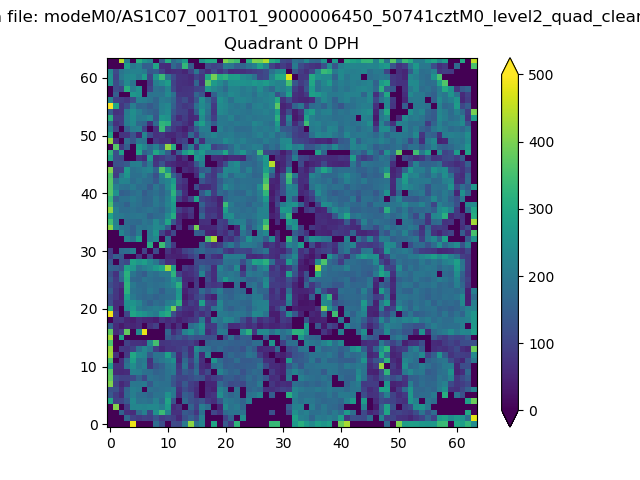 |
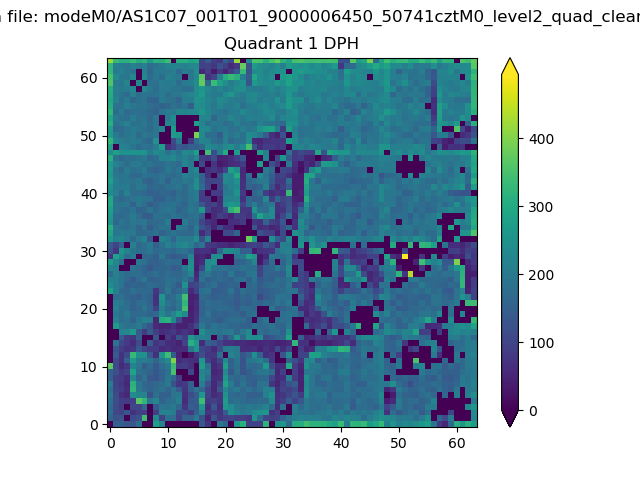 |
Quadrant B |
|---|---|---|---|
| Quadrant D | 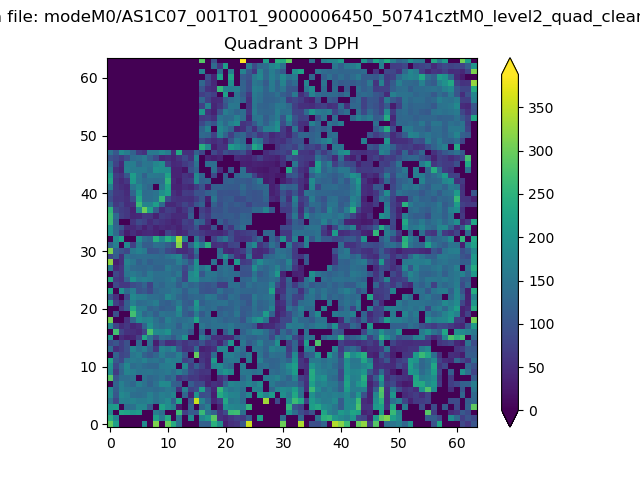 |
 |
Quadrant C |
| Plot type | Count rate plots | Images |
|---|---|---|
| Comparison with Poisson distribution Blue bars denote a histogram of data divided into 1 sec bins. Red curve is a Poisson curve with rate = median count rate of data. |
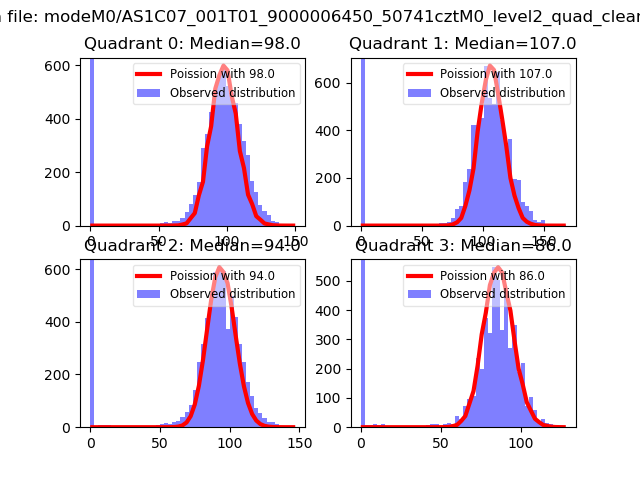 |
 |
| Quadrant-wise count rates Data is divided into 100 sec bins |
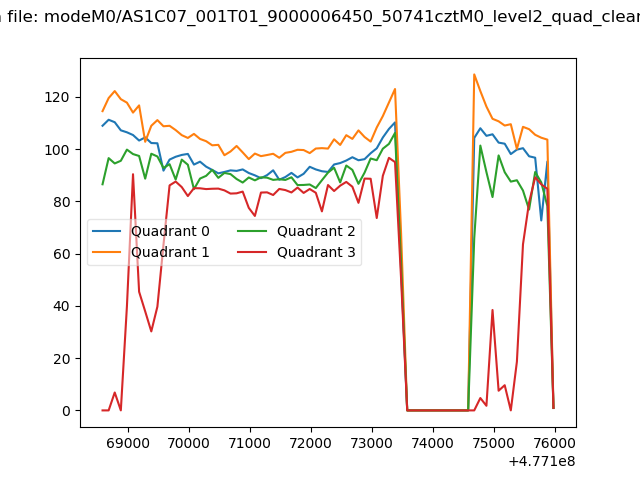 |
|
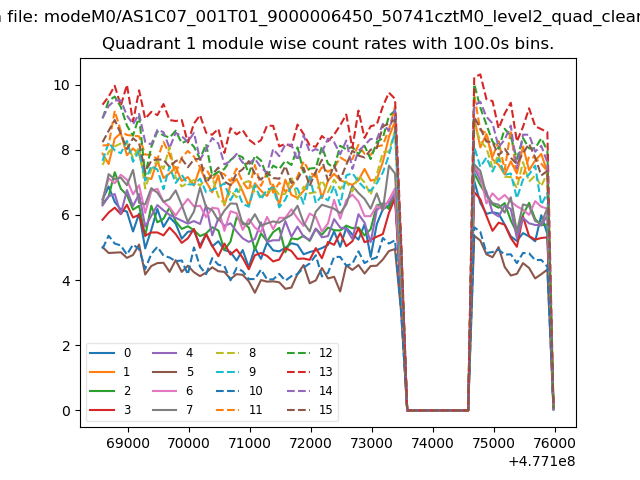
| Module-wise count rates for Quadrant A Data is divided into 100 sec bins |
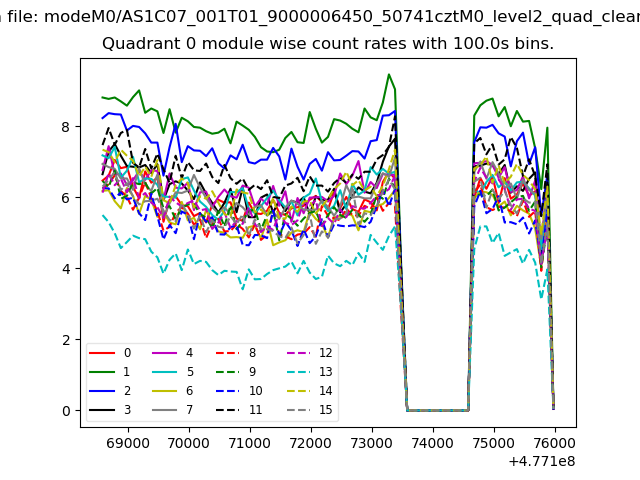 |
 |
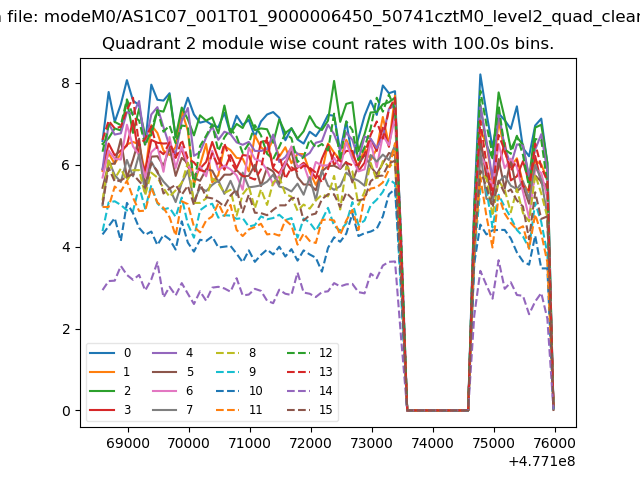
| Module-wise count rates for Quadrant B Data is divided into 100 sec bins |
 |
 |
| Module-wise count rates for Quadrant C Data is divided into 100 sec bins |
 |
 |
| Module-wise count rates for Quadrant D Data is divided into 100 sec bins |
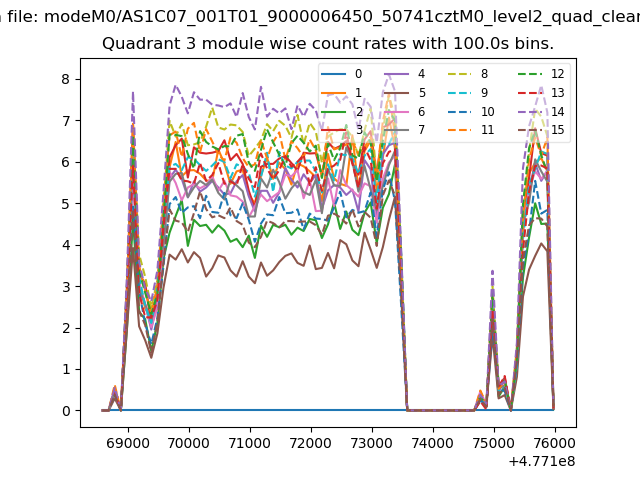 |
 |
| Parameter | Plot |
|---|---|
| CZT HV Monitor | 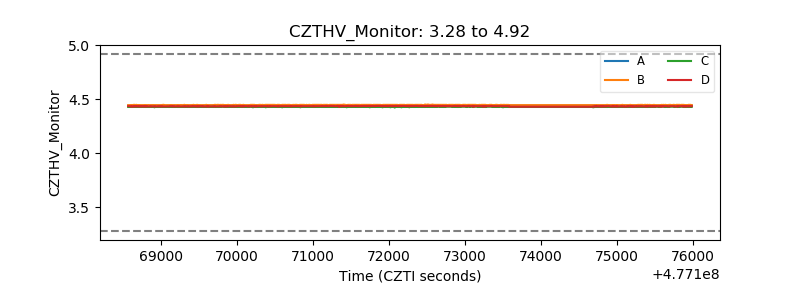 |
| D_VDD | 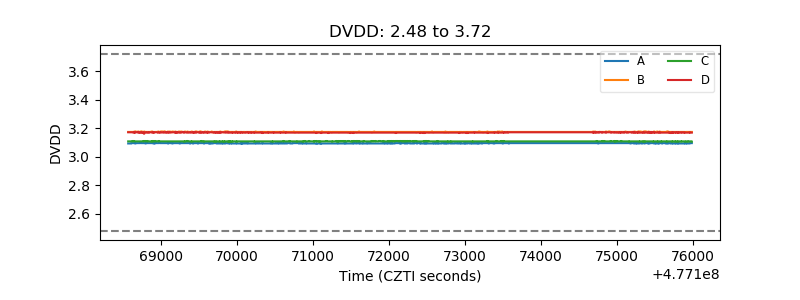 |
| Temperature 1 | 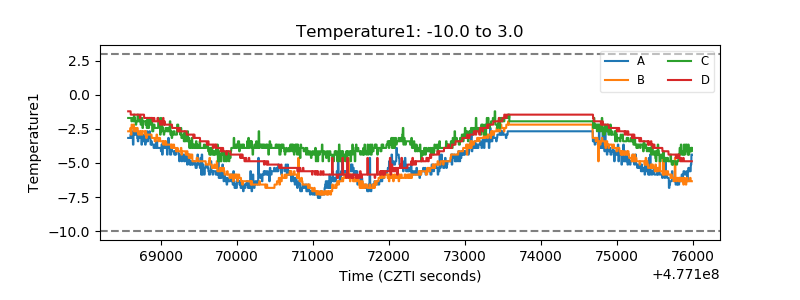 |
| Veto HV Monitor | 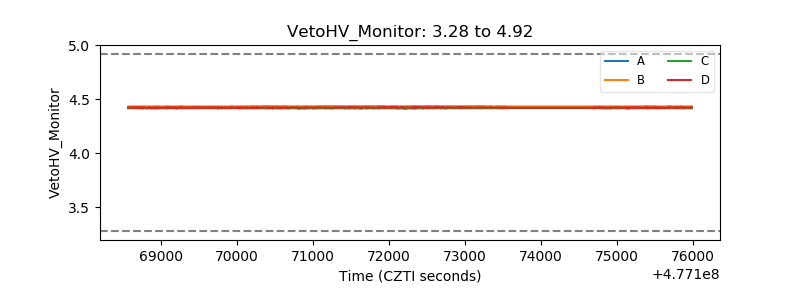 |
| Veto LLD | 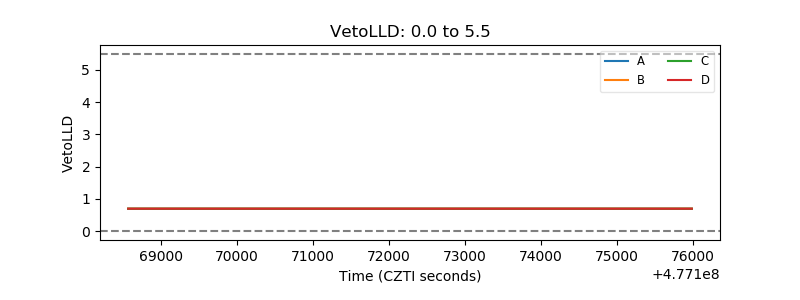 |
| Alpha Counter | 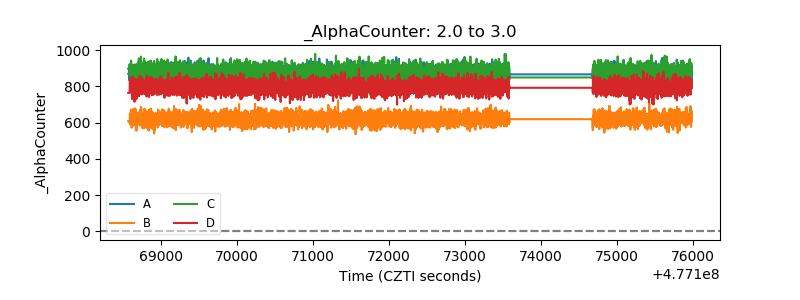 |
| _CPM_Rate | 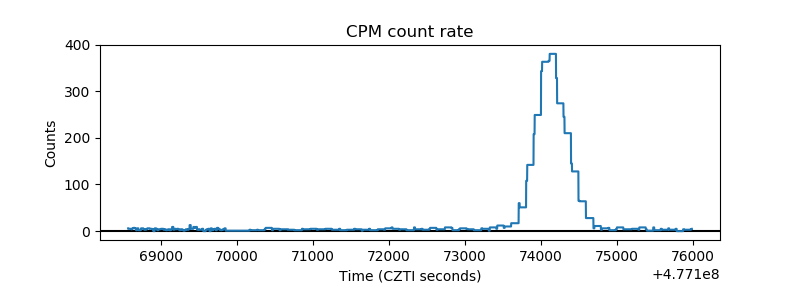 |
| CZT Counter | 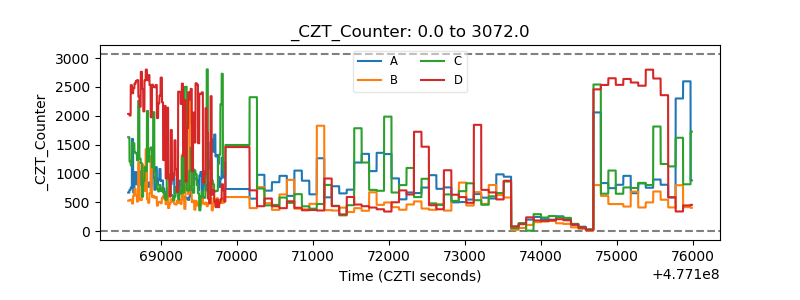 |
| +2.5 Volts monitor | 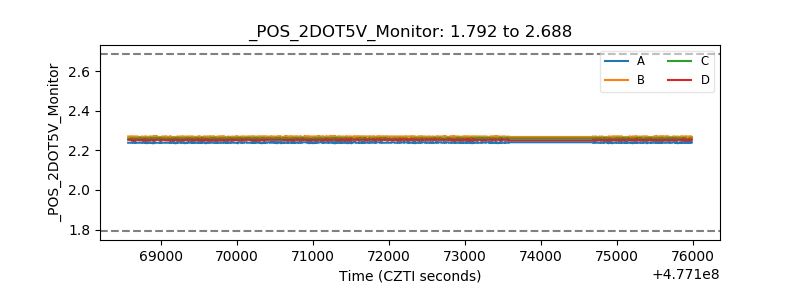 |
| +5 Volts monitor | 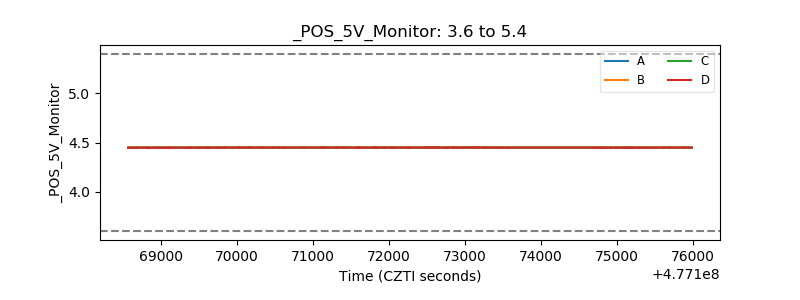 |
| _ROLL_ROT | 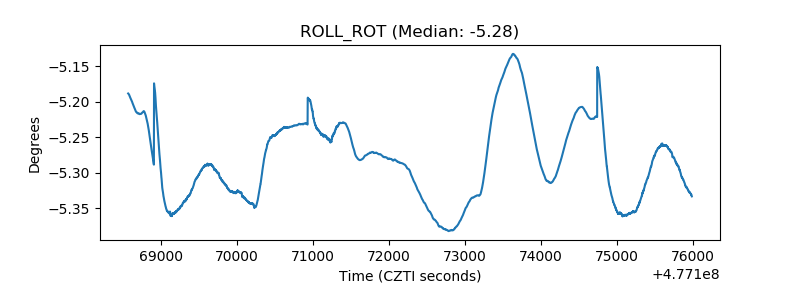 |
| _Roll_DEC | 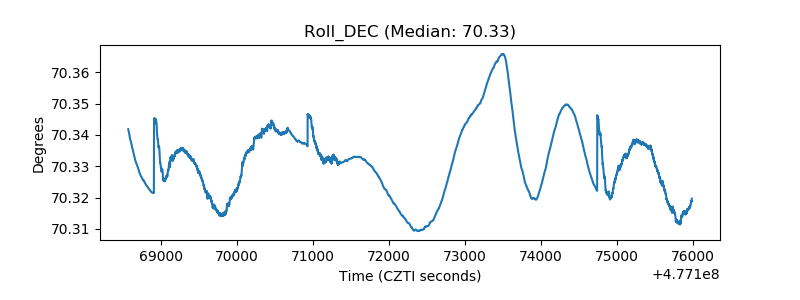 |
| _Roll_RA | 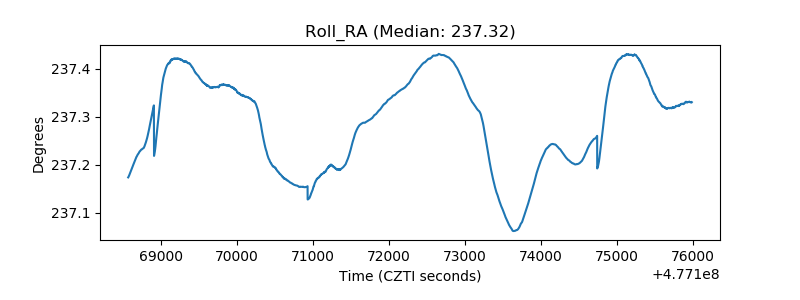 |
| Veto Counter | 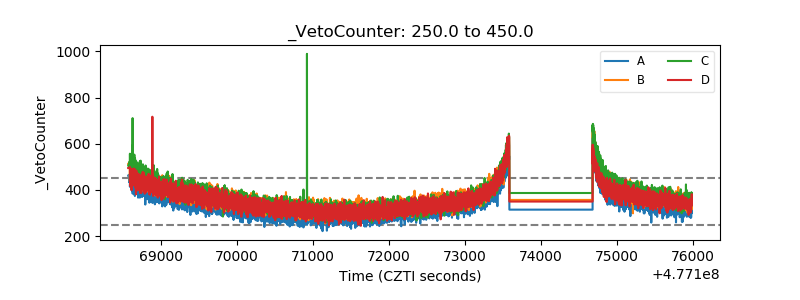 |