| Param | Original file | Final file |
|---|---|---|
| Filename | modeM0/AS1C07_001T01_9000006450_50742cztM0_level2.fits | modeM0/AS1C07_001T01_9000006450_50742cztM0_level2_quad_clean.evt |
| Size (bytes) | 786,798,720 | 87,698,880 |
| Size | 750.3 MB | 83.6 MB |
| Events in quadrant A | 9,156,997 | 514,525 |
| Events in quadrant B | 3,598,063 | 698,188 |
| Events in quadrant C | 7,187,956 | 556,199 |
| Events in quadrant D | 8,661,704 | 416,919 |
| Mode SS | |||
|---|---|---|---|
| Quadrant | BADHDUFLAG | Total packets | Discarded packets |
| A | 0 | 138 | 0 |
| B | 0 | 138 | 0 |
| C | 0 | 138 | 0 |
| D | 0 | 138 | 0 |
| Mode M0 | |||
|---|---|---|---|
| Quadrant | BADHDUFLAG | Total packets | Discarded packets |
| A | 0 | 31994 | 86 |
| B | 0 | 15549 | 52 |
| C | 0 | 26251 | 138 |
| D | 0 | 30547 | 158 |
| Mode M9 | |||
|---|---|---|---|
| Quadrant | BADHDUFLAG | Total packets | Discarded packets |
| A | 0 | 10 | 1 |
| B | 0 | 10 | 0 |
| C | 0 | 10 | 0 |
| D | 0 | 10 | 0 |
| Quadrant | Total seconds | Saturated seconds | Saturation percentage |
|---|---|---|---|
| A | 6728 | 1633 | 24.271700% |
| B | 6730 | 134 | 1.991085% |
| C | 6723 | 924 | 13.743864% |
| D | 6722 | 2072 | 30.824159% |
Noise dominated data is calculated using 1-second bins in cleaned event files. If a bin has >2000 counts, and if more than 50% of those come from <1% of pixels, then it is considered to be noise-dominated and hence unusable.
| Quadrant | # 1 sec bins | Bins with >0 counts | Bins with >2000 counts | High rate bins dominated by noise | Noise dominated (total time) | Noise dominated (detector-on time) | Marked lightcurve |
|---|---|---|---|---|---|---|---|
| A | 7669 | 6733 | 1649 | 1649 | 21.50% | 24.49% |  |
| B | 7677 | 6737 | 51 | 51 | 0.66% | 0.76% |  |
| C | 7677 | 6724 | 772 | 772 | 10.06% | 11.48% | 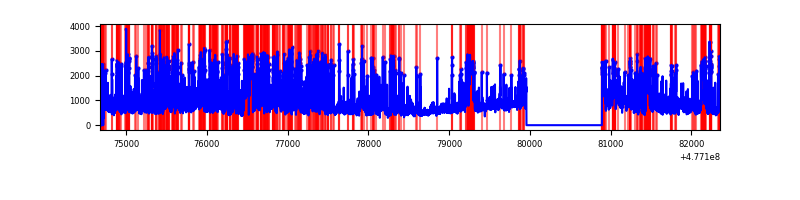 |
| D | 7677 | 6723 | 2025 | 2025 | 26.38% | 30.12% | 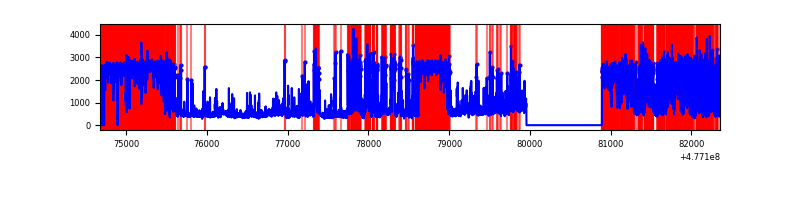 |
Top three noisy pixels from each quadrant. If the there are fewer than three noisy pixels in the level2.evt file, extra rows are filled as -1
| Pixel properties | Quadrant properties | ||||||
|---|---|---|---|---|---|---|---|
| Quadrant | DetID | PixID | Counts | Sigma | Mean | Median | Sigma |
| A | 4 | 4 | 5797035 | 34781.07 | 665 | 648 | 166.7 |
| A | 4 | 3 | 176718 | 1056.5 | 665 | 648 | 166.7 |
| A | 8 | 38 | 118304 | 705.99 | 665 | 648 | 166.7 |
| B | 7 | 0 | 186238 | 1222.53 | 712 | 686 | 151.8 |
| B | 10 | 247 | 80567 | 526.3 | 712 | 686 | 151.8 |
| B | 8 | 128 | 67610 | 440.94 | 712 | 686 | 151.8 |
| C | 9 | 38 | 1875752 | 10042.65 | 666 | 658 | 186.7 |
| C | 15 | 231 | 890145 | 4763.92 | 666 | 658 | 186.7 |
| C | 12 | 247 | 570804 | 3053.59 | 666 | 658 | 186.7 |
| D | 1 | 47 | 1838497 | 11148.13 | 579 | 556 | 164.9 |
| D | 2 | 216 | 1338850 | 8117.5 | 579 | 556 | 164.9 |
| D | 15 | 174 | 1318923 | 7996.63 | 579 | 556 | 164.9 |
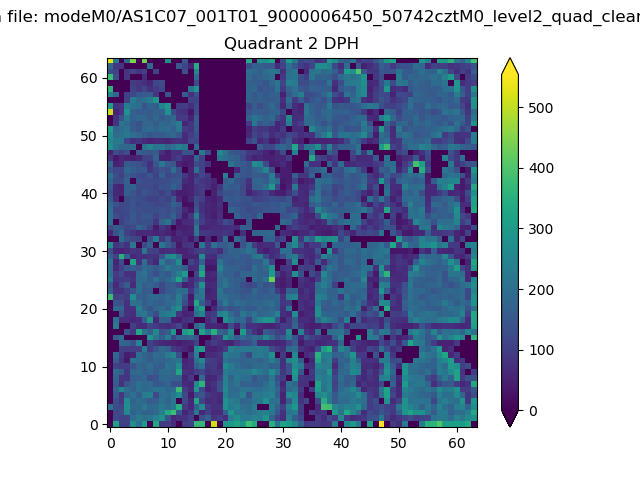
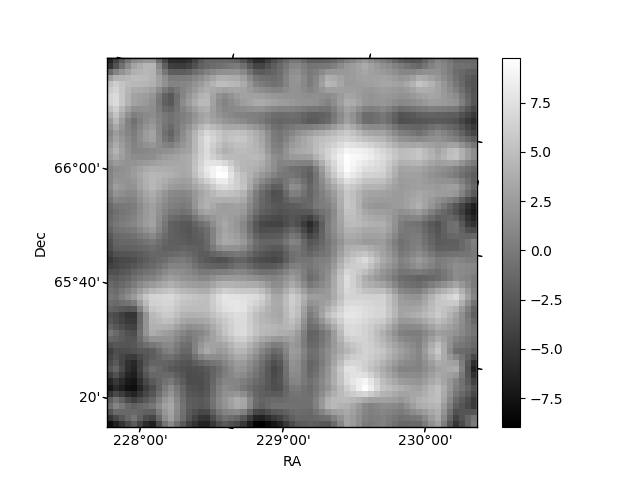
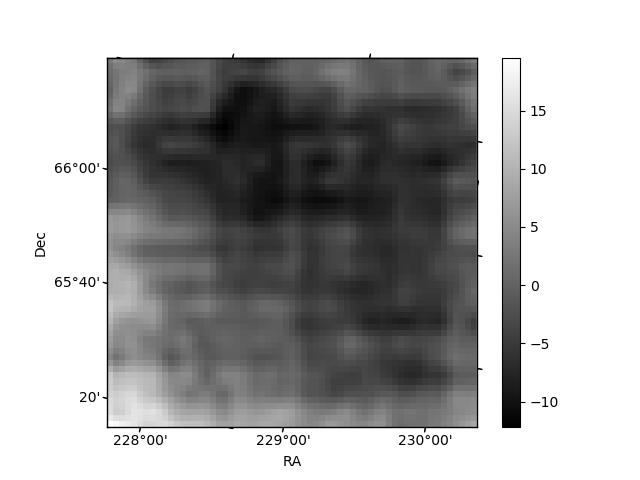
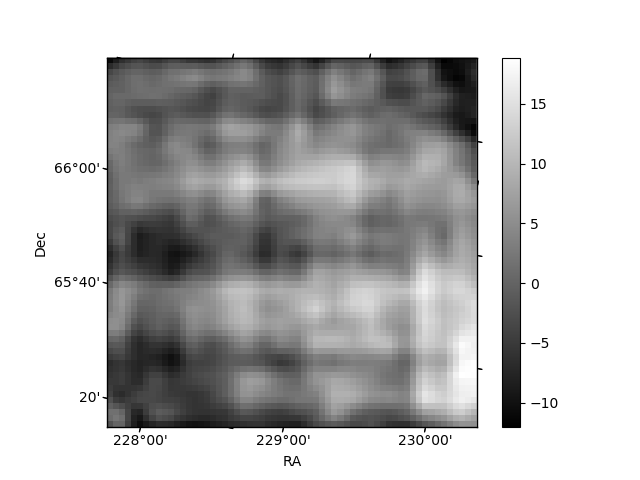
Histogram calculated using DETX and DETY for each event in the final _common_clean file
| Quadrant A | 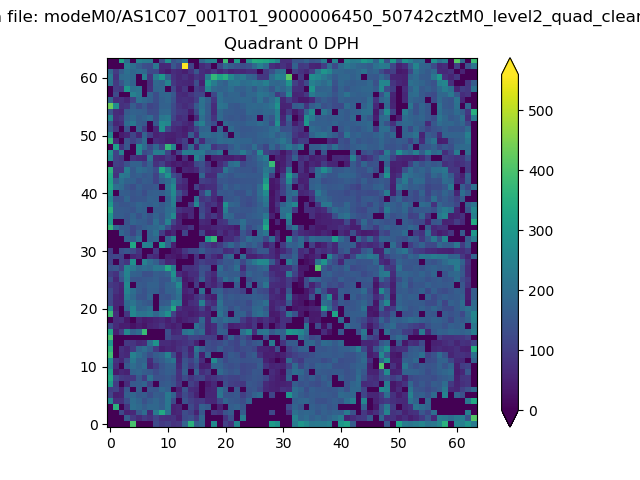 |
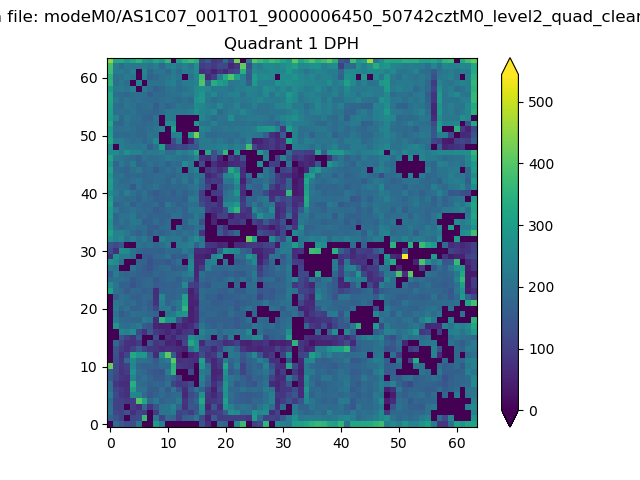 |
Quadrant B |
|---|---|---|---|
| Quadrant D | 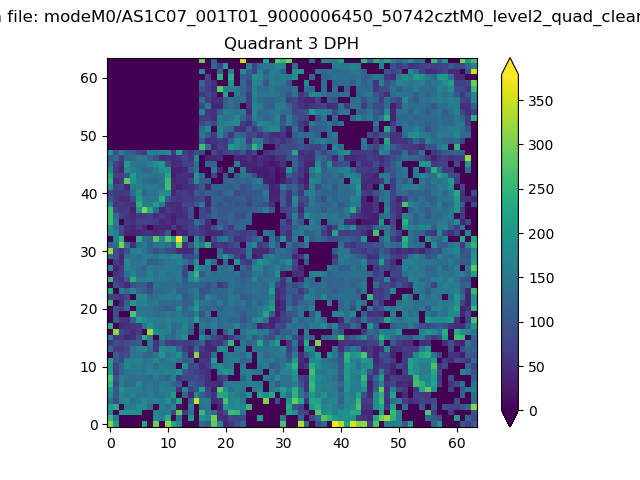 |
 |
Quadrant C |
| Plot type | Count rate plots | Images |
|---|---|---|
| Comparison with Poisson distribution Blue bars denote a histogram of data divided into 1 sec bins. Red curve is a Poisson curve with rate = median count rate of data. |
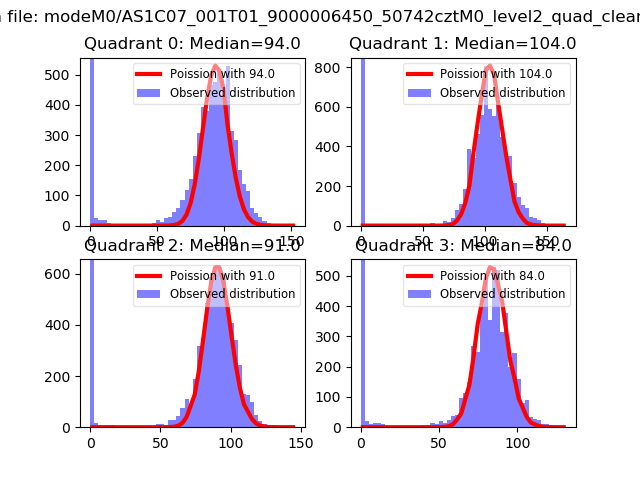 |
 |
| Quadrant-wise count rates Data is divided into 100 sec bins |
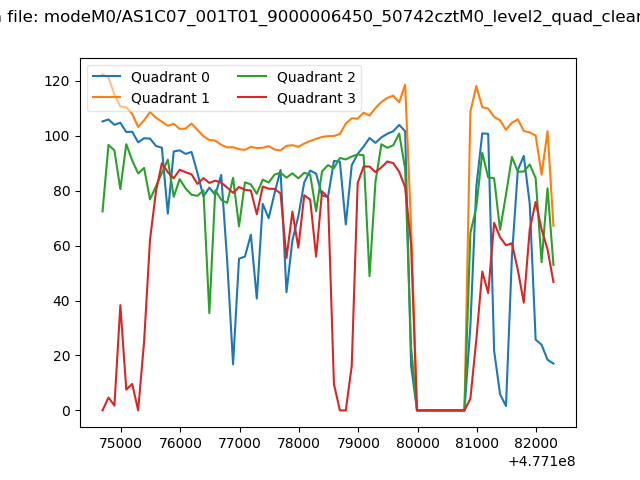 |
|
| Module-wise count rates for Quadrant A Data is divided into 100 sec bins |
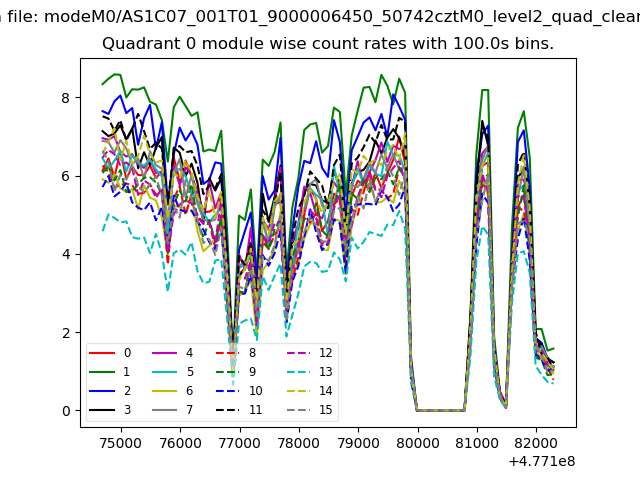 |
 |
| Module-wise count rates for Quadrant B Data is divided into 100 sec bins |
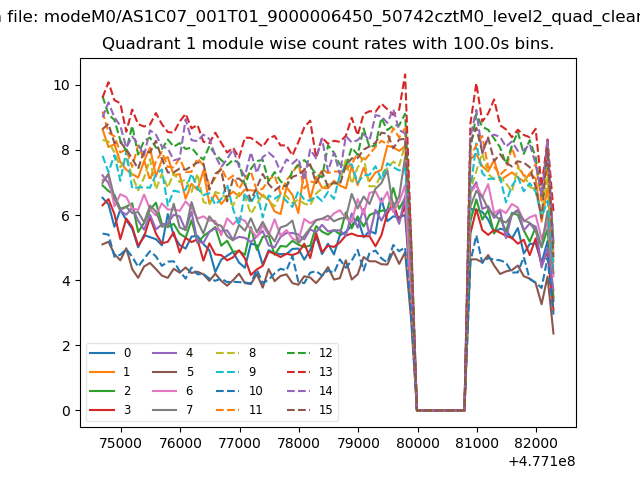 |
 |
| Module-wise count rates for Quadrant C Data is divided into 100 sec bins |
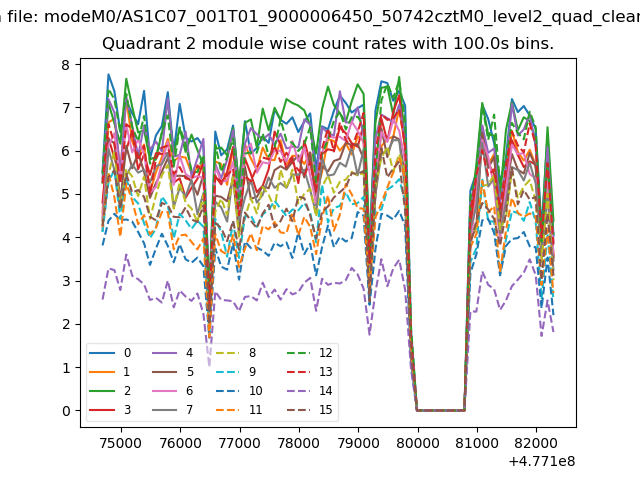 |
 |
| Module-wise count rates for Quadrant D Data is divided into 100 sec bins |
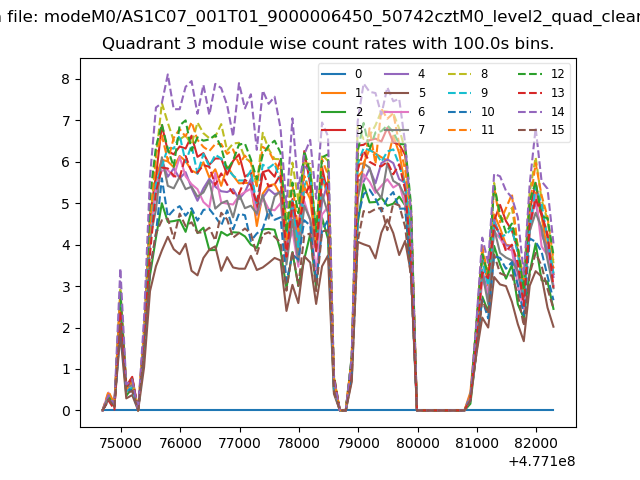 |
 |
| Parameter | Plot |
|---|---|
| CZT HV Monitor |  |
| D_VDD | 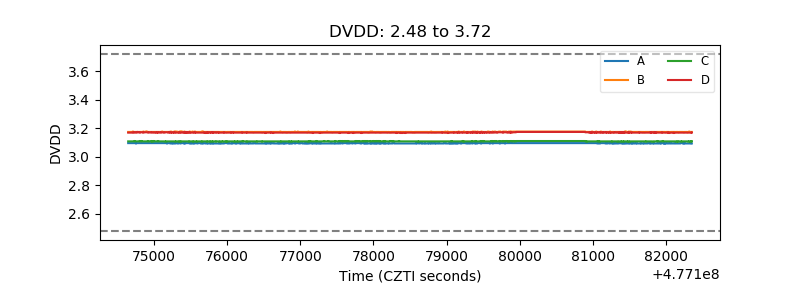 |
| Temperature 1 | 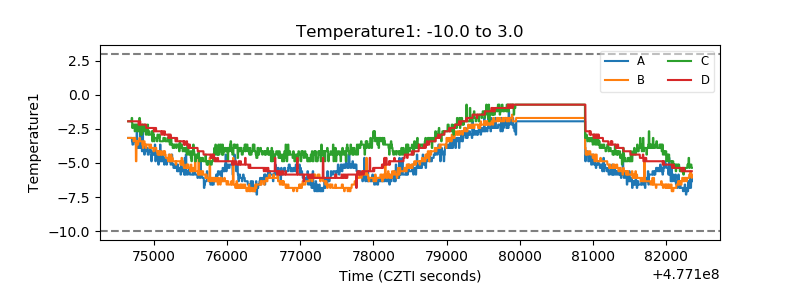 |
| Veto HV Monitor | 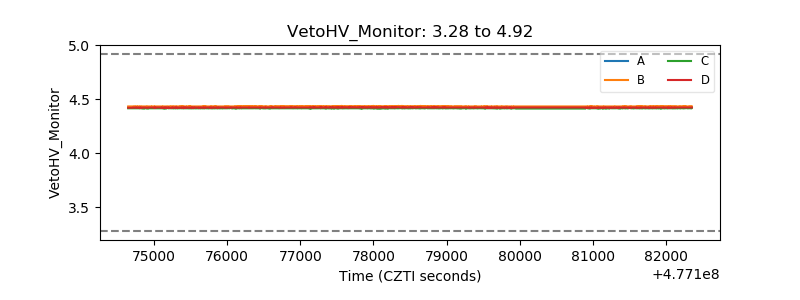 |
| Veto LLD | 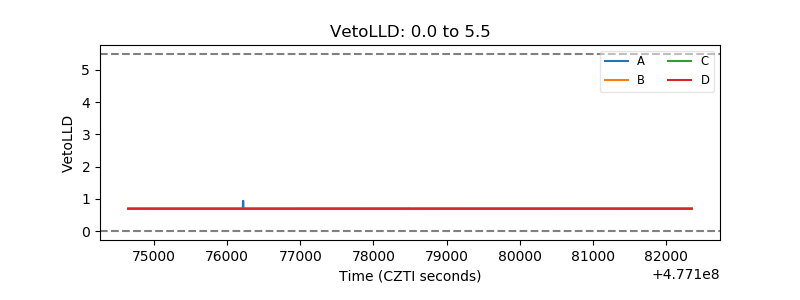 |
| Alpha Counter | 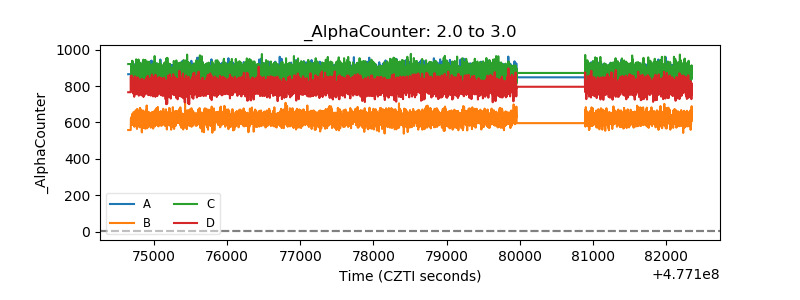 |
| _CPM_Rate | 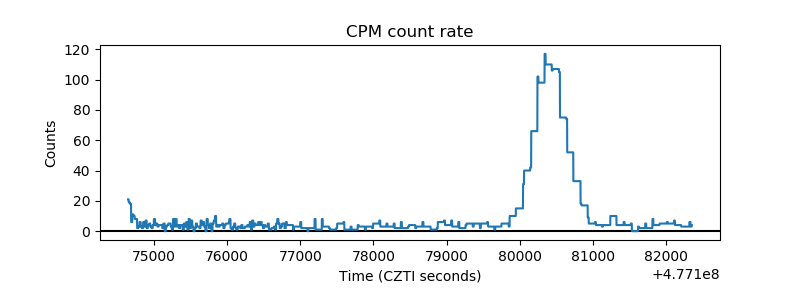 |
| CZT Counter | 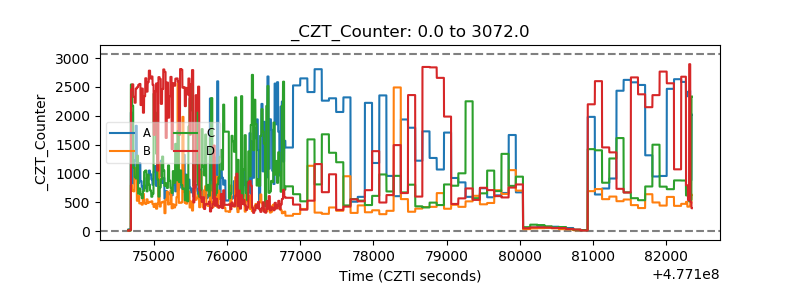 |
| +2.5 Volts monitor | 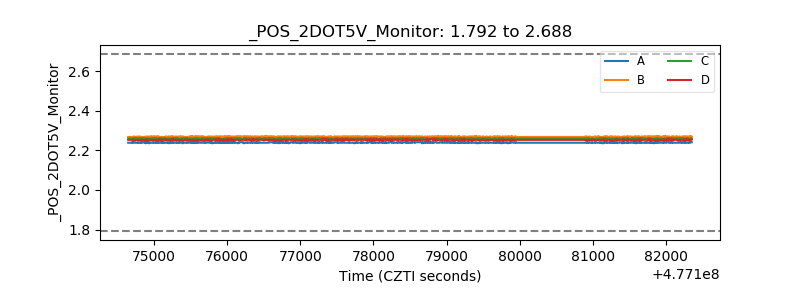 |
| +5 Volts monitor |  |
| _ROLL_ROT | 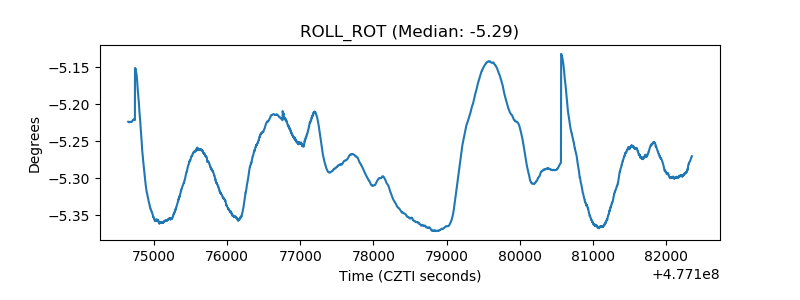 |
| _Roll_DEC | 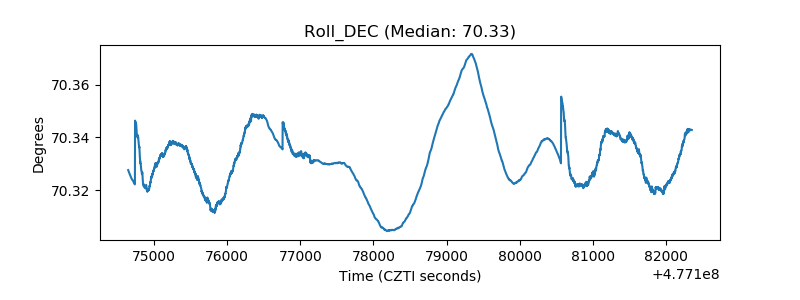 |
| _Roll_RA | 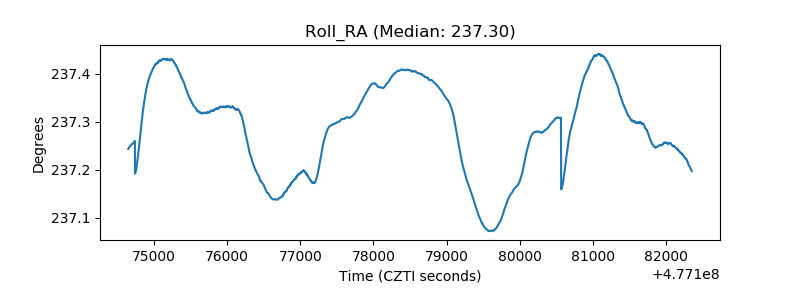 |
| Veto Counter | 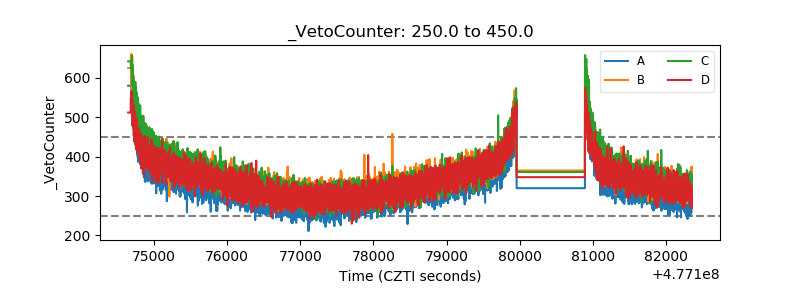 |