| Param | Original file | Final file |
|---|---|---|
| Filename | modeM0/AS1C07_001T01_9000006450_50743cztM0_level2.fits | modeM0/AS1C07_001T01_9000006450_50743cztM0_level2_quad_clean.evt |
| Size (bytes) | 806,126,400 | 94,299,840 |
| Size | 768.8 MB | 89.9 MB |
| Events in quadrant A | 8,972,069 | 538,640 |
| Events in quadrant B | 4,175,110 | 730,073 |
| Events in quadrant C | 6,823,353 | 601,080 |
| Events in quadrant D | 9,314,443 | 484,926 |
| Mode SS | |||
|---|---|---|---|
| Quadrant | BADHDUFLAG | Total packets | Discarded packets |
| A | 0 | 146 | 0 |
| B | 0 | 148 | 0 |
| C | 0 | 148 | 0 |
| D | 0 | 148 | 0 |
| Mode M0 | |||
|---|---|---|---|
| Quadrant | BADHDUFLAG | Total packets | Discarded packets |
| A | 0 | 31573 | 2 |
| B | 0 | 17642 | 2 |
| C | 0 | 25286 | 2 |
| D | 0 | 32614 | 8 |
| Mode M9 | |||
|---|---|---|---|
| Quadrant | BADHDUFLAG | Total packets | Discarded packets |
| A | 0 | 13 | 0 |
| B | 0 | 13 | 0 |
| C | 0 | 14 | 0 |
| D | 0 | 14 | 0 |
| Quadrant | Total seconds | Saturated seconds | Saturation percentage |
|---|---|---|---|
| A | 7183 | 1778 | 24.752889% |
| B | 7183 | 213 | 2.965335% |
| C | 7183 | 795 | 11.067799% |
| D | 7182 | 1767 | 24.603175% |
Noise dominated data is calculated using 1-second bins in cleaned event files. If a bin has >2000 counts, and if more than 50% of those come from <1% of pixels, then it is considered to be noise-dominated and hence unusable.
| Quadrant | # 1 sec bins | Bins with >0 counts | Bins with >2000 counts | High rate bins dominated by noise | Noise dominated (total time) | Noise dominated (detector-on time) | Marked lightcurve |
|---|---|---|---|---|---|---|---|
| A | 7743 | 7185 | 1807 | 1807 | 23.34% | 25.15% | 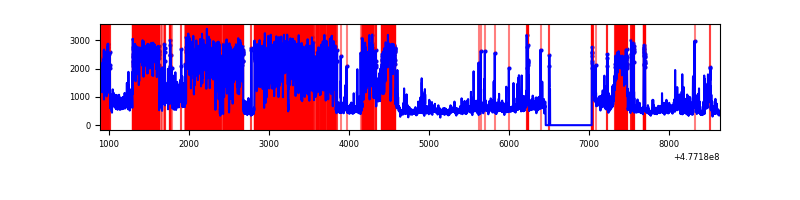 |
| B | 7743 | 7183 | 94 | 94 | 1.21% | 1.31% | 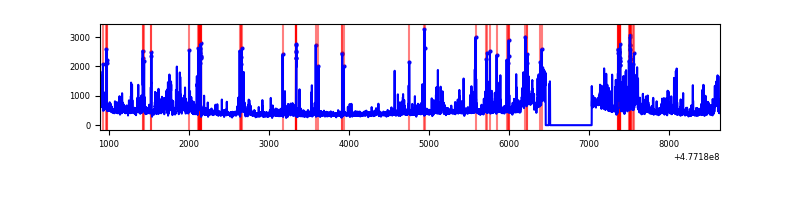 |
| C | 7743 | 7184 | 653 | 653 | 8.43% | 9.09% | 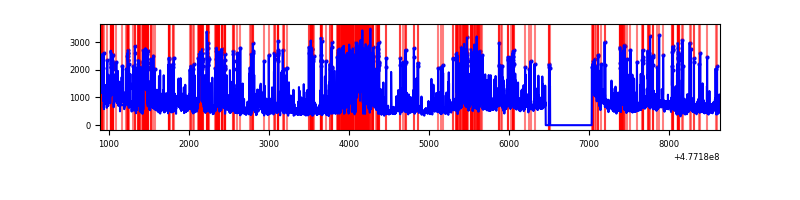 |
| D | 7743 | 7184 | 1766 | 1766 | 22.81% | 24.58% | 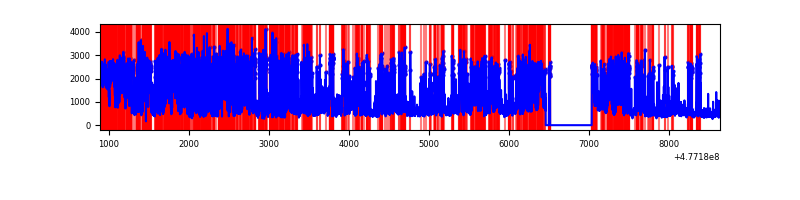 |
Top three noisy pixels from each quadrant. If the there are fewer than three noisy pixels in the level2.evt file, extra rows are filled as -1
| Pixel properties | Quadrant properties | ||||||
|---|---|---|---|---|---|---|---|
| Quadrant | DetID | PixID | Counts | Sigma | Mean | Median | Sigma |
| A | 4 | 4 | 5131342 | 28648.71 | 707 | 688 | 179.1 |
| A | 6 | 177 | 272386 | 1517.12 | 707 | 688 | 179.1 |
| A | 4 | 3 | 143451 | 797.16 | 707 | 688 | 179.1 |
| B | 7 | 0 | 370351 | 2302.63 | 756 | 727 | 160.5 |
| B | 5 | 172 | 189971 | 1178.92 | 756 | 727 | 160.5 |
| B | 10 | 247 | 139455 | 864.23 | 756 | 727 | 160.5 |
| C | 9 | 38 | 1082480 | 5441.04 | 717 | 709 | 198.8 |
| C | 15 | 231 | 818041 | 4110.98 | 717 | 709 | 198.8 |
| C | 12 | 247 | 607520 | 3052.11 | 717 | 709 | 198.8 |
| D | 8 | 176 | 2568640 | 13624.76 | 658 | 633 | 188.5 |
| D | 15 | 174 | 1671025 | 8862.39 | 658 | 633 | 188.5 |
| D | 2 | 249 | 715004 | 3790.15 | 658 | 633 | 188.5 |
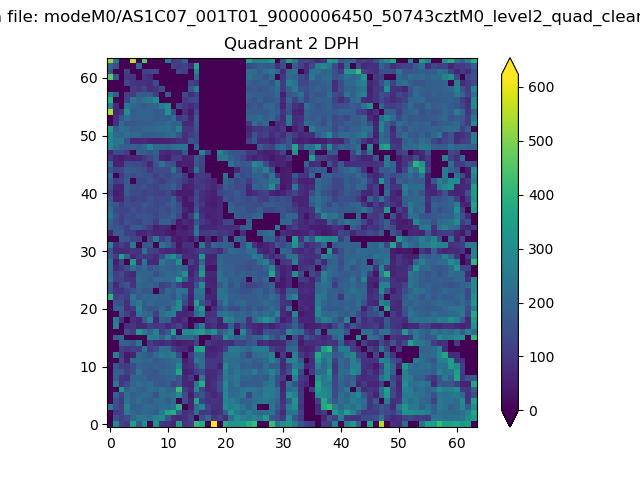
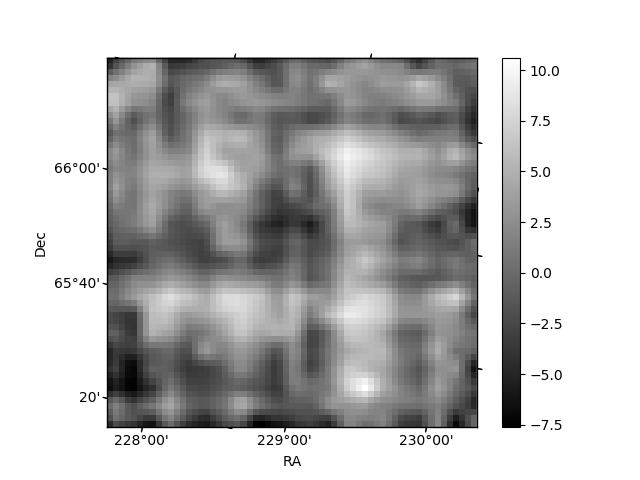
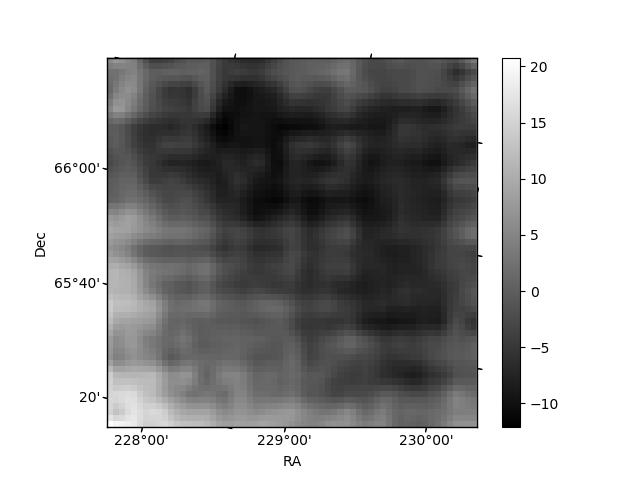
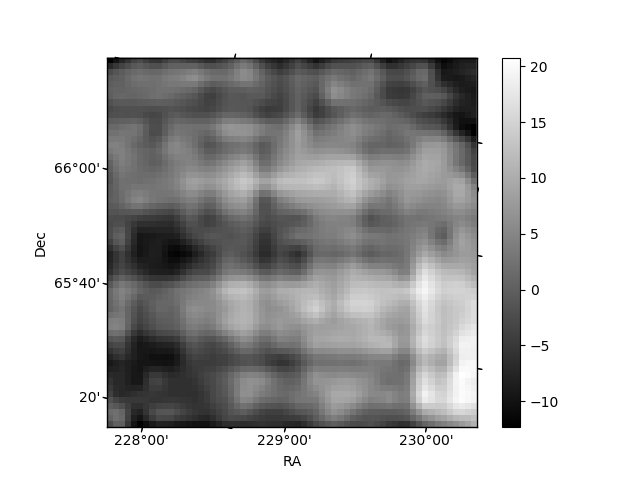
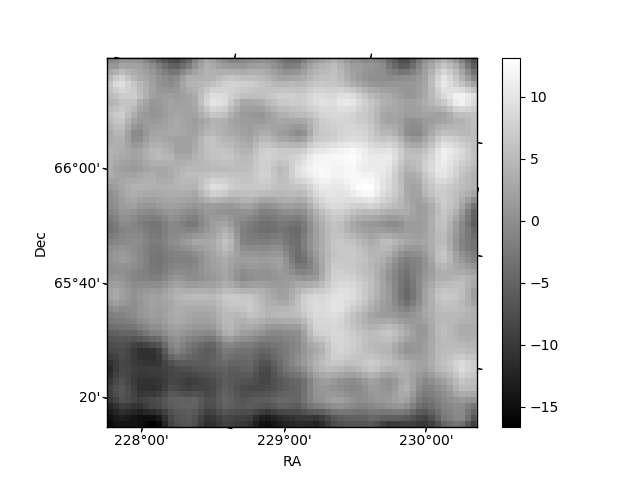
Histogram calculated using DETX and DETY for each event in the final _common_clean file
| Quadrant A | 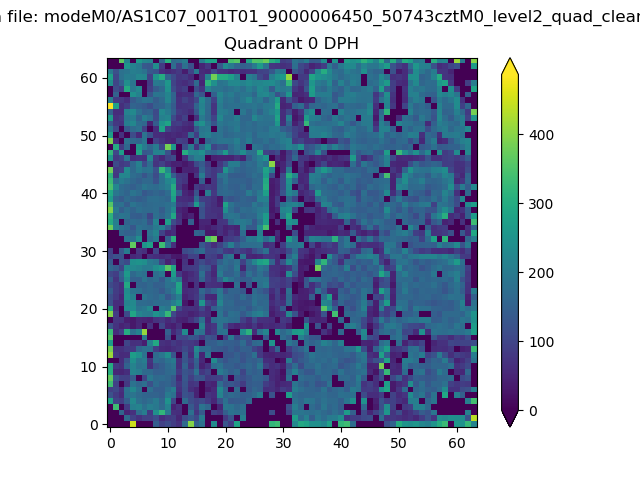 |
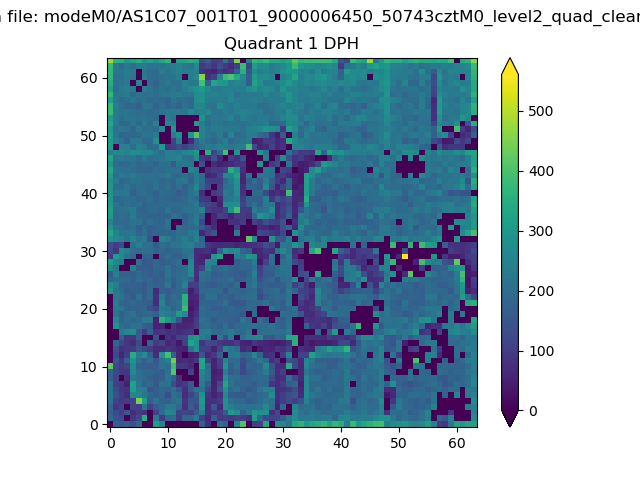 |
Quadrant B |
|---|---|---|---|
| Quadrant D | 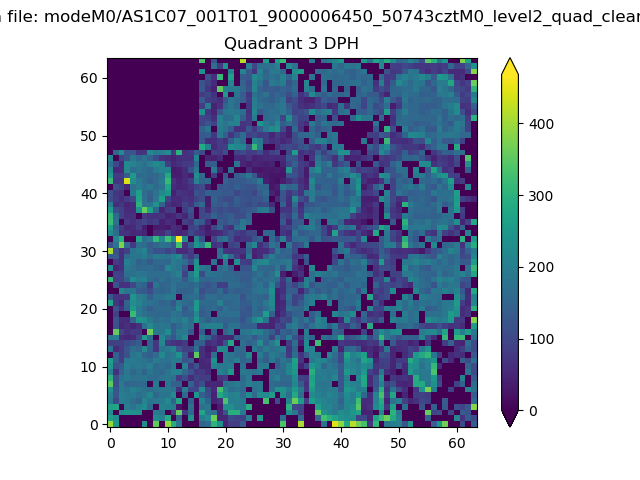 |
 |
Quadrant C |
| Plot type | Count rate plots | Images |
|---|---|---|
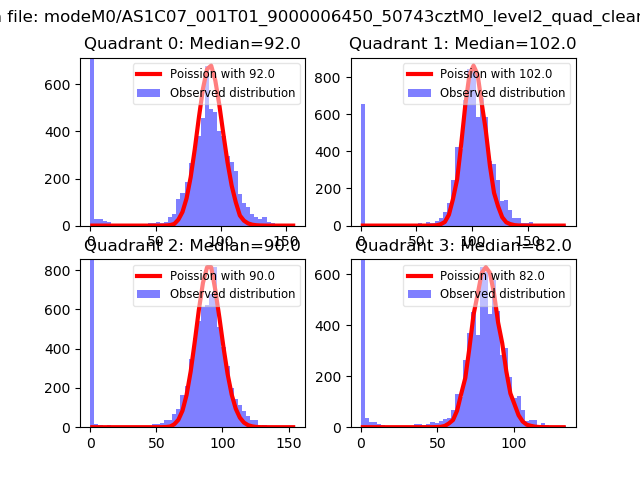
| Comparison with Poisson distribution Blue bars denote a histogram of data divided into 1 sec bins. Red curve is a Poisson curve with rate = median count rate of data. |
 |
 |
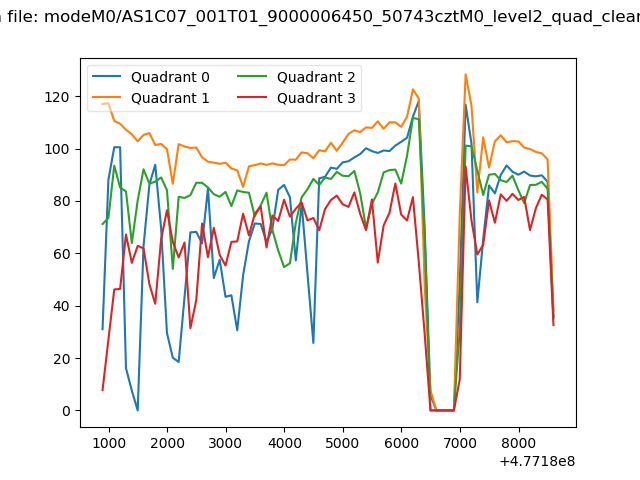
| Quadrant-wise count rates Data is divided into 100 sec bins |
 |
|
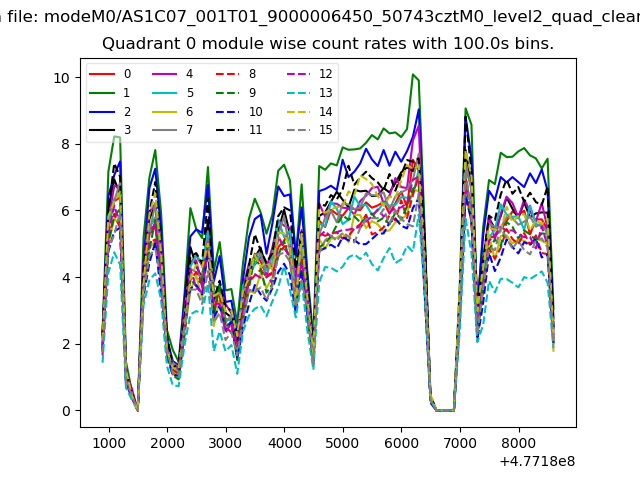
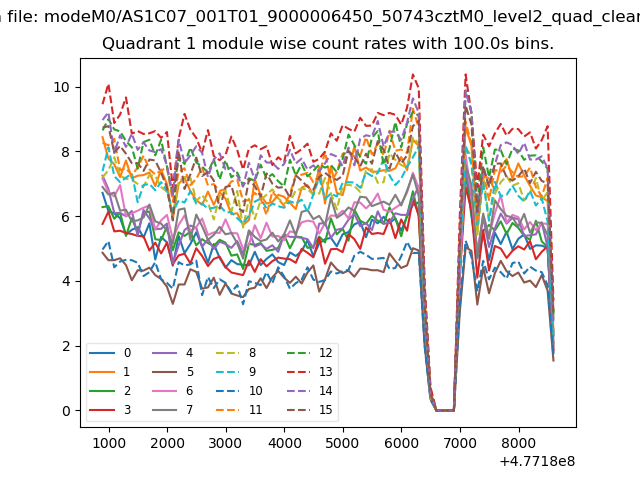
| Module-wise count rates for Quadrant A Data is divided into 100 sec bins |
 |
 |
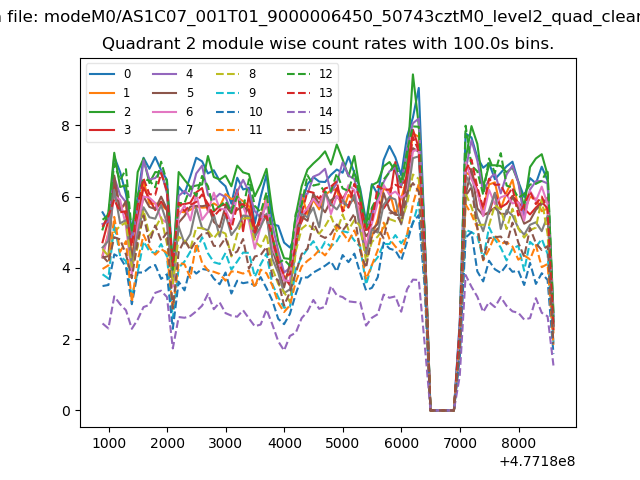
| Module-wise count rates for Quadrant B Data is divided into 100 sec bins |
 |
 |
| Module-wise count rates for Quadrant C Data is divided into 100 sec bins |
 |
 |
| Module-wise count rates for Quadrant D Data is divided into 100 sec bins |
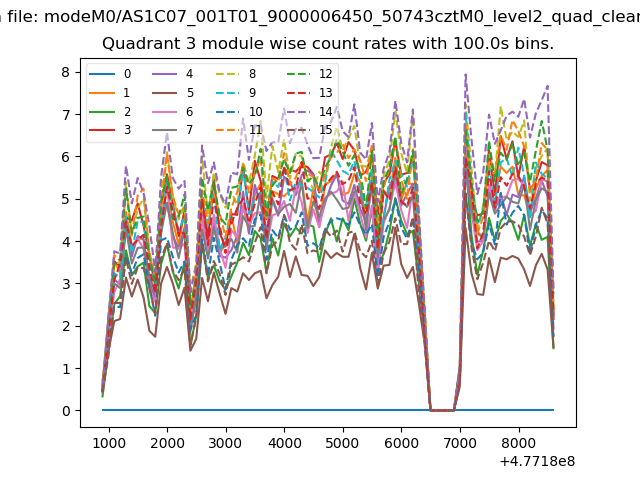 |
 |
| Parameter | Plot |
|---|---|
| CZT HV Monitor | 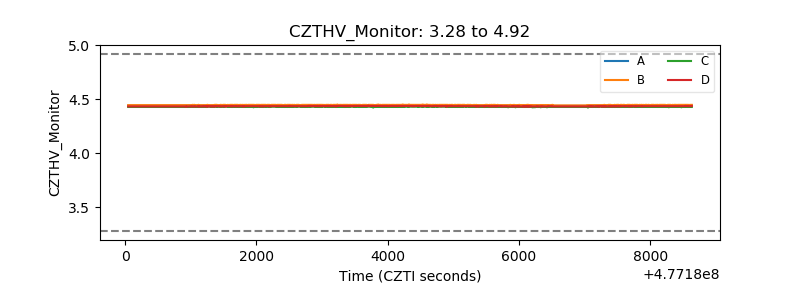 |
| D_VDD | 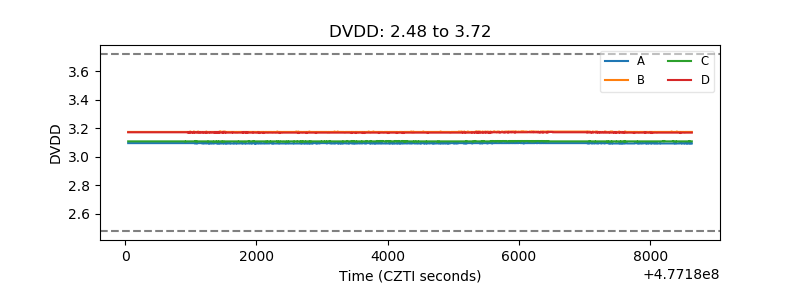 |
| Temperature 1 | 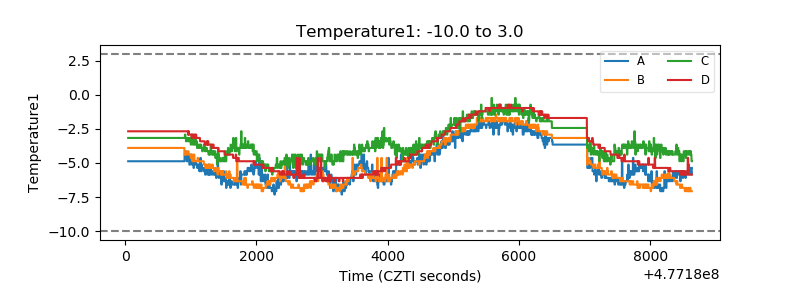 |
| Veto HV Monitor | 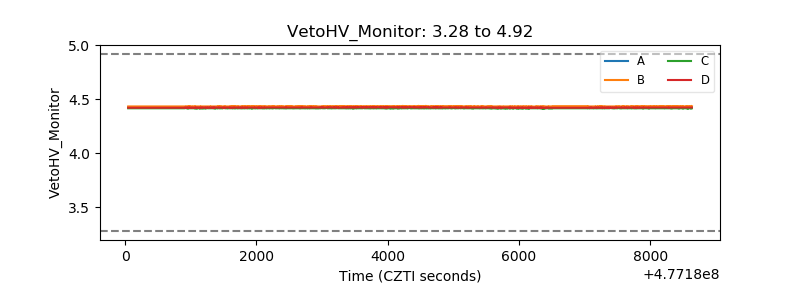 |
| Veto LLD | 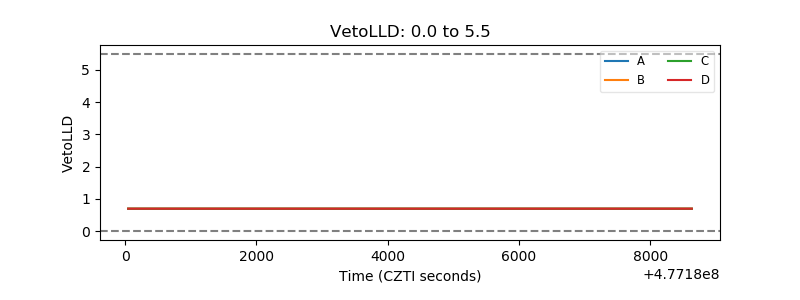 |
| Alpha Counter | 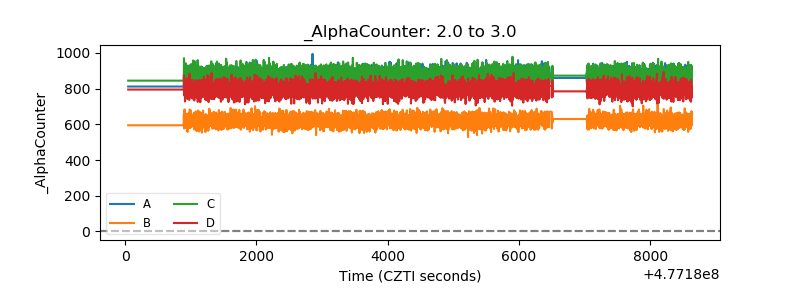 |
| _CPM_Rate | 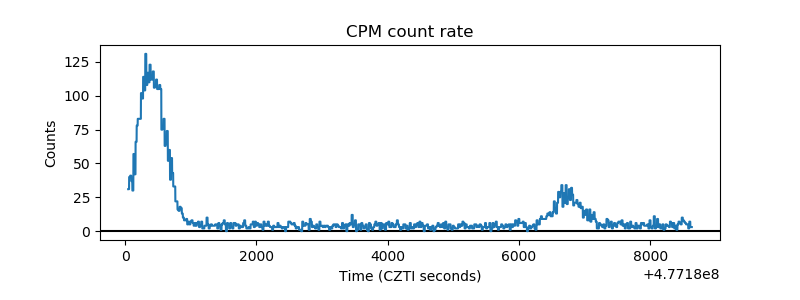 |
| CZT Counter | 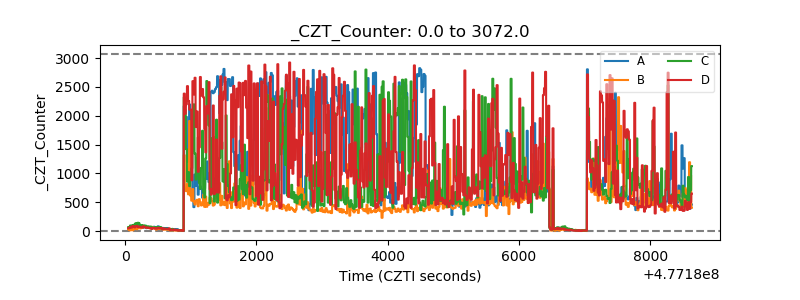 |
| +2.5 Volts monitor | 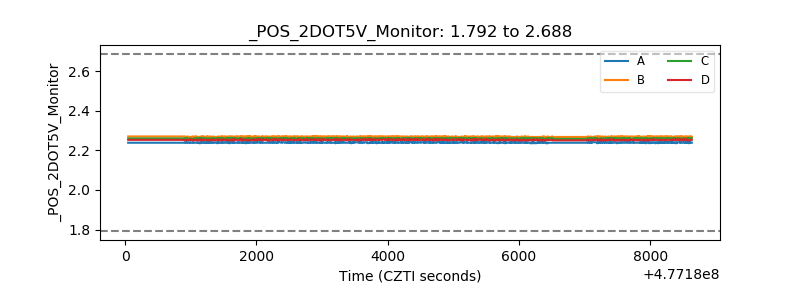 |
| +5 Volts monitor | 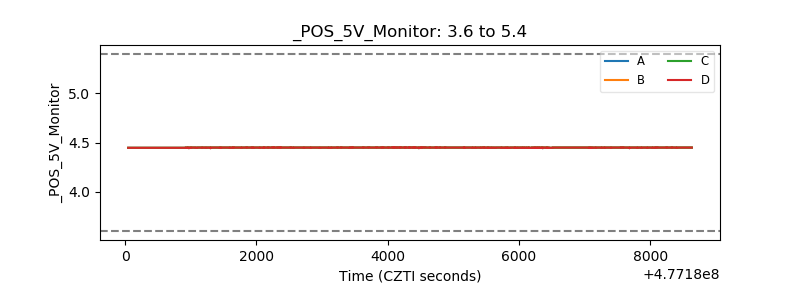 |
| _ROLL_ROT | 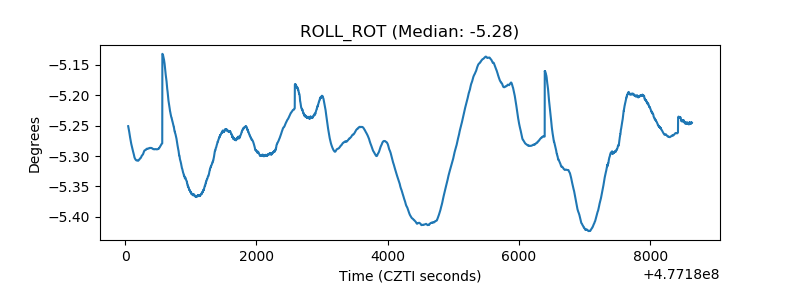 |
| _Roll_DEC | 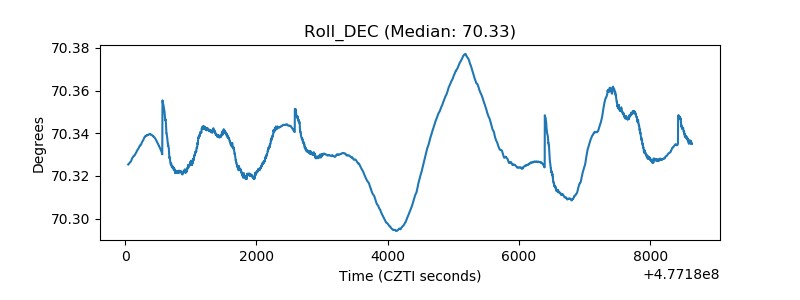 |
| _Roll_RA | 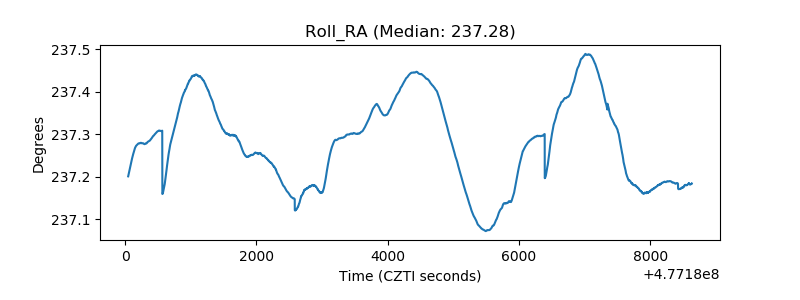 |
| Veto Counter | 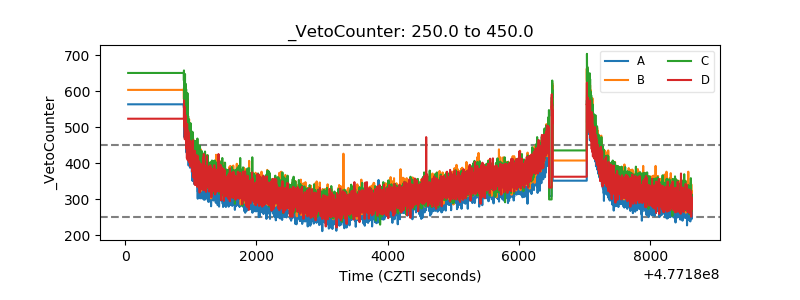 |