| Param | Original file | Final file |
|---|---|---|
| Filename | modeM0/AS1C07_001T01_9000006450_50744cztM0_level2.fits | modeM0/AS1C07_001T01_9000006450_50744cztM0_level2_quad_clean.evt |
| Size (bytes) | 702,031,680 | 116,038,080 |
| Size | 669.5 MB | 110.7 MB |
| Events in quadrant A | 6,084,333 | 748,657 |
| Events in quadrant B | 5,564,038 | 826,217 |
| Events in quadrant C | 5,966,807 | 732,314 |
| Events in quadrant D | 7,736,901 | 635,590 |
| Mode SS | |||
|---|---|---|---|
| Quadrant | BADHDUFLAG | Total packets | Discarded packets |
| A | 0 | 168 | 0 |
| B | 0 | 168 | 0 |
| C | 0 | 168 | 0 |
| D | 0 | 168 | 0 |
| Mode M0 | |||
|---|---|---|---|
| Quadrant | BADHDUFLAG | Total packets | Discarded packets |
| A | 0 | 23860 | 81 |
| B | 0 | 22412 | 136 |
| C | 0 | 23496 | 104 |
| D | 0 | 29082 | 215 |
| Mode M9 | |||
|---|---|---|---|
| Quadrant | BADHDUFLAG | Total packets | Discarded packets |
| A | 0 | 5 | 0 |
| B | 0 | 5 | 0 |
| C | 0 | 5 | 0 |
| D | 0 | 5 | 0 |
| Quadrant | Total seconds | Saturated seconds | Saturation percentage |
|---|---|---|---|
| A | 8211 | 417 | 5.078553% |
| B | 8205 | 309 | 3.765996% |
| C | 8205 | 295 | 3.595369% |
| D | 8200 | 1000 | 12.195122% |
Noise dominated data is calculated using 1-second bins in cleaned event files. If a bin has >2000 counts, and if more than 50% of those come from <1% of pixels, then it is considered to be noise-dominated and hence unusable.
| Quadrant | # 1 sec bins | Bins with >0 counts | Bins with >2000 counts | High rate bins dominated by noise | Noise dominated (total time) | Noise dominated (detector-on time) | Marked lightcurve |
|---|---|---|---|---|---|---|---|
| A | 8793 | 8221 | 310 | 310 | 3.53% | 3.77% | 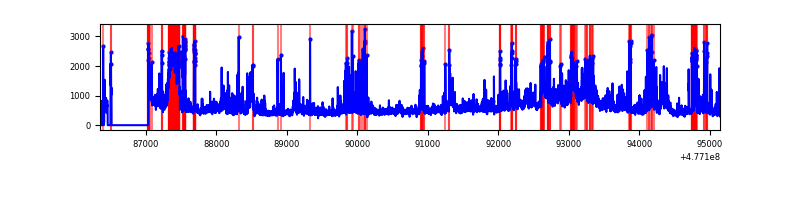 |
| B | 8796 | 8214 | 145 | 145 | 1.65% | 1.77% | 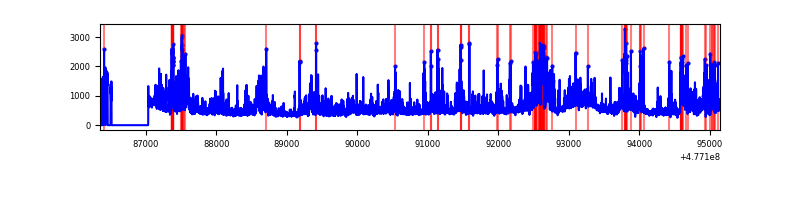 |
| C | 8795 | 8221 | 227 | 227 | 2.58% | 2.76% | 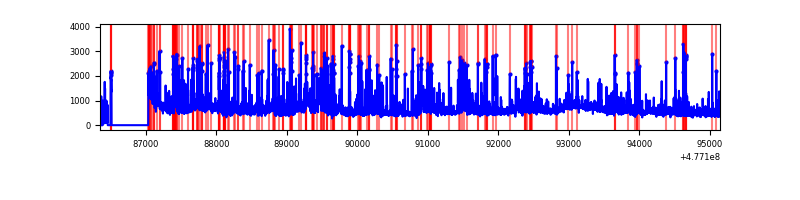 |
| D | 8788 | 8205 | 889 | 889 | 10.12% | 10.83% | 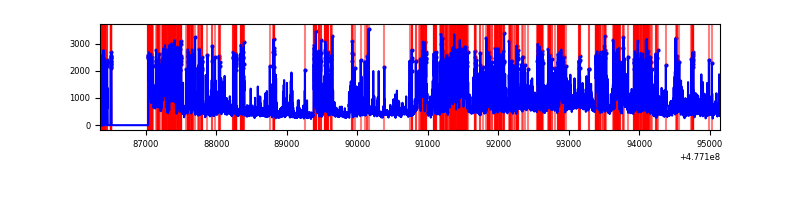 |
Top three noisy pixels from each quadrant. If the there are fewer than three noisy pixels in the level2.evt file, extra rows are filled as -1
| Pixel properties | Quadrant properties | ||||||
|---|---|---|---|---|---|---|---|
| Quadrant | DetID | PixID | Counts | Sigma | Mean | Median | Sigma |
| A | 4 | 4 | 495866 | 2261.92 | 872 | 850 | 218.8 |
| A | 6 | 177 | 278332 | 1267.92 | 872 | 850 | 218.8 |
| A | 3 | 161 | 254664 | 1159.78 | 872 | 850 | 218.8 |
| B | 7 | 0 | 881759 | 4723.15 | 877 | 844 | 186.5 |
| B | 10 | 247 | 540645 | 2894.22 | 877 | 844 | 186.5 |
| B | 5 | 172 | 138748 | 739.39 | 877 | 844 | 186.5 |
| C | 12 | 247 | 732950 | 3076.34 | 857 | 847 | 238.0 |
| C | 9 | 38 | 426150 | 1787.15 | 857 | 847 | 238.0 |
| C | 5 | 10 | 284383 | 1191.44 | 857 | 847 | 238.0 |
| D | 15 | 174 | 1480335 | 6391.84 | 811 | 780 | 231.5 |
| D | 2 | 216 | 778416 | 3359.47 | 811 | 780 | 231.5 |
| D | 2 | 249 | 520055 | 2243.33 | 811 | 780 | 231.5 |
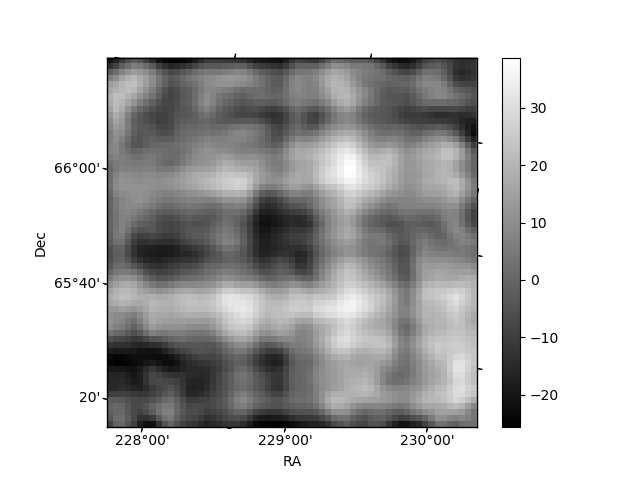
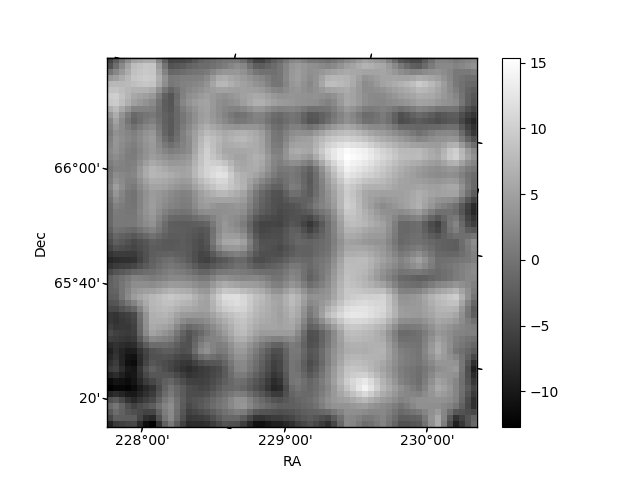
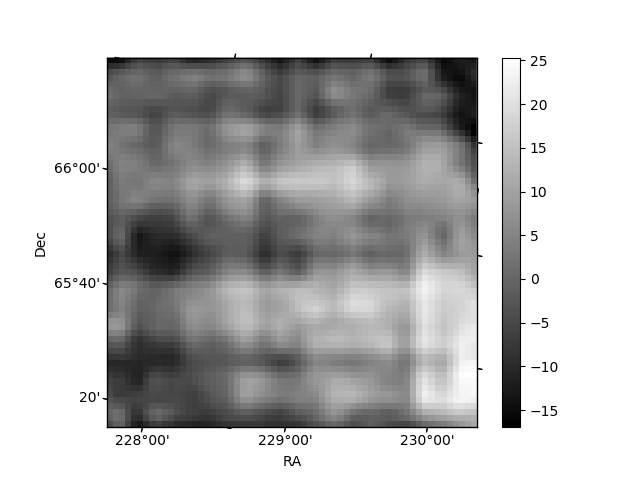
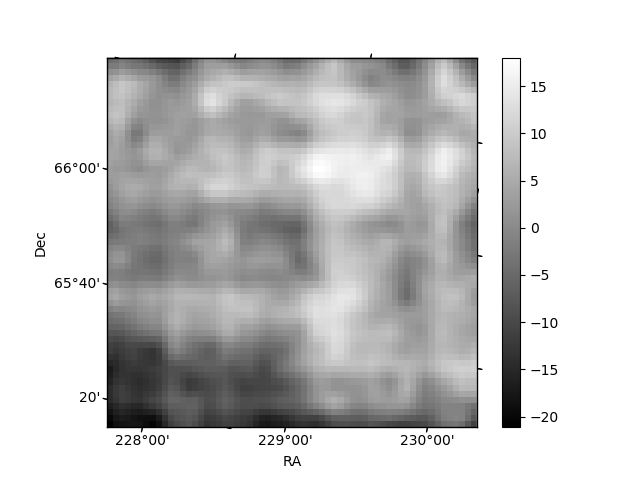
Histogram calculated using DETX and DETY for each event in the final _common_clean file
| Quadrant A | 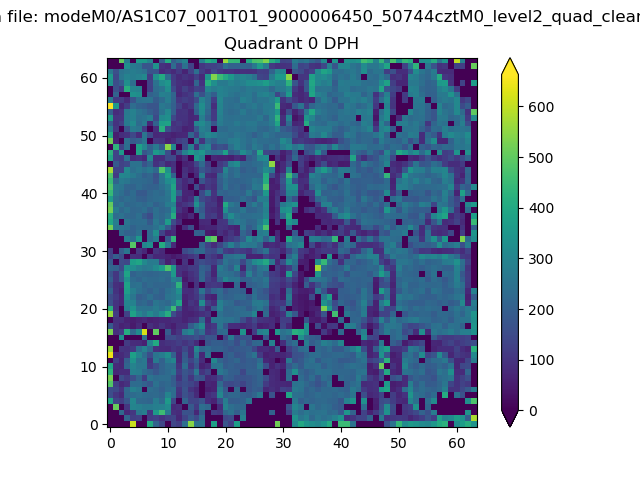 |
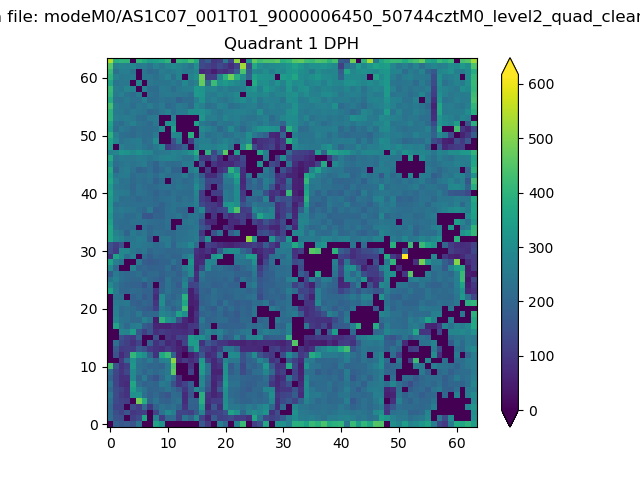 |
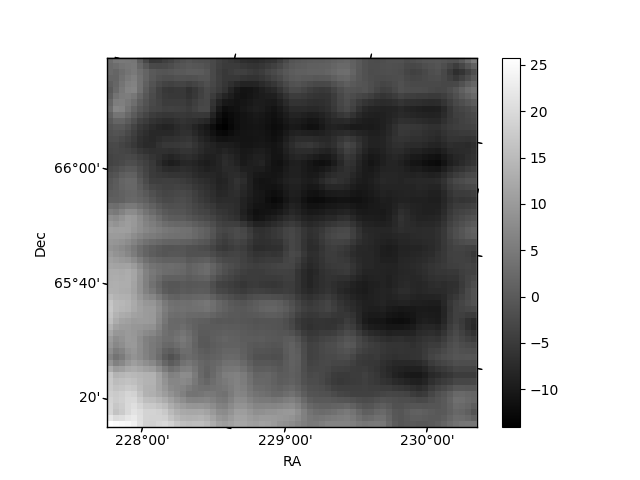
Quadrant B |
|---|---|---|---|
| Quadrant D | 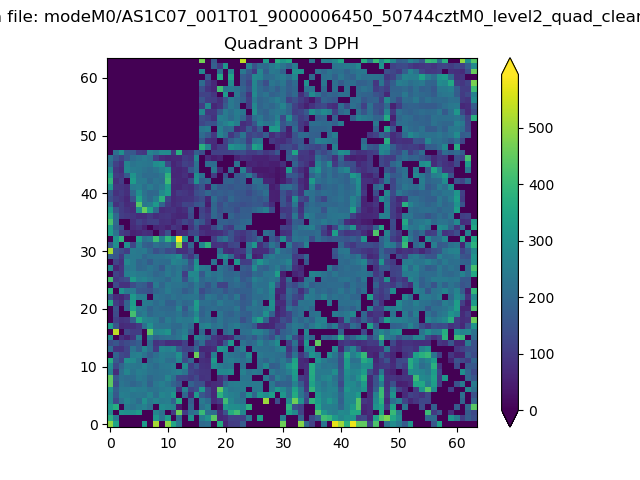 |
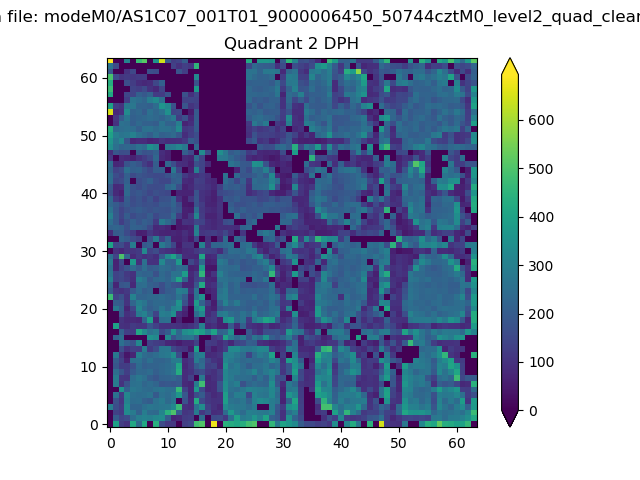 |
Quadrant C |
| Plot type | Count rate plots | Images |
|---|---|---|
| Comparison with Poisson distribution Blue bars denote a histogram of data divided into 1 sec bins. Red curve is a Poisson curve with rate = median count rate of data. |
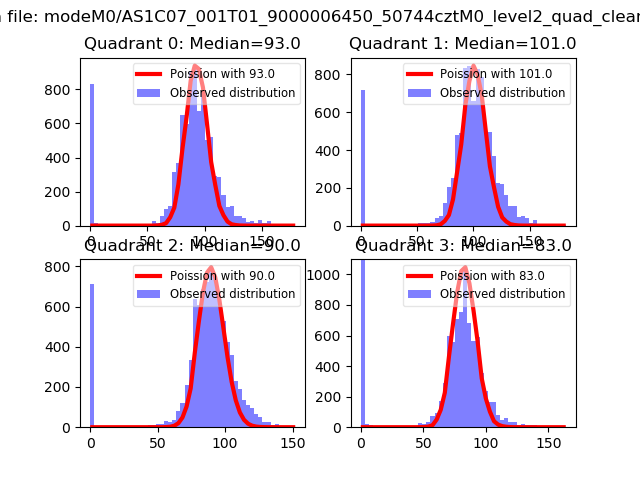 |
 |
| Quadrant-wise count rates Data is divided into 100 sec bins |
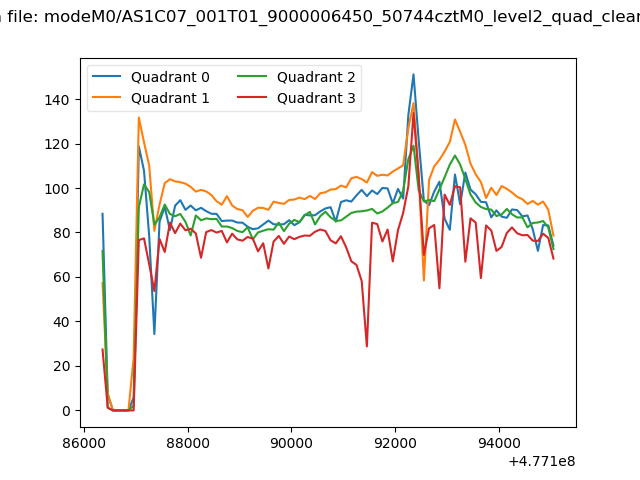 |
|
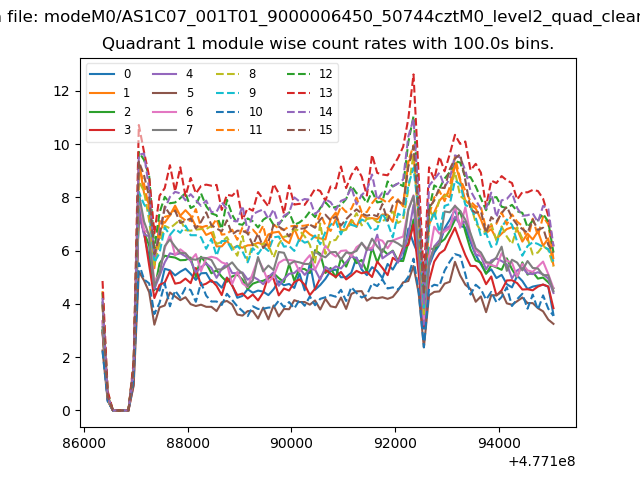
| Module-wise count rates for Quadrant A Data is divided into 100 sec bins |
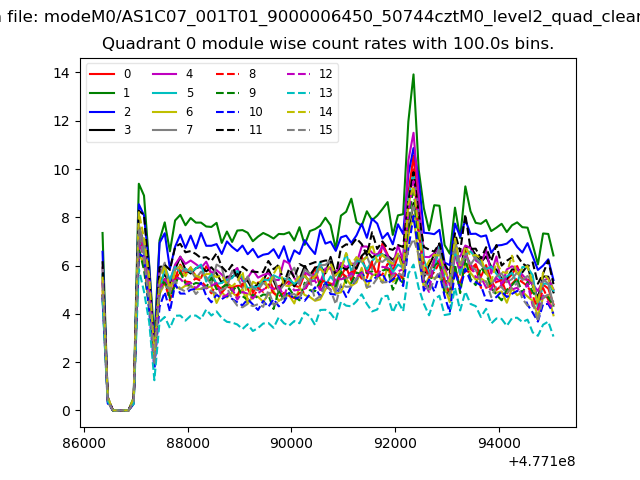 |
 |
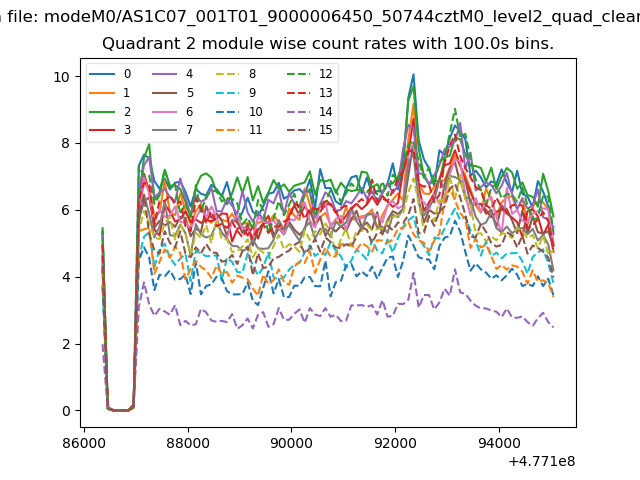
| Module-wise count rates for Quadrant B Data is divided into 100 sec bins |
 |
 |
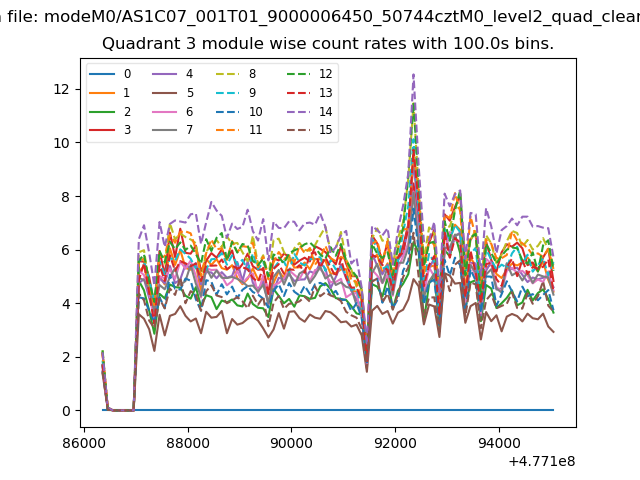
| Module-wise count rates for Quadrant C Data is divided into 100 sec bins |
 |
 |
| Module-wise count rates for Quadrant D Data is divided into 100 sec bins |
 |
 |
| Parameter | Plot |
|---|---|
| CZT HV Monitor | 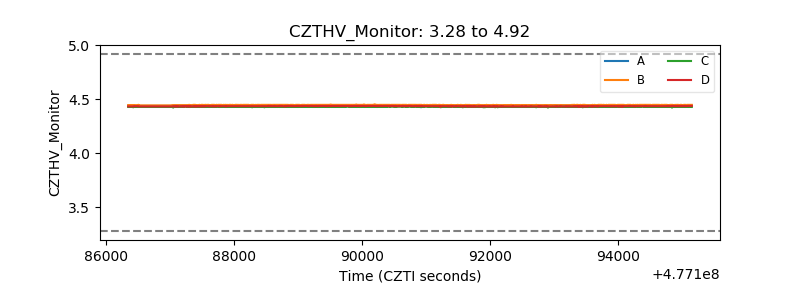 |
| D_VDD | 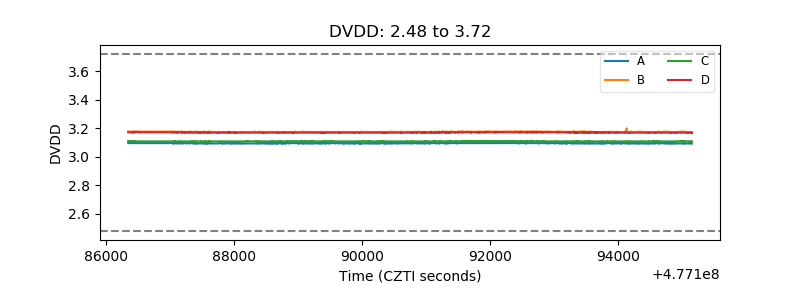 |
| Temperature 1 | 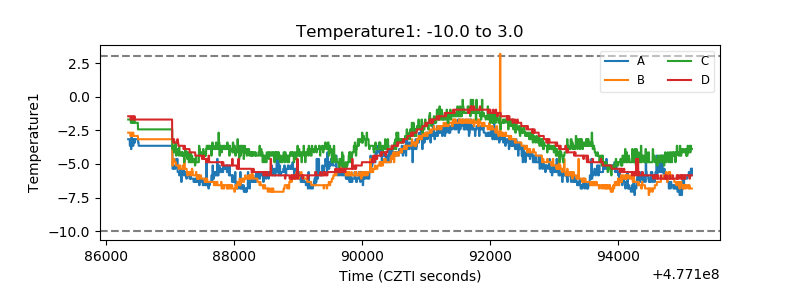 |
| Veto HV Monitor | 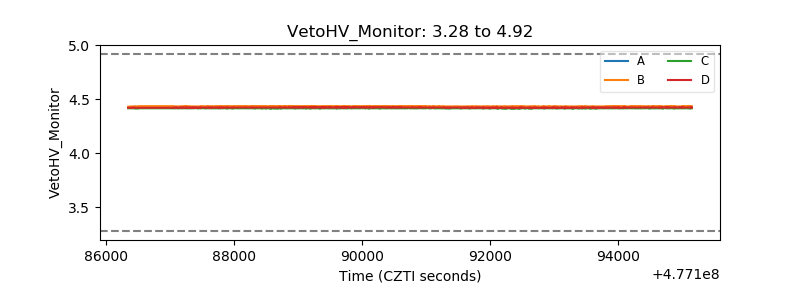 |
| Veto LLD | 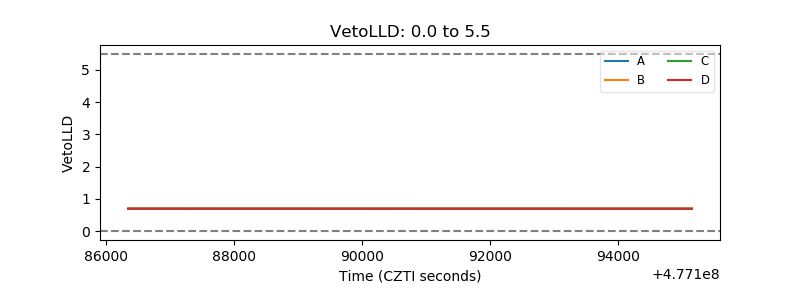 |
| Alpha Counter | 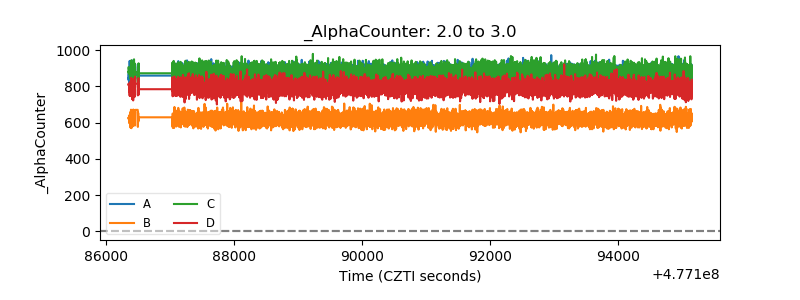 |
| _CPM_Rate | 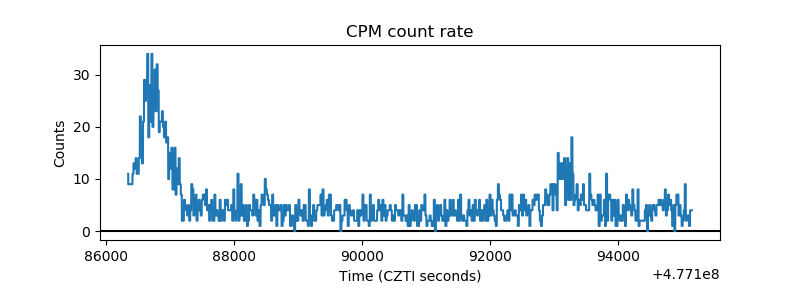 |
| CZT Counter | 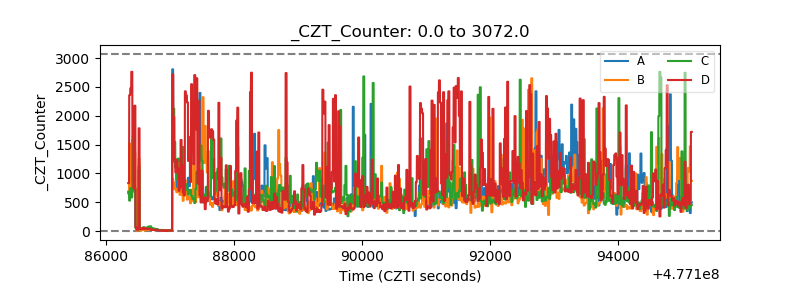 |
| +2.5 Volts monitor | 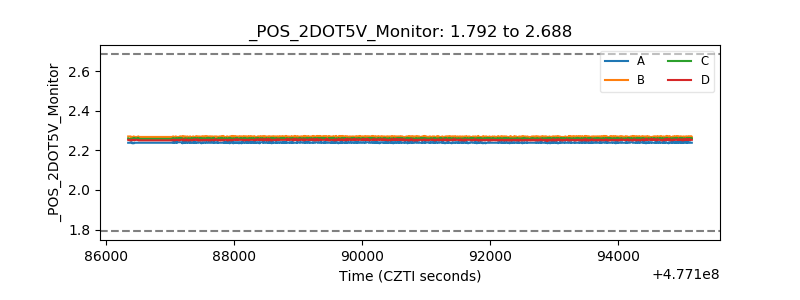 |
| +5 Volts monitor | 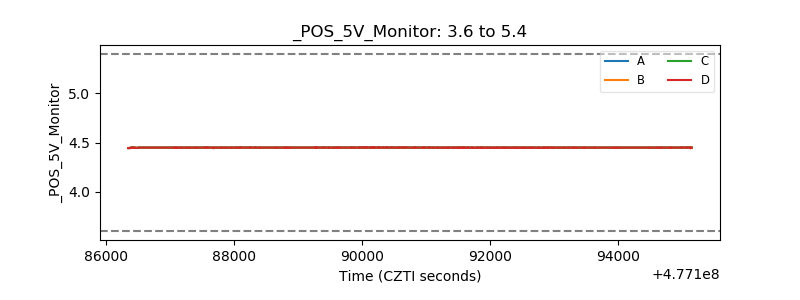 |
| _ROLL_ROT | 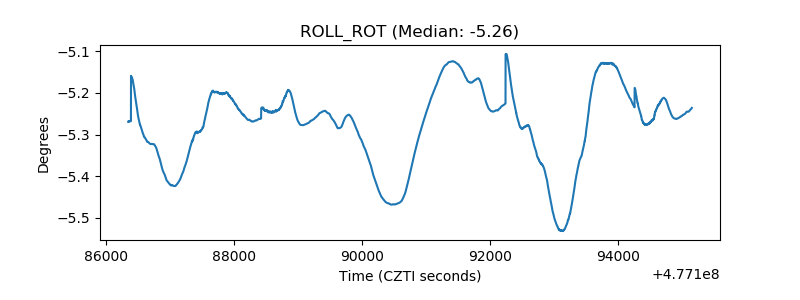 |
| _Roll_DEC | 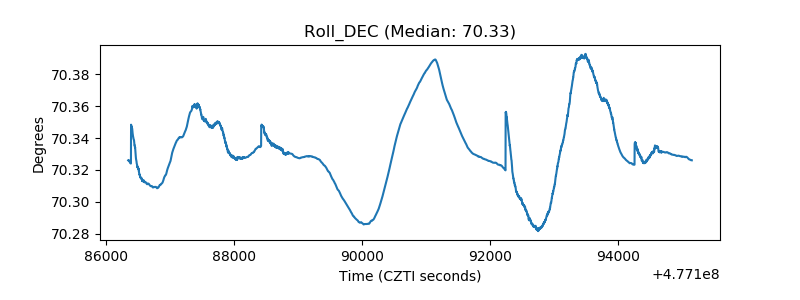 |
| _Roll_RA | 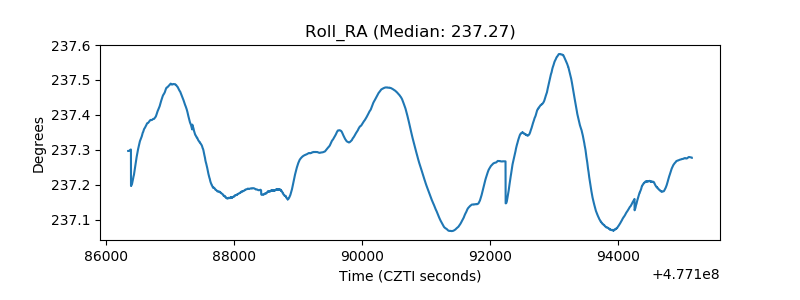 |
| Veto Counter | 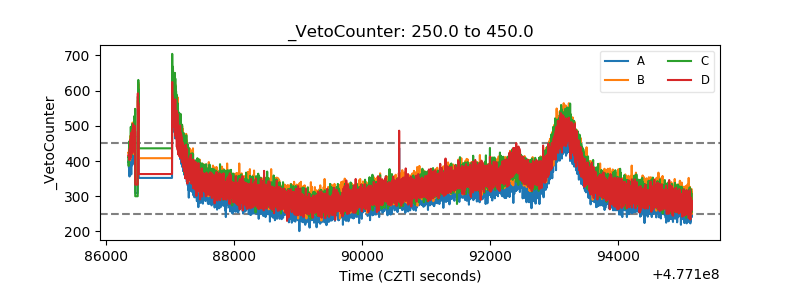 |