| Param | Original file | Final file |
|---|---|---|
| Filename | modeM0/AS1C07_001T01_9000006450_50749cztM0_level2.fits | modeM0/AS1C07_001T01_9000006450_50749cztM0_level2_quad_clean.evt |
| Size (bytes) | 2,546,245,440 | 344,306,880 |
| Size | 2.4 GB | 328.4 MB |
| Events in quadrant A | 25,910,333 | 2,214,551 |
| Events in quadrant B | 12,930,393 | 2,588,435 |
| Events in quadrant C | 28,058,558 | 1,961,122 |
| Events in quadrant D | 25,387,530 | 1,901,957 |
| Mode SS | |||
|---|---|---|---|
| Quadrant | BADHDUFLAG | Total packets | Discarded packets |
| A | 0 | 518 | 0 |
| B | 0 | 518 | 0 |
| C | 0 | 518 | 0 |
| D | 0 | 518 | 0 |
| Mode M0 | |||
|---|---|---|---|
| Quadrant | BADHDUFLAG | Total packets | Discarded packets |
| A | 0 | 94682 | 23 |
| B | 0 | 56810 | 9 |
| C | 0 | 100761 | 26 |
| D | 0 | 93169 | 24 |
| Mode M9 | |||
|---|---|---|---|
| Quadrant | BADHDUFLAG | Total packets | Discarded packets |
| A | 0 | 14 | 0 |
| B | 0 | 14 | 0 |
| C | 0 | 14 | 0 |
| D | 0 | 14 | 0 |
| Quadrant | Total seconds | Saturated seconds | Saturation percentage |
|---|---|---|---|
| A | 25540 | 2903 | 11.366484% |
| B | 25541 | 456 | 1.785365% |
| C | 25540 | 4639 | 18.163665% |
| D | 25542 | 3624 | 14.188396% |
Noise dominated data is calculated using 1-second bins in cleaned event files. If a bin has >2000 counts, and if more than 50% of those come from <1% of pixels, then it is considered to be noise-dominated and hence unusable.
| Quadrant | # 1 sec bins | Bins with >0 counts | Bins with >2000 counts | High rate bins dominated by noise | Noise dominated (total time) | Noise dominated (detector-on time) | Marked lightcurve |
|---|---|---|---|---|---|---|---|
| A | 26944 | 25544 | 2523 | 2523 | 9.36% | 9.88% | 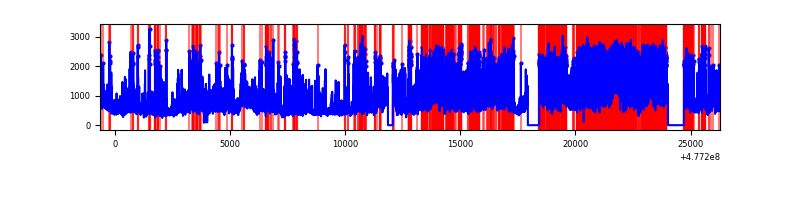 |
| B | 26944 | 25544 | 92 | 92 | 0.34% | 0.36% | 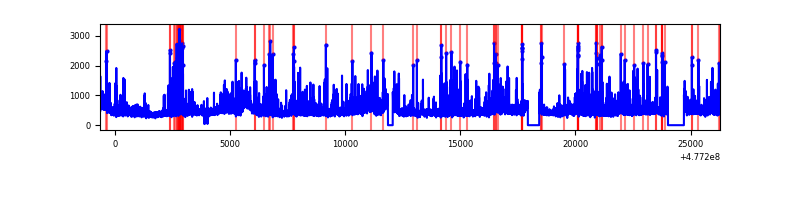 |
| C | 26945 | 25544 | 4316 | 4316 | 16.02% | 16.90% | 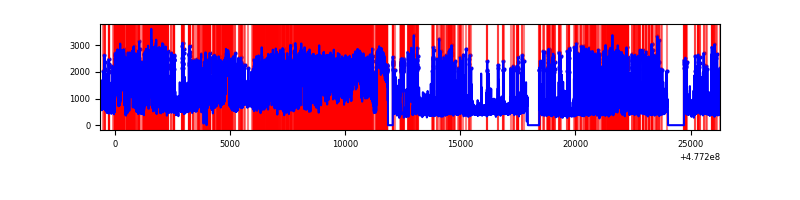 |
| D | 26945 | 25544 | 3311 | 3311 | 12.29% | 12.96% | 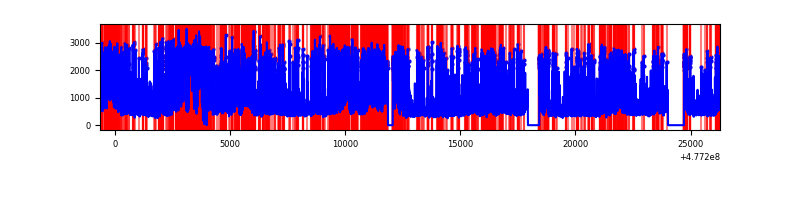 |
Top three noisy pixels from each quadrant. If the there are fewer than three noisy pixels in the level2.evt file, extra rows are filled as -1
| Pixel properties | Quadrant properties | ||||||
|---|---|---|---|---|---|---|---|
| Quadrant | DetID | PixID | Counts | Sigma | Mean | Median | Sigma |
| A | 4 | 4 | 10966972 | 16326.84 | 2683 | 2607 | 671.6 |
| A | 3 | 130 | 968708 | 1438.6 | 2683 | 2607 | 671.6 |
| A | 4 | 3 | 768774 | 1140.89 | 2683 | 2607 | 671.6 |
| B | 10 | 247 | 387914 | 657.27 | 2735 | 2631 | 586.2 |
| B | 8 | 128 | 310079 | 524.49 | 2735 | 2631 | 586.2 |
| B | 7 | 0 | 250586 | 422.99 | 2735 | 2631 | 586.2 |
| C | 9 | 38 | 3597212 | 5279.72 | 2486 | 2464 | 680.9 |
| C | 15 | 174 | 2796858 | 4104.22 | 2486 | 2464 | 680.9 |
| C | 15 | 157 | 1692939 | 2482.85 | 2486 | 2464 | 680.9 |
| D | 1 | 47 | 3825721 | 5428.67 | 2498 | 2415 | 704.3 |
| D | 15 | 93 | 1878936 | 2664.45 | 2498 | 2415 | 704.3 |
| D | 2 | 216 | 1809948 | 2566.5 | 2498 | 2415 | 704.3 |
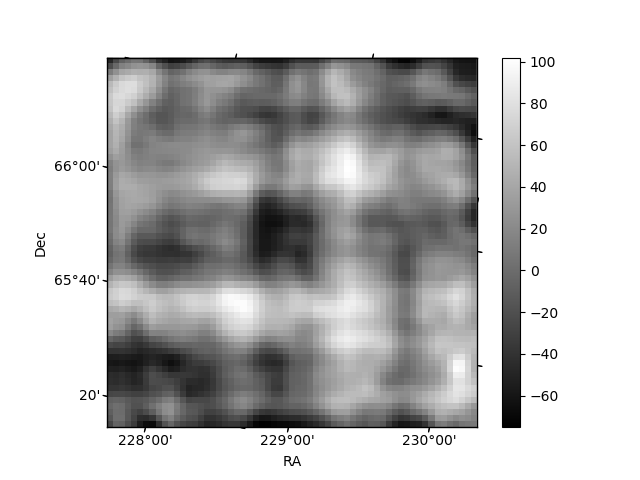
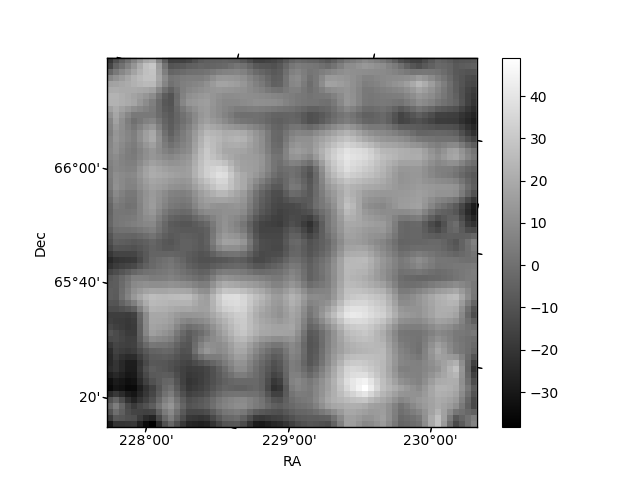
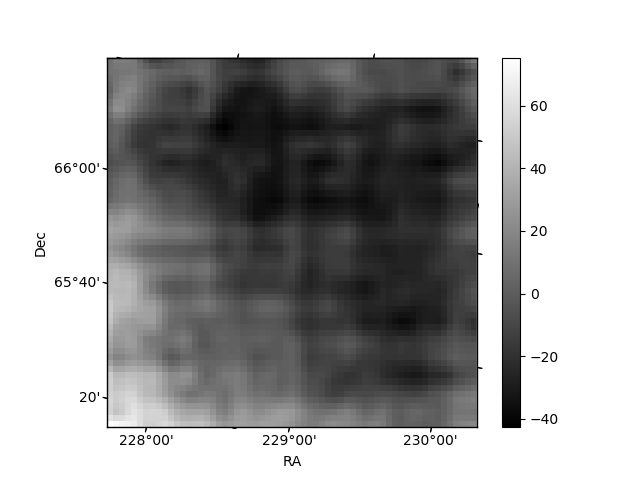
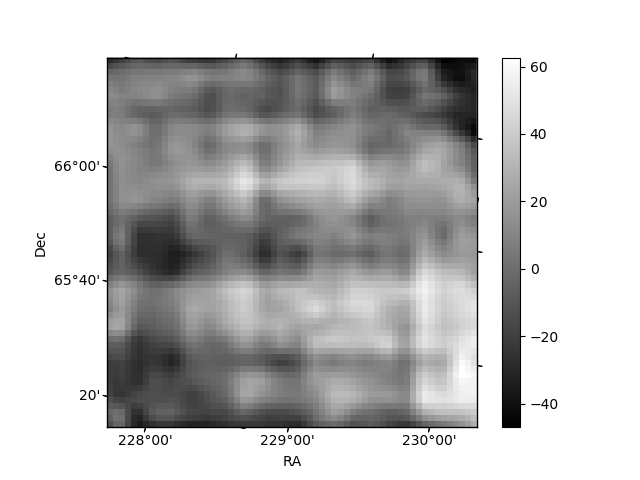
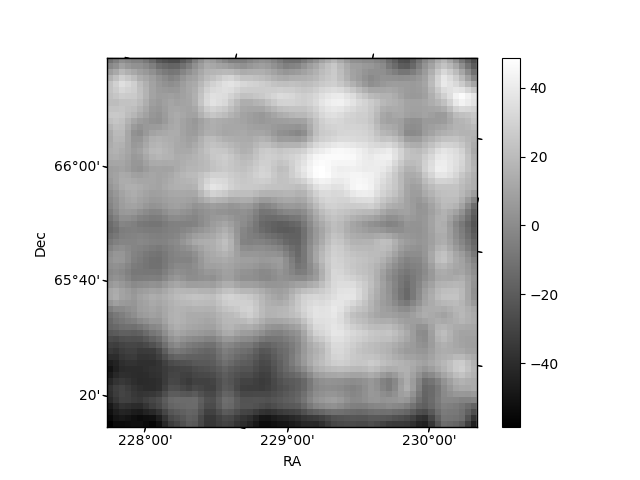
Histogram calculated using DETX and DETY for each event in the final _common_clean file
| Quadrant A | 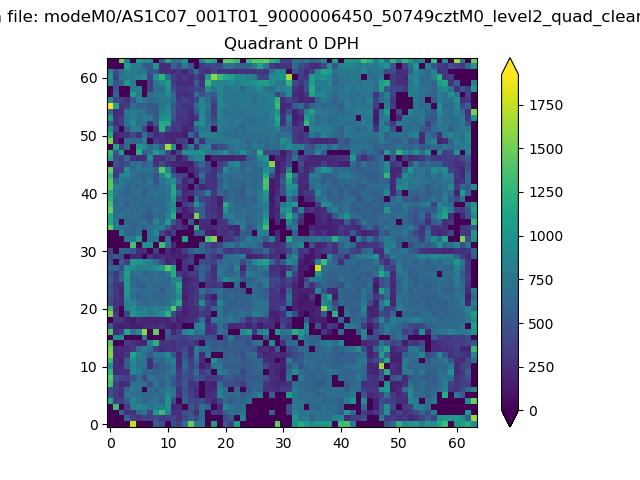 |
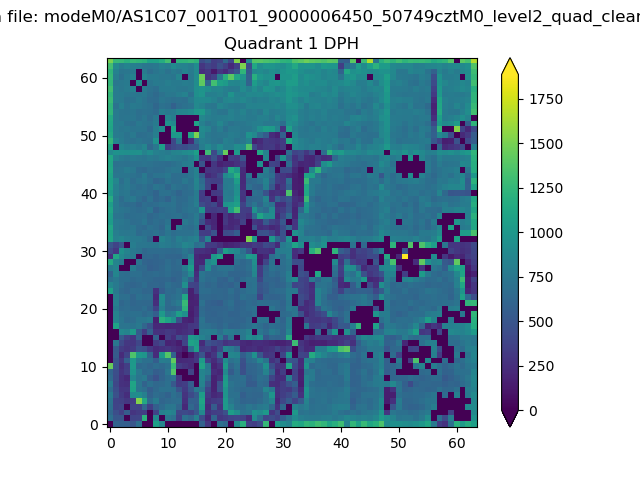 |
Quadrant B |
|---|---|---|---|
| Quadrant D | 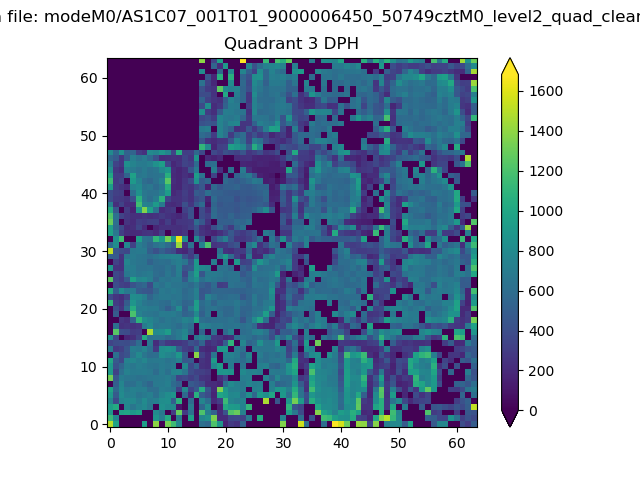 |
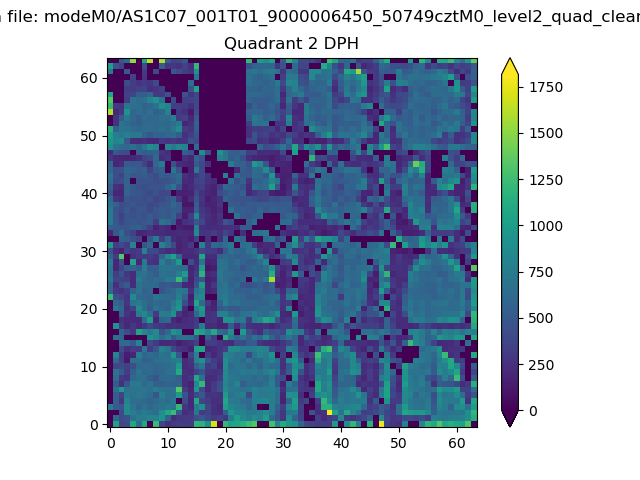 |
Quadrant C |
| Plot type | Count rate plots | Images |
|---|---|---|
| Comparison with Poisson distribution Blue bars denote a histogram of data divided into 1 sec bins. Red curve is a Poisson curve with rate = median count rate of data. |
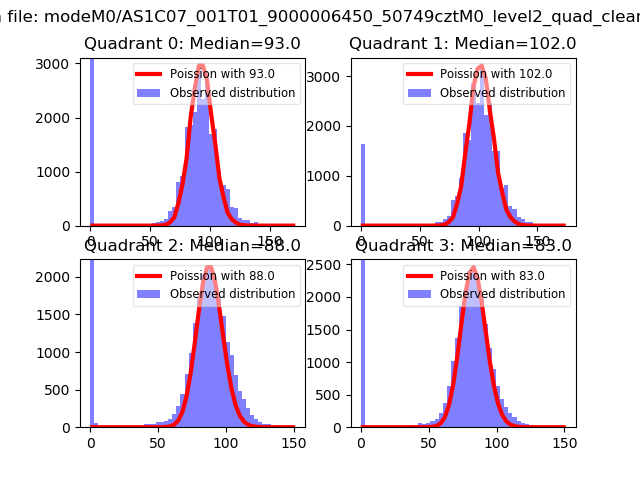 |
 |
| Quadrant-wise count rates Data is divided into 100 sec bins |
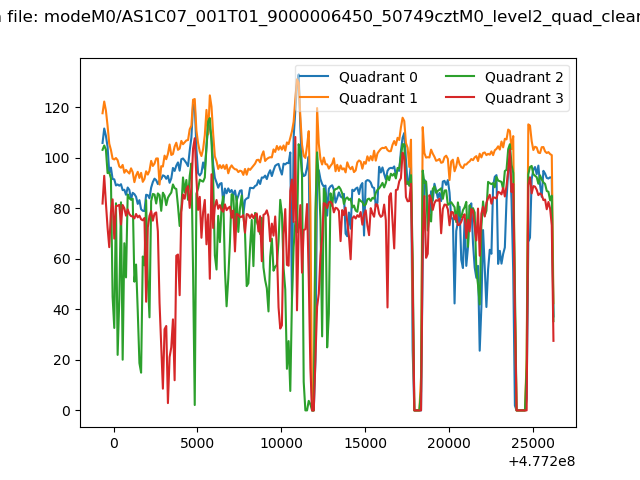 |
|
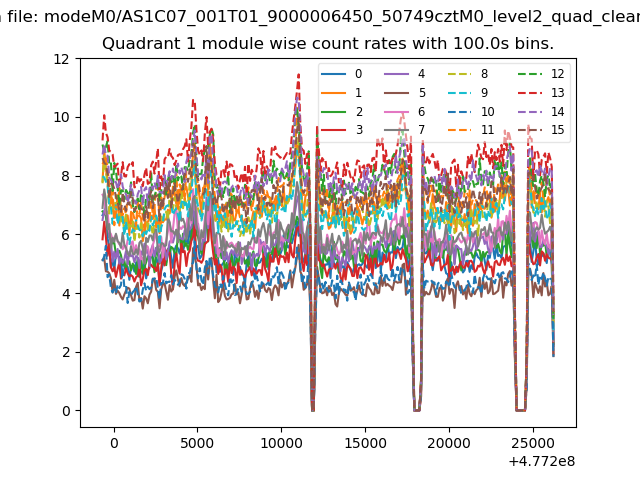
| Module-wise count rates for Quadrant A Data is divided into 100 sec bins |
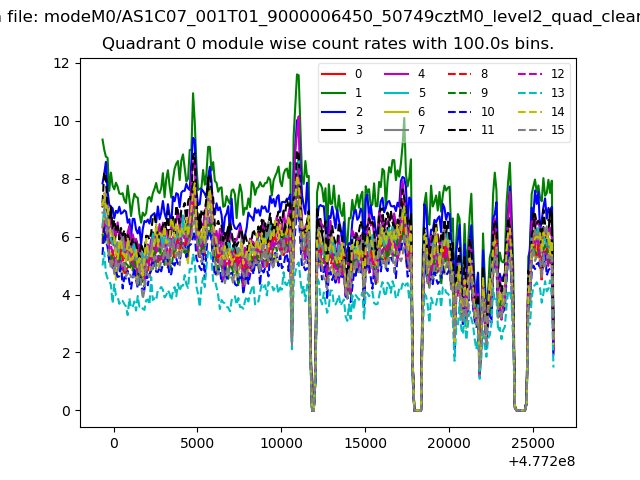 |
 |
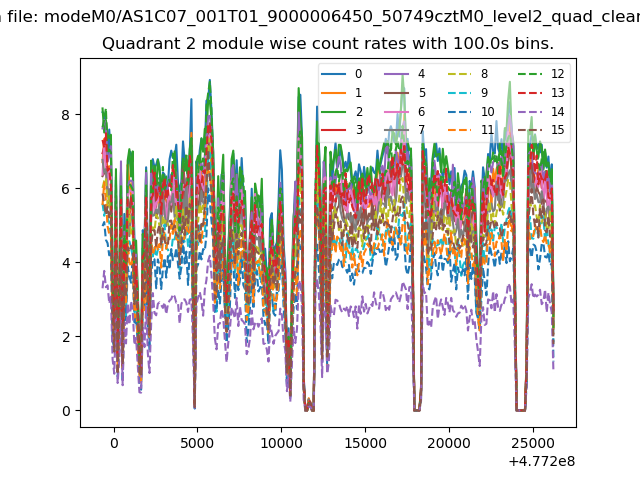
| Module-wise count rates for Quadrant B Data is divided into 100 sec bins |
 |
 |
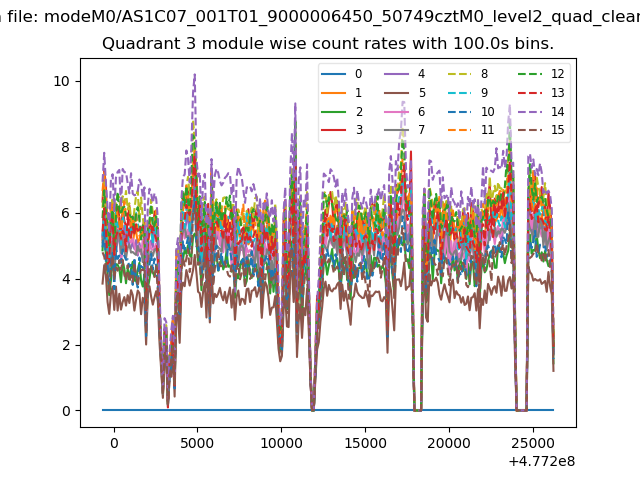
| Module-wise count rates for Quadrant C Data is divided into 100 sec bins |
 |
 |
| Module-wise count rates for Quadrant D Data is divided into 100 sec bins |
 |
 |
| Parameter | Plot |
|---|---|
| CZT HV Monitor | 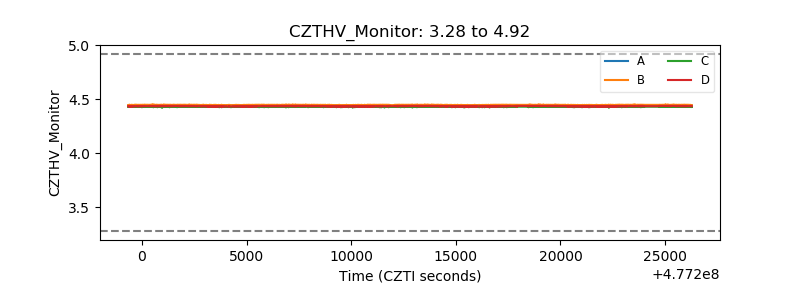 |
| D_VDD | 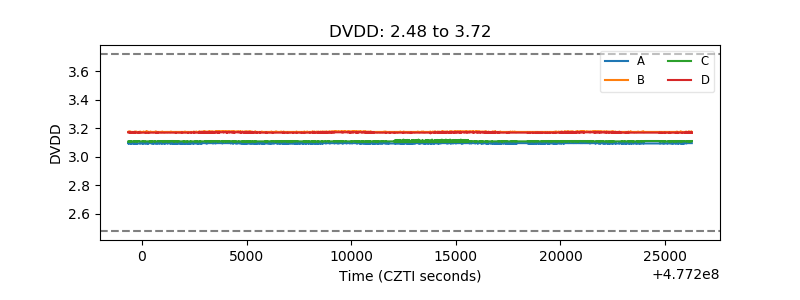 |
| Temperature 1 | 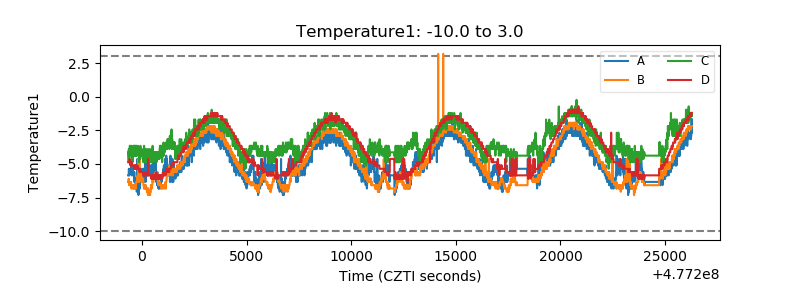 |
| Veto HV Monitor | 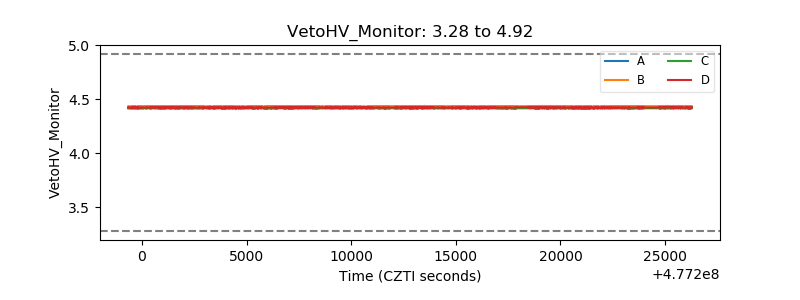 |
| Veto LLD | 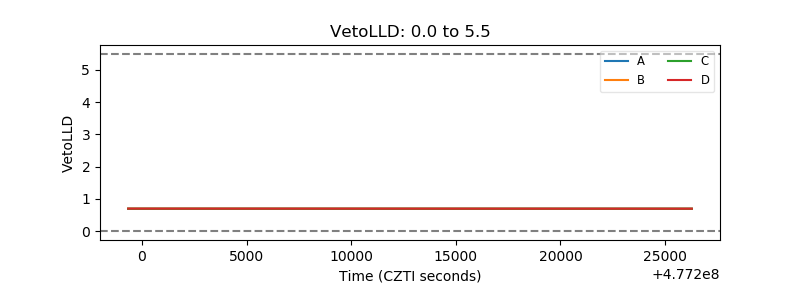 |
| Alpha Counter | 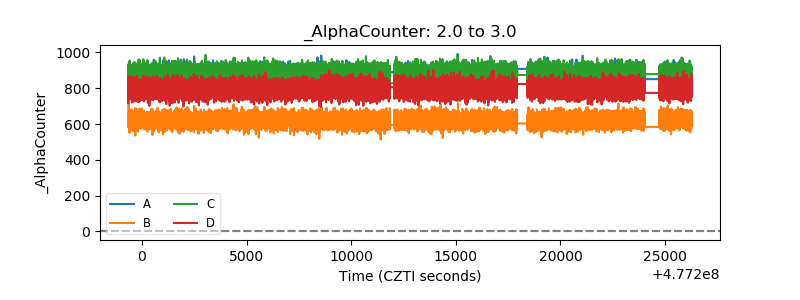 |
| _CPM_Rate | 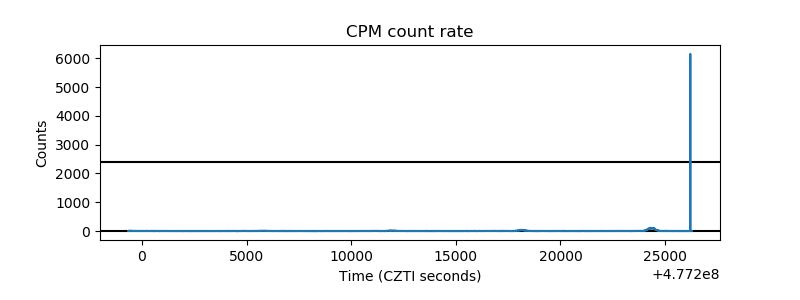 |
| CZT Counter | 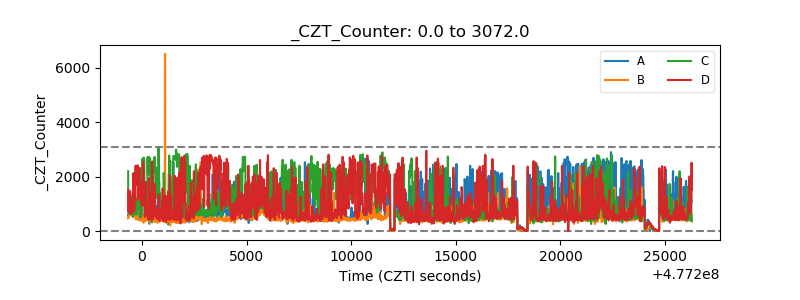 |
| +2.5 Volts monitor | 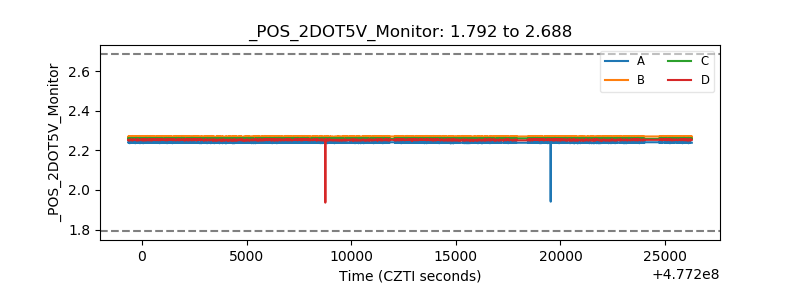 |
| +5 Volts monitor | 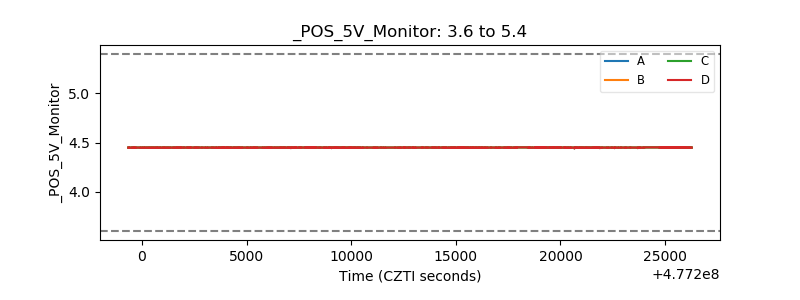 |
| _ROLL_ROT | 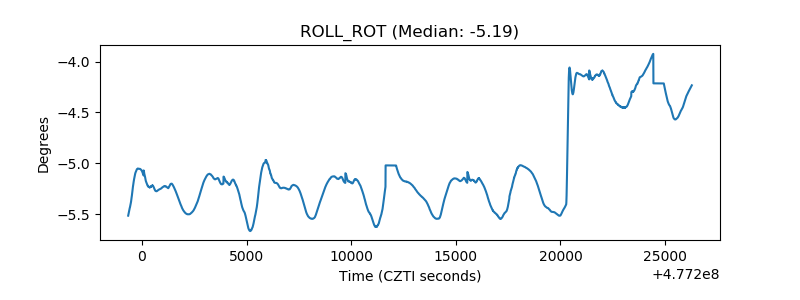 |
| _Roll_DEC | 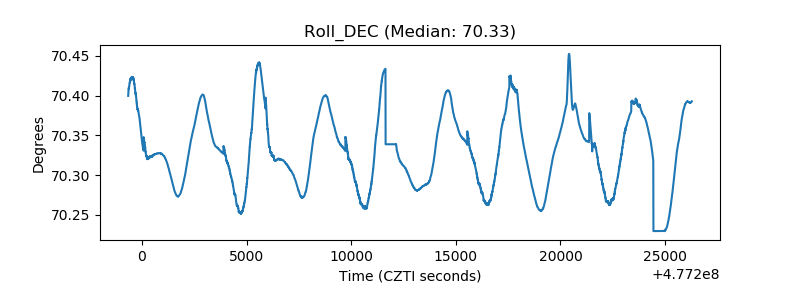 |
| _Roll_RA | 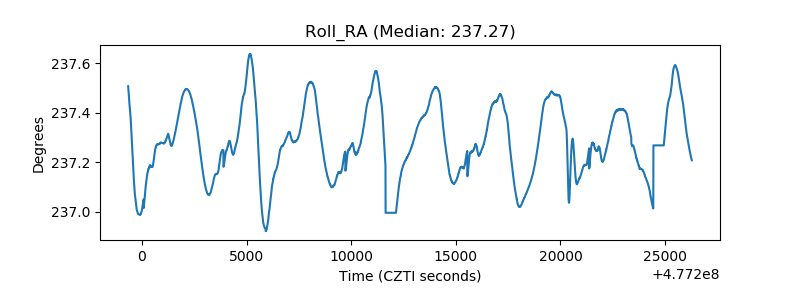 |
| Veto Counter | 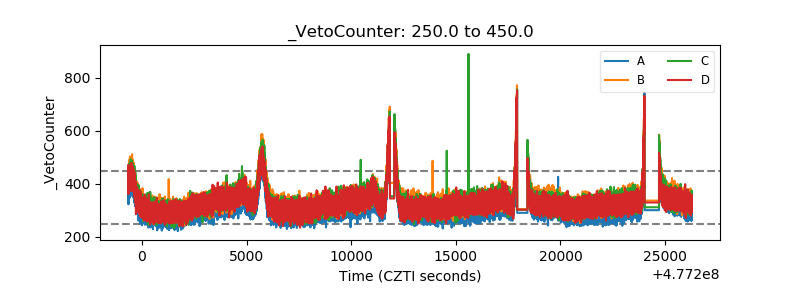 |