| Param | Original file | Final file |
|---|---|---|
| Filename | modeM0/AS1C07_001T01_9000006450_50750cztM0_level2.fits | modeM0/AS1C07_001T01_9000006450_50750cztM0_level2_quad_clean.evt |
| Size (bytes) | 591,888,960 | 85,239,360 |
| Size | 564.5 MB | 81.3 MB |
| Events in quadrant A | 7,375,944 | 524,395 |
| Events in quadrant B | 3,473,494 | 627,724 |
| Events in quadrant C | 5,239,843 | 510,529 |
| Events in quadrant D | 5,345,564 | 489,964 |
| Mode SS | |||
|---|---|---|---|
| Quadrant | BADHDUFLAG | Total packets | Discarded packets |
| A | 0 | 124 | 0 |
| B | 0 | 124 | 0 |
| C | 0 | 124 | 0 |
| D | 0 | 124 | 0 |
| Mode M0 | |||
|---|---|---|---|
| Quadrant | BADHDUFLAG | Total packets | Discarded packets |
| A | 0 | 26411 | 223 |
| B | 0 | 14667 | 88 |
| C | 0 | 19812 | 112 |
| D | 0 | 20221 | 107 |
| Mode M9 | |||
|---|---|---|---|
| Quadrant | BADHDUFLAG | Total packets | Discarded packets |
| A | 0 | 9 | 0 |
| B | 0 | 9 | 0 |
| C | 0 | 9 | 0 |
| D | 0 | 9 | 0 |
| Quadrant | Total seconds | Saturated seconds | Saturation percentage |
|---|---|---|---|
| A | 6128 | 863 | 14.082898% |
| B | 6138 | 102 | 1.661779% |
| C | 6140 | 555 | 9.039088% |
| D | 6136 | 493 | 8.034550% |
Noise dominated data is calculated using 1-second bins in cleaned event files. If a bin has >2000 counts, and if more than 50% of those come from <1% of pixels, then it is considered to be noise-dominated and hence unusable.
| Quadrant | # 1 sec bins | Bins with >0 counts | Bins with >2000 counts | High rate bins dominated by noise | Noise dominated (total time) | Noise dominated (detector-on time) | Marked lightcurve |
|---|---|---|---|---|---|---|---|
| A | 7052 | 6134 | 858 | 858 | 12.17% | 13.99% | 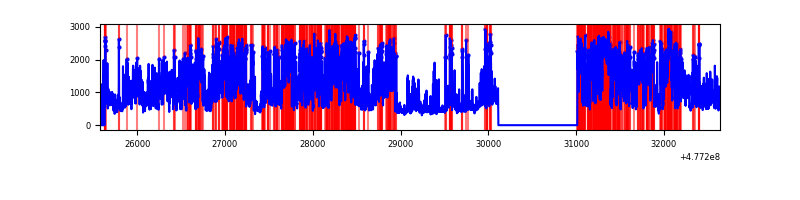 |
| B | 7062 | 6144 | 36 | 36 | 0.51% | 0.59% | 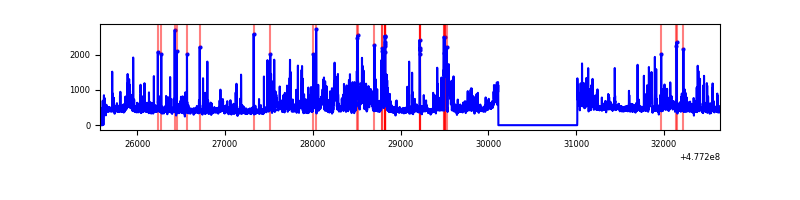 |
| C | 7064 | 6150 | 516 | 516 | 7.30% | 8.39% | 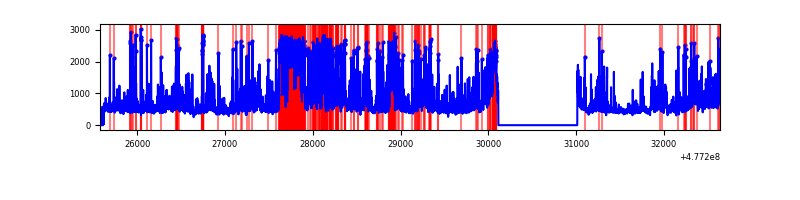 |
| D | 7060 | 6142 | 470 | 470 | 6.66% | 7.65% | 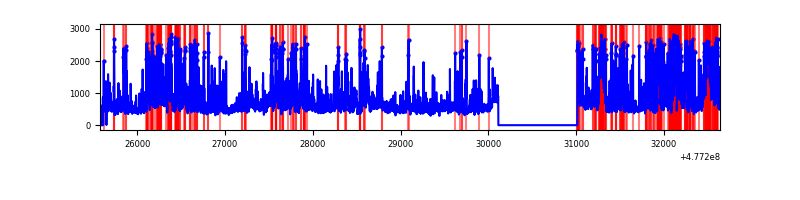 |
Top three noisy pixels from each quadrant. If the there are fewer than three noisy pixels in the level2.evt file, extra rows are filled as -1
| Pixel properties | Quadrant properties | ||||||
|---|---|---|---|---|---|---|---|
| Quadrant | DetID | PixID | Counts | Sigma | Mean | Median | Sigma |
| A | 4 | 4 | 3899422 | 24632.44 | 629 | 613 | 158.3 |
| A | 4 | 3 | 221044 | 1392.67 | 629 | 613 | 158.3 |
| A | 6 | 195 | 129627 | 815.1 | 629 | 613 | 158.3 |
| B | 7 | 0 | 278437 | 1998.29 | 647 | 624 | 139.0 |
| B | 10 | 60 | 151536 | 1085.5 | 647 | 624 | 139.0 |
| B | 10 | 247 | 89490 | 639.21 | 647 | 624 | 139.0 |
| C | 15 | 179 | 987794 | 5917.81 | 609 | 604 | 166.8 |
| C | 0 | 209 | 460595 | 2757.46 | 609 | 604 | 166.8 |
| C | 13 | 3 | 233576 | 1396.57 | 609 | 604 | 166.8 |
| D | 1 | 47 | 923742 | 5365.77 | 616 | 595 | 172.0 |
| D | 2 | 249 | 392659 | 2278.86 | 616 | 595 | 172.0 |
| D | 8 | 176 | 294441 | 1707.97 | 616 | 595 | 172.0 |
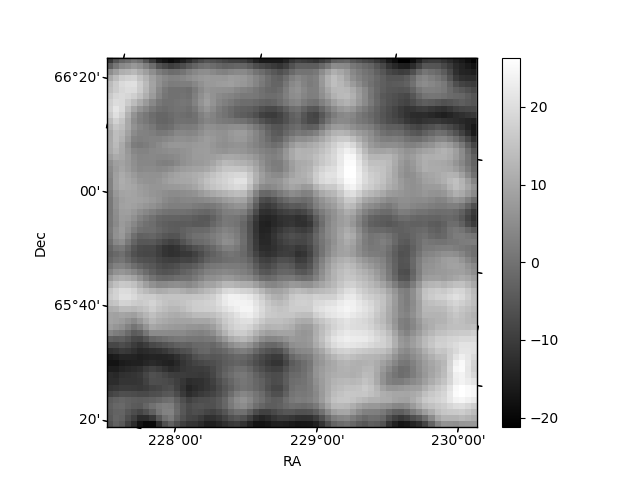
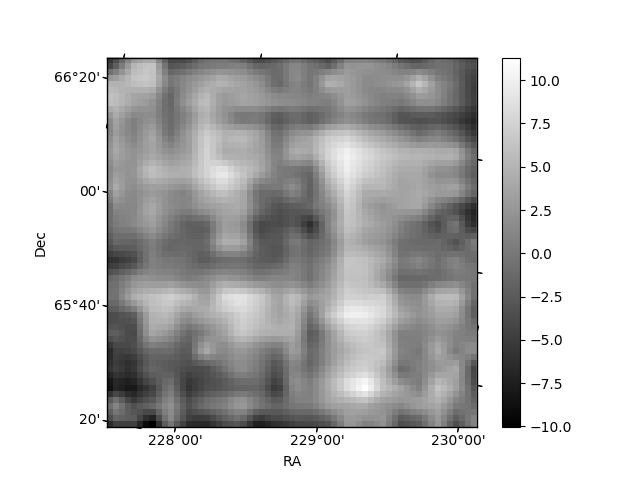
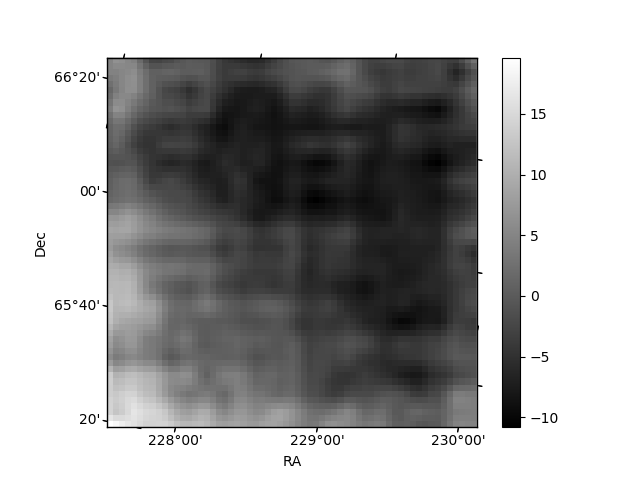
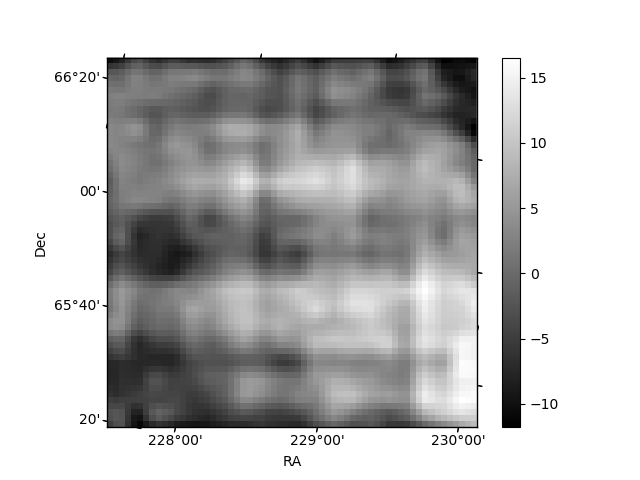
Histogram calculated using DETX and DETY for each event in the final _common_clean file
| Quadrant A | 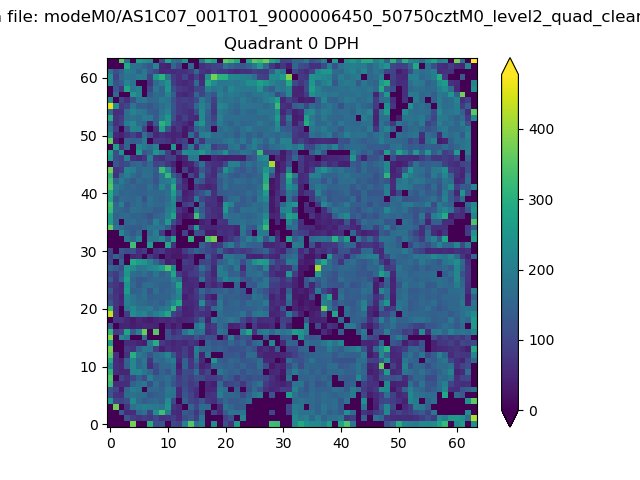 |
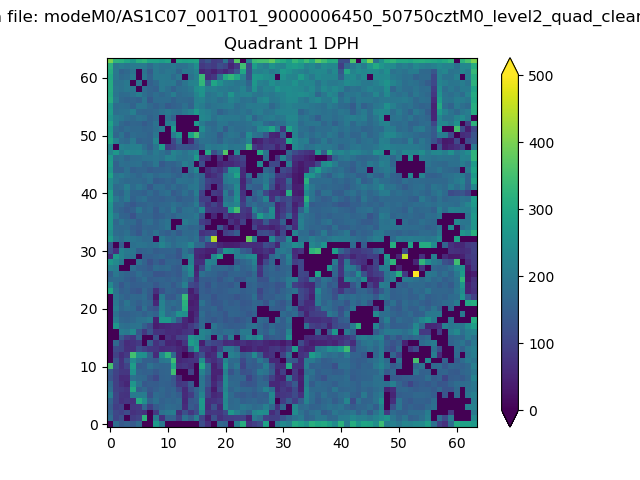 |
Quadrant B |
|---|---|---|---|
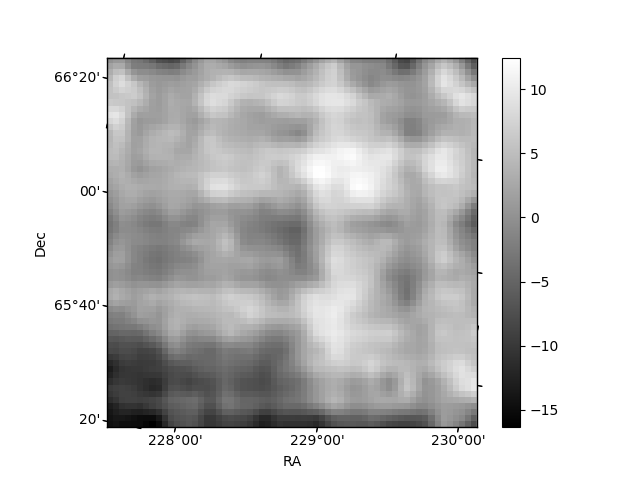
| Quadrant D | 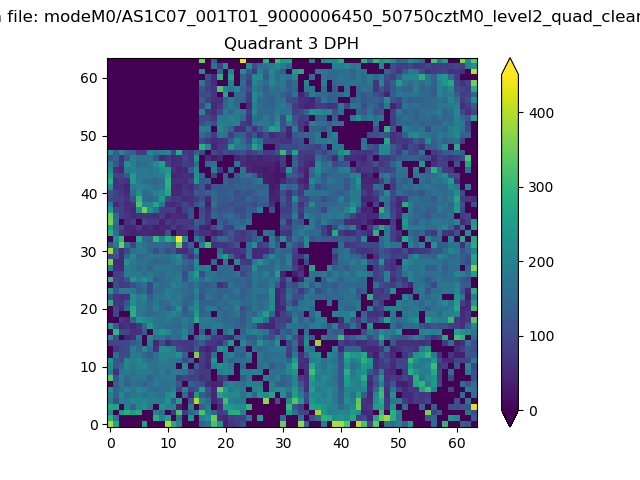 |
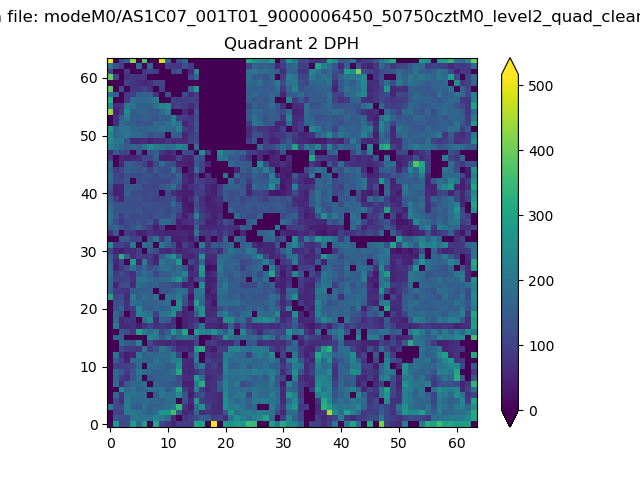 |
Quadrant C |
| Plot type | Count rate plots | Images |
|---|---|---|
| Comparison with Poisson distribution Blue bars denote a histogram of data divided into 1 sec bins. Red curve is a Poisson curve with rate = median count rate of data. |
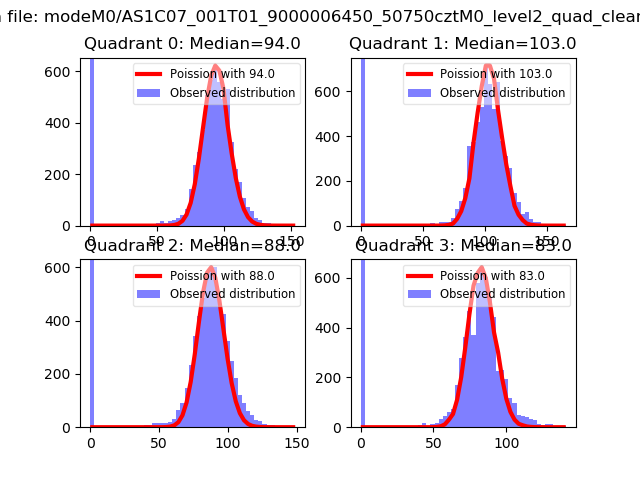 |
 |
| Quadrant-wise count rates Data is divided into 100 sec bins |
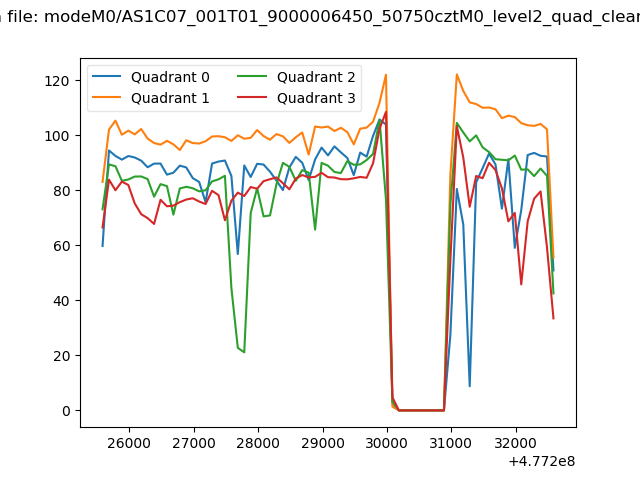 |
|
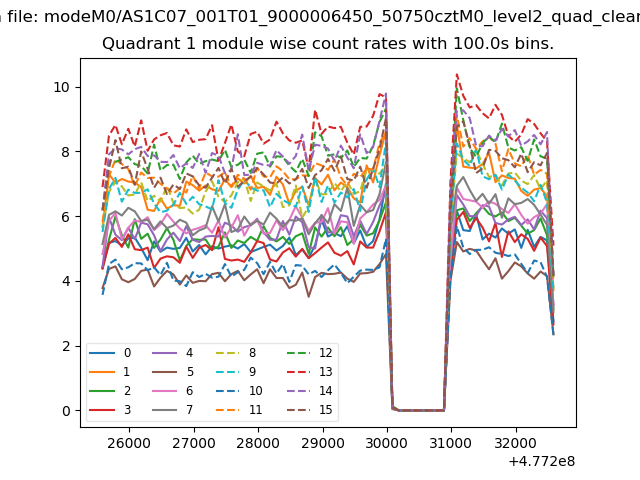
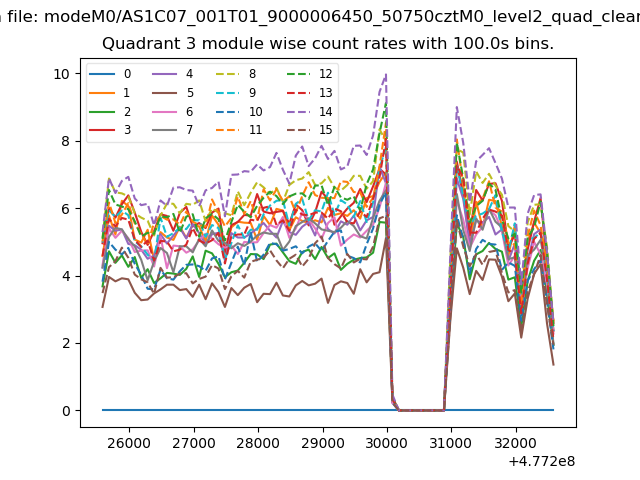
| Module-wise count rates for Quadrant A Data is divided into 100 sec bins |
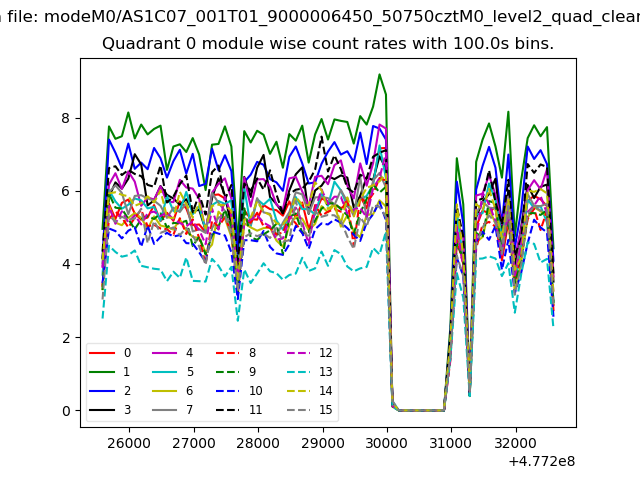 |
 |
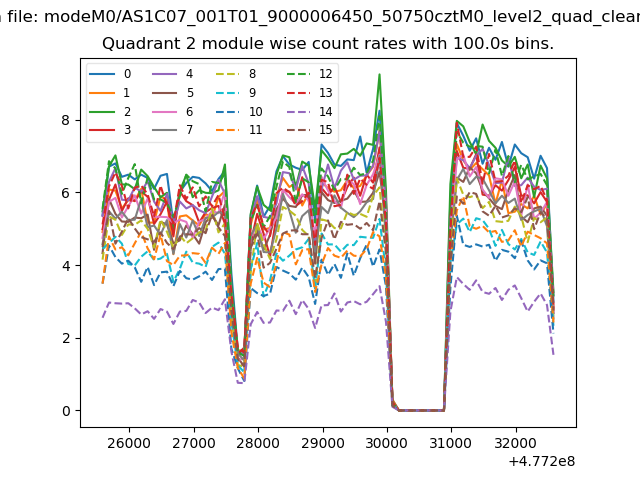
| Module-wise count rates for Quadrant B Data is divided into 100 sec bins |
 |
 |
| Module-wise count rates for Quadrant C Data is divided into 100 sec bins |
 |
 |
| Module-wise count rates for Quadrant D Data is divided into 100 sec bins |
 |
 |
| Parameter | Plot |
|---|---|
| CZT HV Monitor | 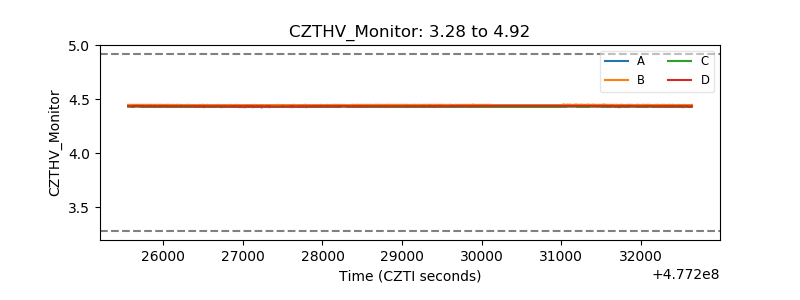 |
| D_VDD | 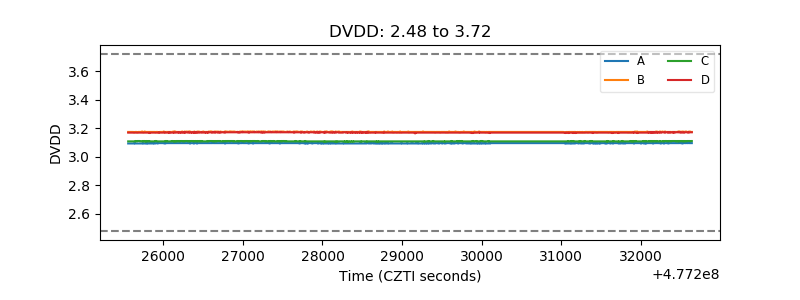 |
| Temperature 1 | 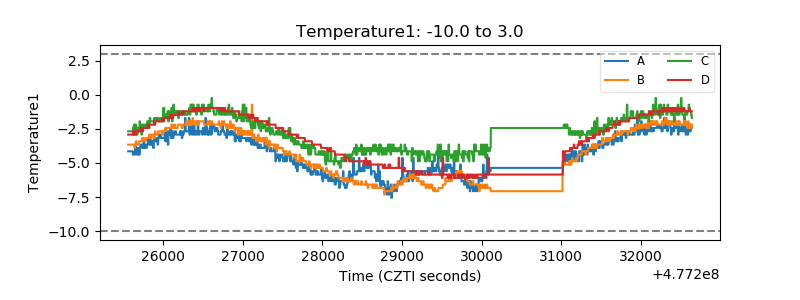 |
| Veto HV Monitor | 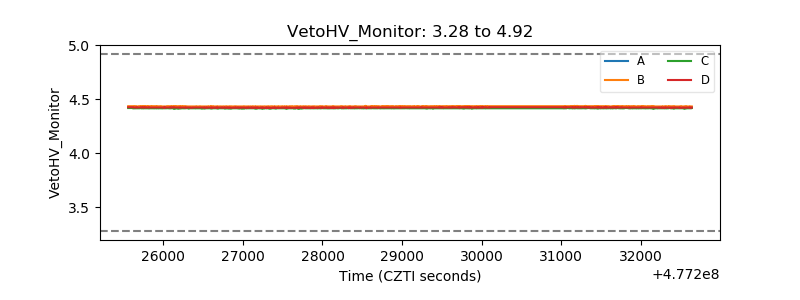 |
| Veto LLD | 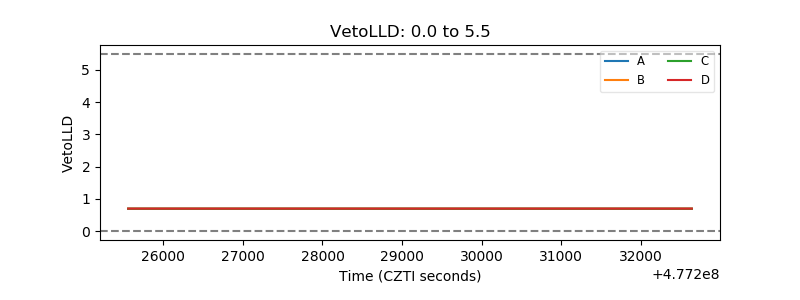 |
| Alpha Counter | 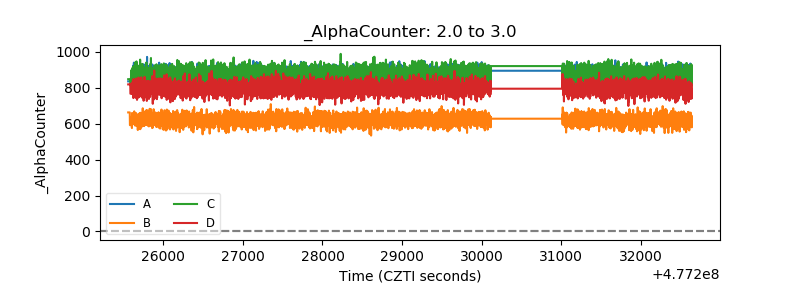 |
| _CPM_Rate | 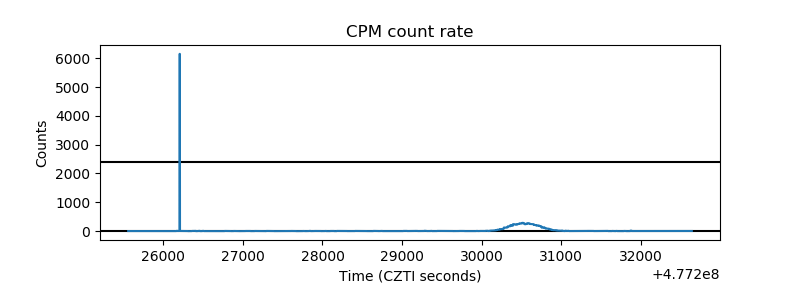 |
| CZT Counter | 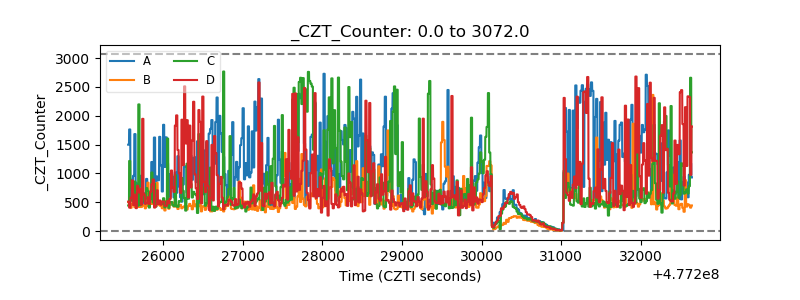 |
| +2.5 Volts monitor |  |
| +5 Volts monitor | 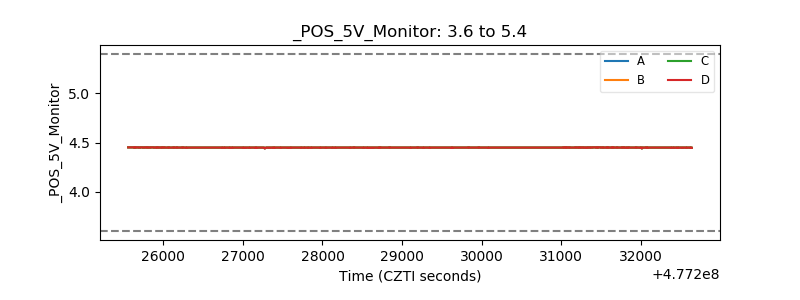 |
| _ROLL_ROT | 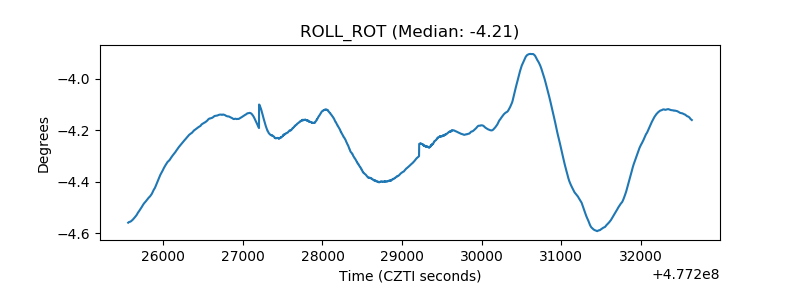 |
| _Roll_DEC | 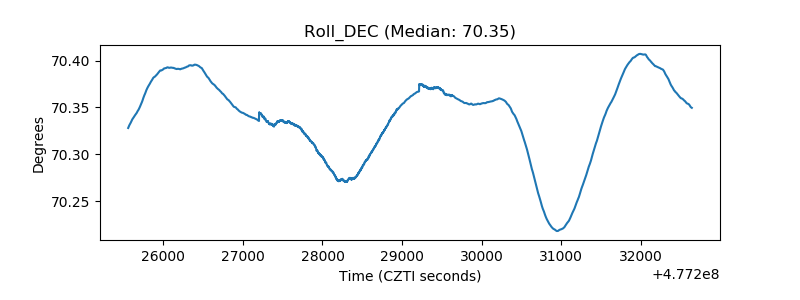 |
| _Roll_RA | 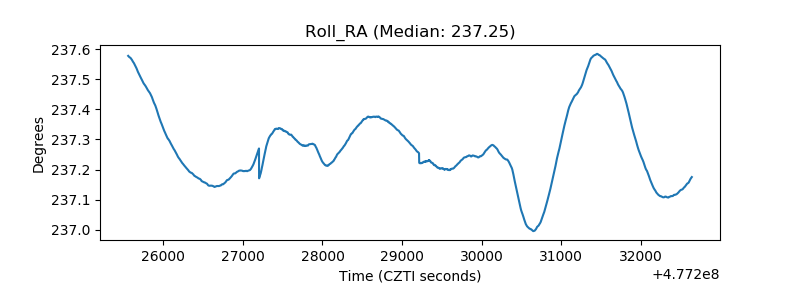 |
| Veto Counter | 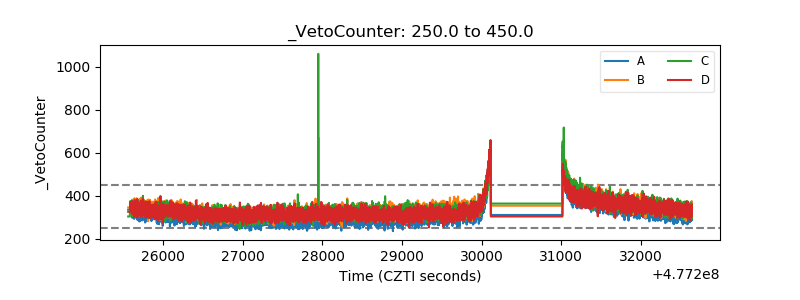 |