| Param | Original file | Final file |
|---|---|---|
| Filename | modeM0/AS1C07_001T01_9000006450_50752cztM0_level2.fits | modeM0/AS1C07_001T01_9000006450_50752cztM0_level2_quad_clean.evt |
| Size (bytes) | 604,195,200 | 90,642,240 |
| Size | 576.2 MB | 86.4 MB |
| Events in quadrant A | 6,932,185 | 567,052 |
| Events in quadrant B | 3,792,614 | 658,753 |
| Events in quadrant C | 4,970,260 | 568,120 |
| Events in quadrant D | 6,178,051 | 506,761 |
| Mode SS | |||
|---|---|---|---|
| Quadrant | BADHDUFLAG | Total packets | Discarded packets |
| A | 0 | 128 | 0 |
| B | 0 | 128 | 0 |
| C | 0 | 128 | 0 |
| D | 0 | 128 | 0 |
| Mode M0 | |||
|---|---|---|---|
| Quadrant | BADHDUFLAG | Total packets | Discarded packets |
| A | 0 | 24962 | 1 |
| B | 0 | 15705 | 1 |
| C | 0 | 19062 | 1 |
| D | 0 | 22700 | 1 |
| Mode M9 | |||
|---|---|---|---|
| Quadrant | BADHDUFLAG | Total packets | Discarded packets |
| A | 0 | 10 | 0 |
| B | 0 | 10 | 0 |
| C | 0 | 10 | 0 |
| D | 0 | 10 | 0 |
| Quadrant | Total seconds | Saturated seconds | Saturation percentage |
|---|---|---|---|
| A | 6363 | 709 | 11.142543% |
| B | 6362 | 169 | 2.656397% |
| C | 6362 | 288 | 4.526878% |
| D | 6363 | 663 | 10.419613% |
Noise dominated data is calculated using 1-second bins in cleaned event files. If a bin has >2000 counts, and if more than 50% of those come from <1% of pixels, then it is considered to be noise-dominated and hence unusable.
| Quadrant | # 1 sec bins | Bins with >0 counts | Bins with >2000 counts | High rate bins dominated by noise | Noise dominated (total time) | Noise dominated (detector-on time) | Marked lightcurve |
|---|---|---|---|---|---|---|---|
| A | 7362 | 6362 | 533 | 533 | 7.24% | 8.38% | 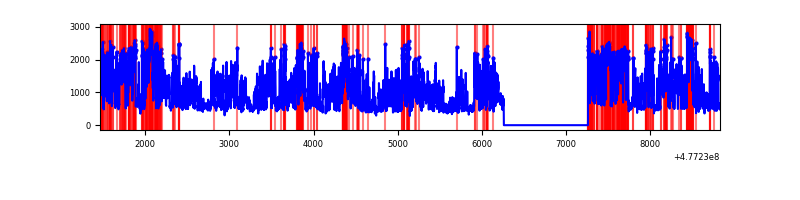 |
| B | 7361 | 6361 | 51 | 51 | 0.69% | 0.80% | 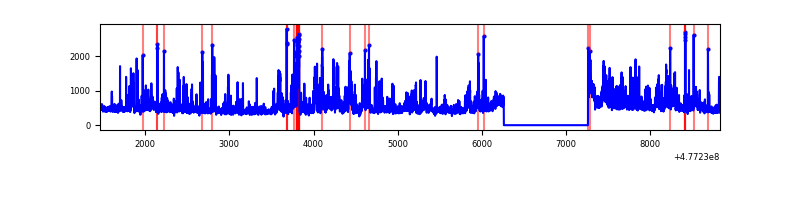 |
| C | 7361 | 6361 | 238 | 238 | 3.23% | 3.74% | 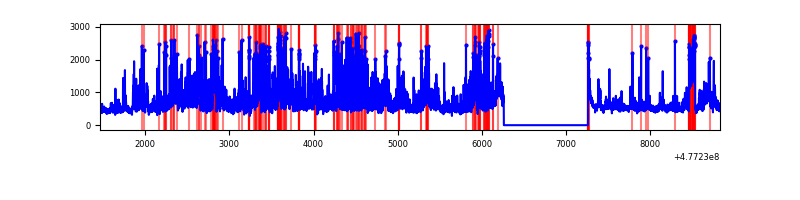 |
| D | 7362 | 6362 | 647 | 647 | 8.79% | 10.17% | 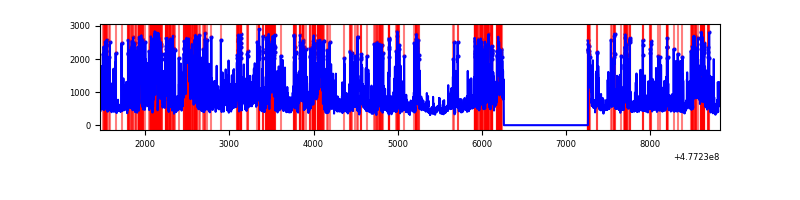 |
Top three noisy pixels from each quadrant. If the there are fewer than three noisy pixels in the level2.evt file, extra rows are filled as -1
| Pixel properties | Quadrant properties | ||||||
|---|---|---|---|---|---|---|---|
| Quadrant | DetID | PixID | Counts | Sigma | Mean | Median | Sigma |
| A | 4 | 4 | 3248648 | 19372.8 | 672 | 654 | 167.7 |
| A | 4 | 3 | 341429 | 2032.57 | 672 | 654 | 167.7 |
| A | 8 | 38 | 200531 | 1192.18 | 672 | 654 | 167.7 |
| B | 7 | 0 | 515930 | 3536.41 | 679 | 655 | 145.7 |
| B | 10 | 247 | 168921 | 1154.83 | 679 | 655 | 145.7 |
| B | 10 | 60 | 80739 | 549.63 | 679 | 655 | 145.7 |
| C | 15 | 179 | 1002879 | 5544.41 | 659 | 651 | 180.8 |
| C | 13 | 3 | 256574 | 1415.79 | 659 | 651 | 180.8 |
| C | 5 | 10 | 151704 | 835.64 | 659 | 651 | 180.8 |
| D | 2 | 216 | 765842 | 4289.72 | 640 | 616 | 178.4 |
| D | 1 | 47 | 505703 | 2831.43 | 640 | 616 | 178.4 |
| D | 15 | 93 | 468510 | 2622.93 | 640 | 616 | 178.4 |
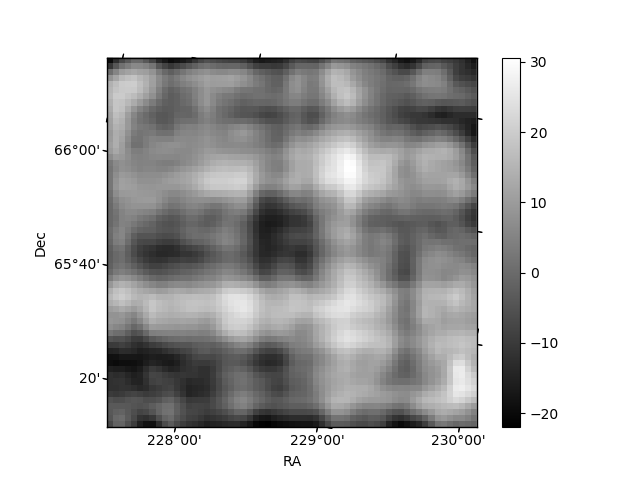
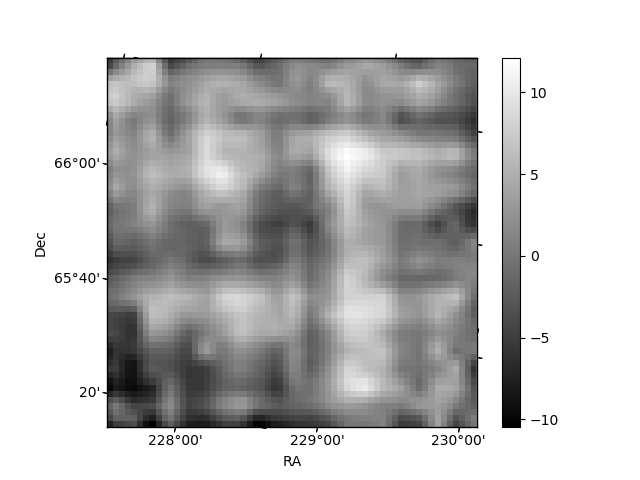
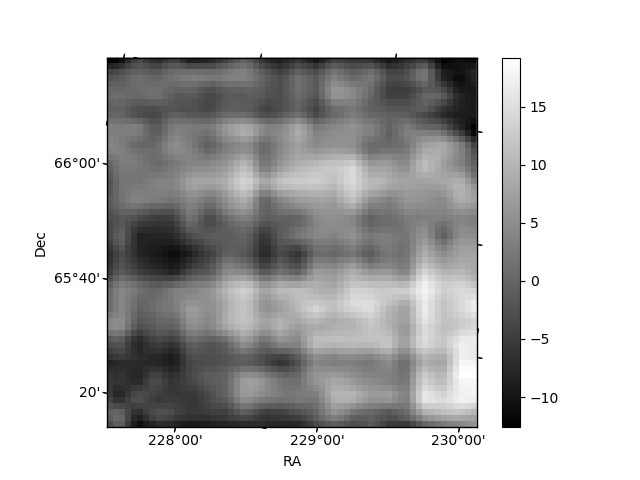
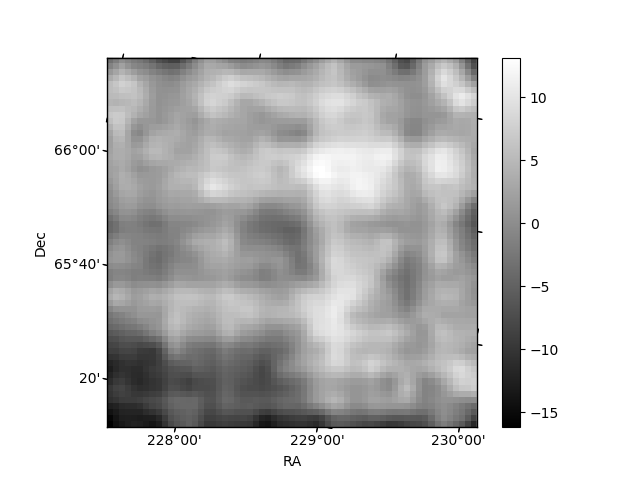
Histogram calculated using DETX and DETY for each event in the final _common_clean file
| Quadrant A | 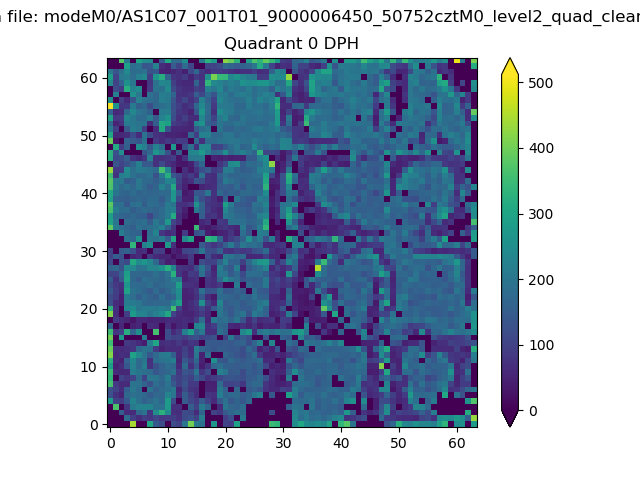 |
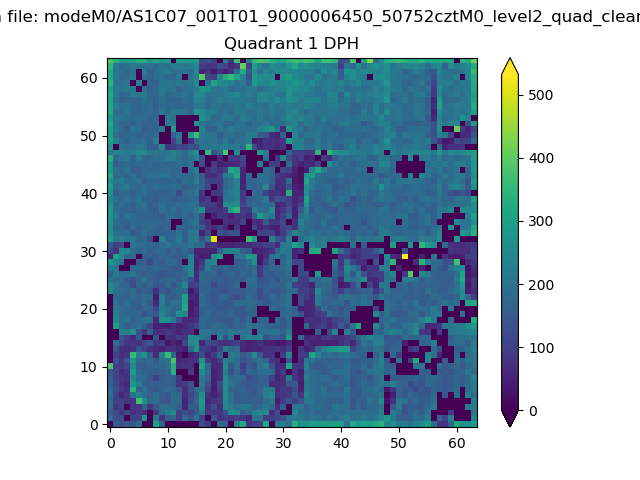 |
Quadrant B |
|---|---|---|---|
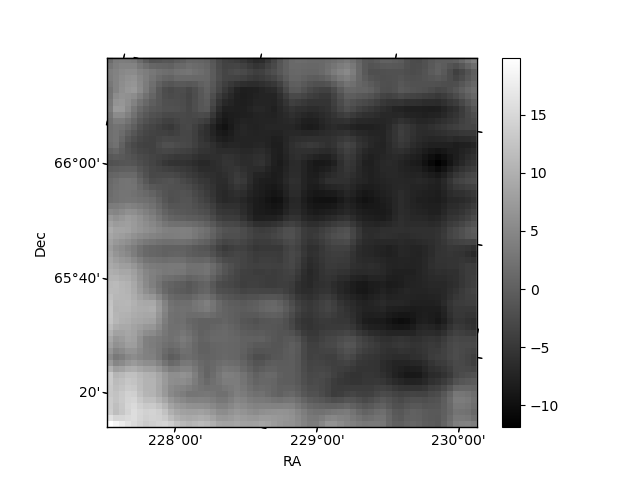
| Quadrant D | 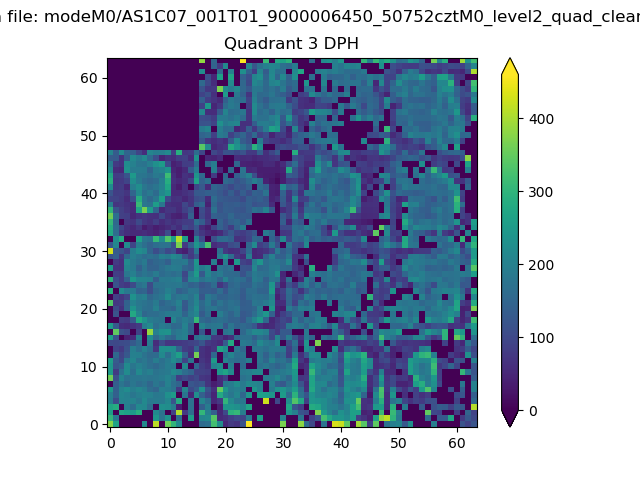 |
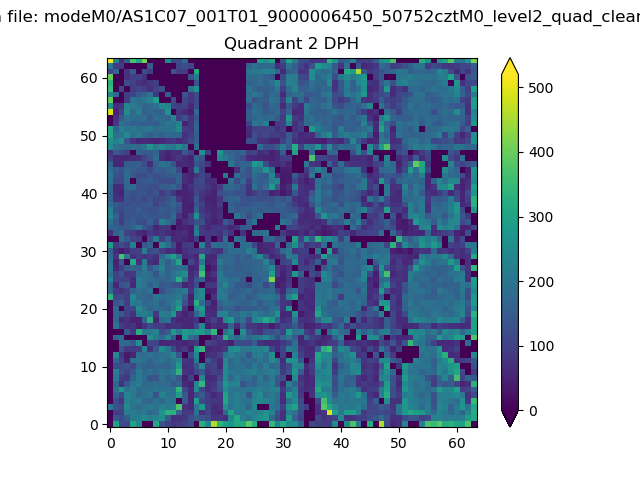 |
Quadrant C |
| Plot type | Count rate plots | Images |
|---|---|---|
| Comparison with Poisson distribution Blue bars denote a histogram of data divided into 1 sec bins. Red curve is a Poisson curve with rate = median count rate of data. |
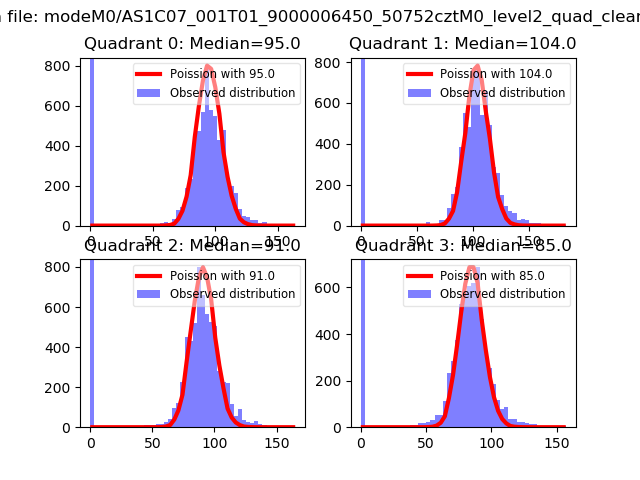 |
 |
| Quadrant-wise count rates Data is divided into 100 sec bins |
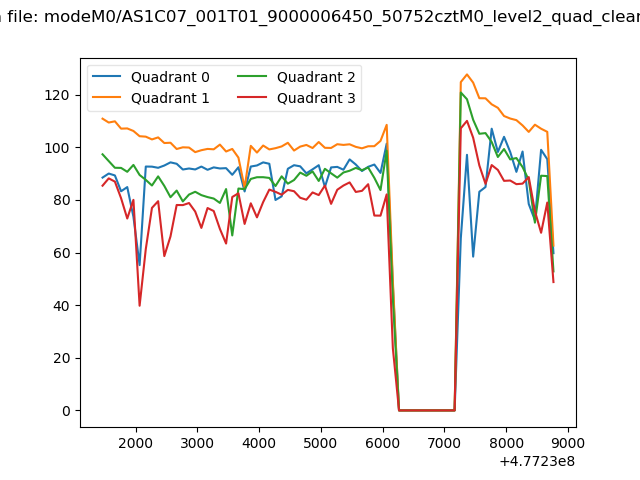 |
|
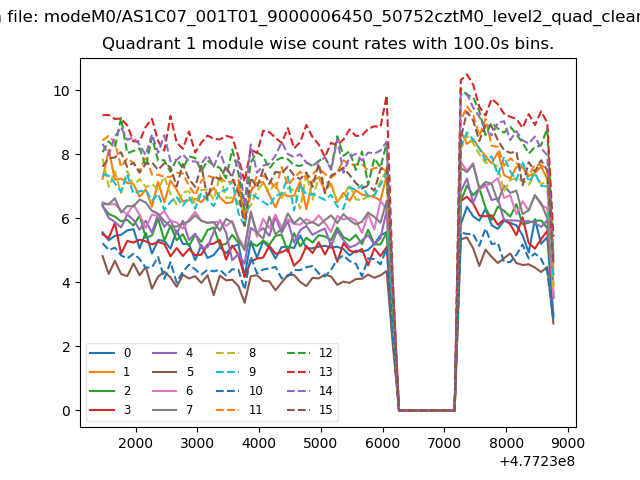
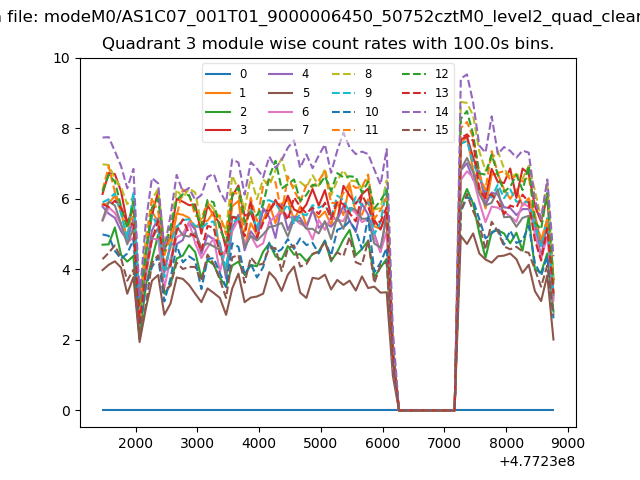
| Module-wise count rates for Quadrant A Data is divided into 100 sec bins |
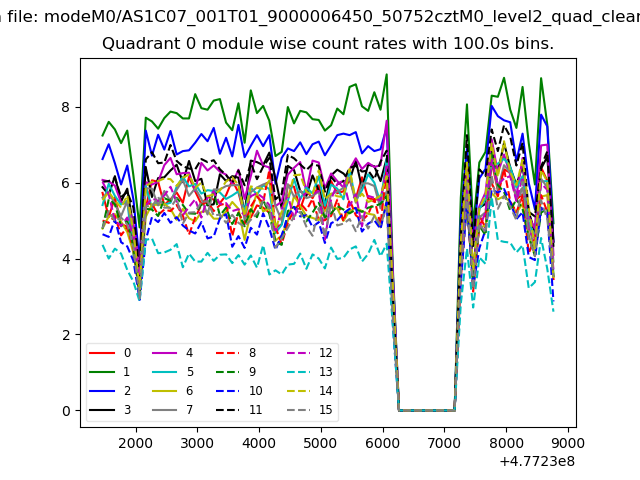 |
 |
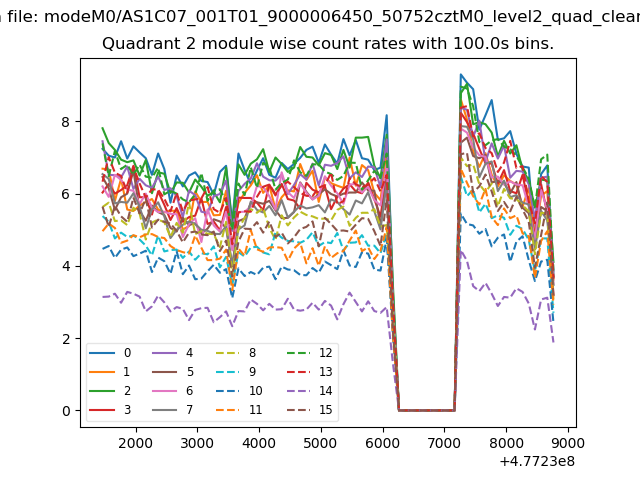
| Module-wise count rates for Quadrant B Data is divided into 100 sec bins |
 |
 |
| Module-wise count rates for Quadrant C Data is divided into 100 sec bins |
 |
 |
| Module-wise count rates for Quadrant D Data is divided into 100 sec bins |
 |
 |
| Parameter | Plot |
|---|---|
| CZT HV Monitor | 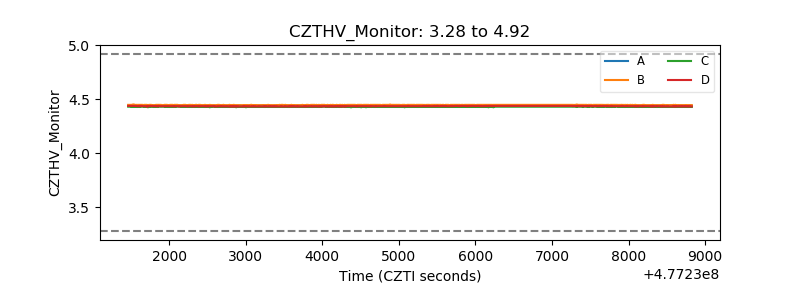 |
| D_VDD | 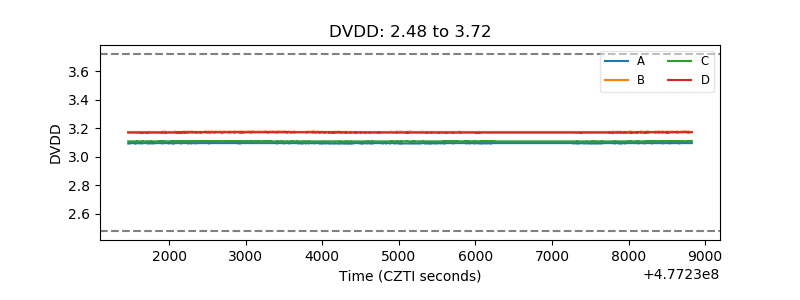 |
| Temperature 1 | 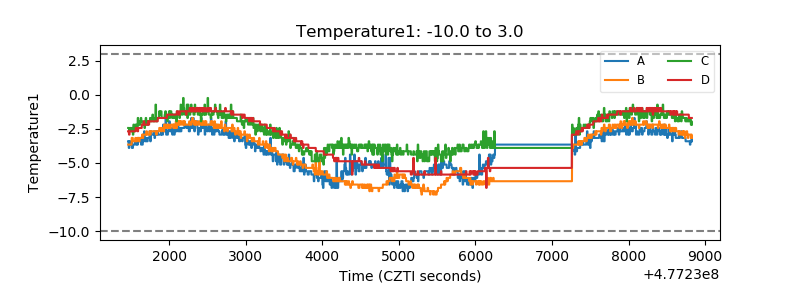 |
| Veto HV Monitor |  |
| Veto LLD | 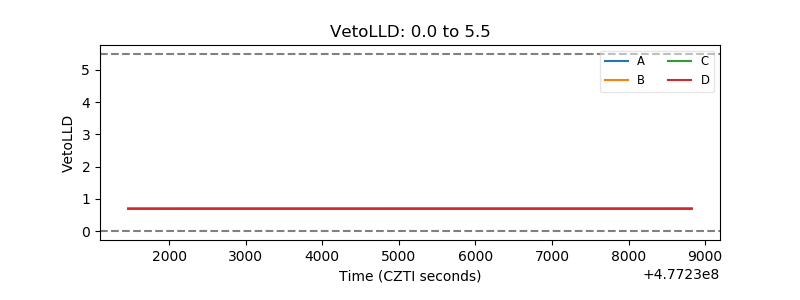 |
| Alpha Counter | 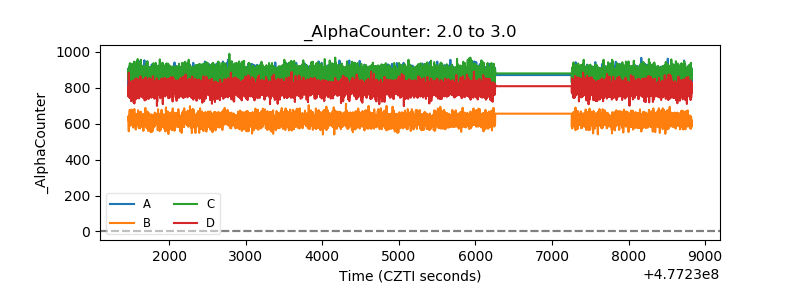 |
| _CPM_Rate | 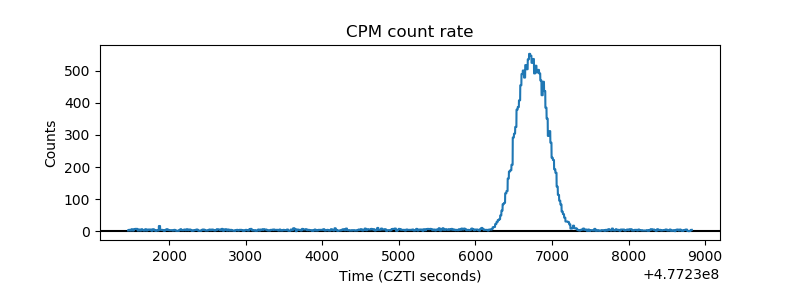 |
| CZT Counter | 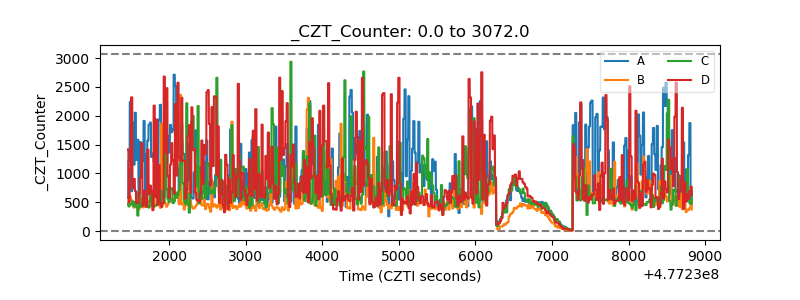 |
| +2.5 Volts monitor | 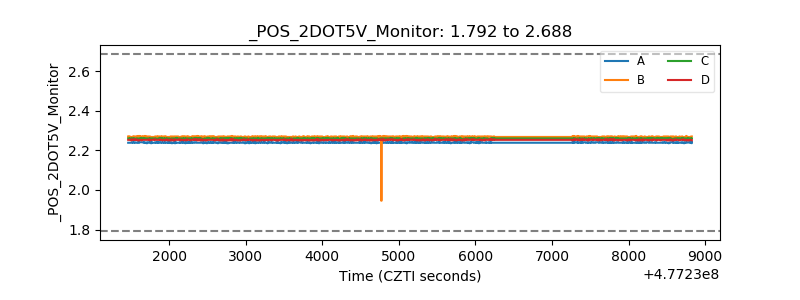 |
| +5 Volts monitor |  |
| _ROLL_ROT | 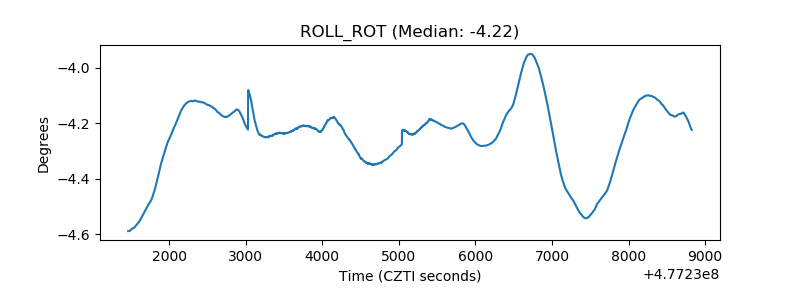 |
| _Roll_DEC | 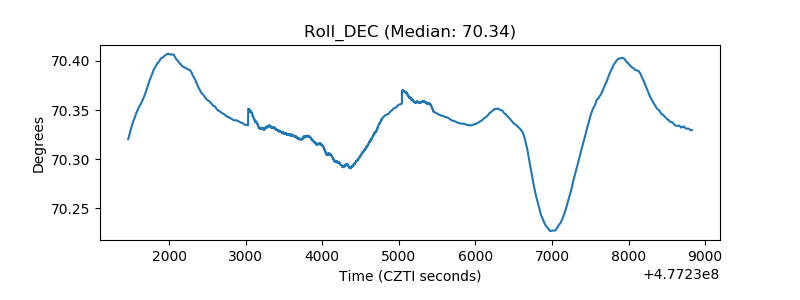 |
| _Roll_RA | 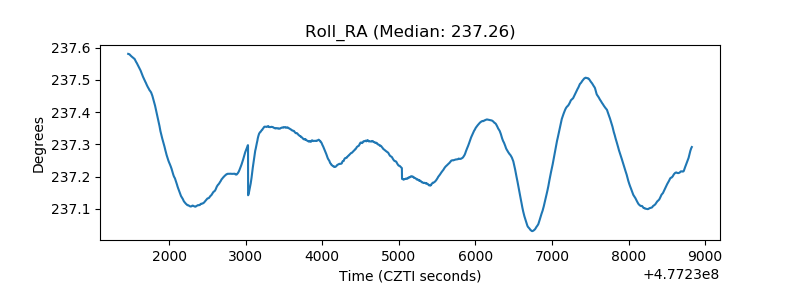 |
| Veto Counter | 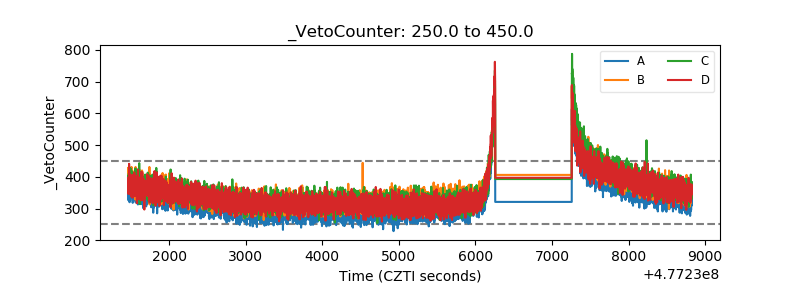 |