| Param | Original file | Final file |
|---|---|---|
| Filename | modeM0/AS1C07_001T01_9000006450_50753cztM0_level2.fits | modeM0/AS1C07_001T01_9000006450_50753cztM0_level2_quad_clean.evt |
| Size (bytes) | 516,781,440 | 93,556,800 |
| Size | 492.8 MB | 89.2 MB |
| Events in quadrant A | 5,053,829 | 598,563 |
| Events in quadrant B | 3,848,899 | 670,335 |
| Events in quadrant C | 4,552,328 | 584,345 |
| Events in quadrant D | 5,181,239 | 535,672 |
| Mode SS | |||
|---|---|---|---|
| Quadrant | BADHDUFLAG | Total packets | Discarded packets |
| A | 0 | 130 | 0 |
| B | 0 | 130 | 0 |
| C | 0 | 130 | 0 |
| D | 0 | 130 | 0 |
| Mode M0 | |||
|---|---|---|---|
| Quadrant | BADHDUFLAG | Total packets | Discarded packets |
| A | 0 | 19359 | 1 |
| B | 0 | 15832 | 1 |
| C | 0 | 17755 | 2 |
| D | 0 | 19780 | 1 |
| Mode M9 | |||
|---|---|---|---|
| Quadrant | BADHDUFLAG | Total packets | Discarded packets |
| A | 0 | 11 | 0 |
| B | 0 | 11 | 0 |
| C | 0 | 11 | 0 |
| D | 0 | 11 | 0 |
| Quadrant | Total seconds | Saturated seconds | Saturation percentage |
|---|---|---|---|
| A | 6358 | 441 | 6.936143% |
| B | 6358 | 222 | 3.491664% |
| C | 6358 | 327 | 5.143127% |
| D | 6358 | 426 | 6.700220% |
Noise dominated data is calculated using 1-second bins in cleaned event files. If a bin has >2000 counts, and if more than 50% of those come from <1% of pixels, then it is considered to be noise-dominated and hence unusable.
| Quadrant | # 1 sec bins | Bins with >0 counts | Bins with >2000 counts | High rate bins dominated by noise | Noise dominated (total time) | Noise dominated (detector-on time) | Marked lightcurve |
|---|---|---|---|---|---|---|---|
| A | 7458 | 6359 | 308 | 308 | 4.13% | 4.84% | 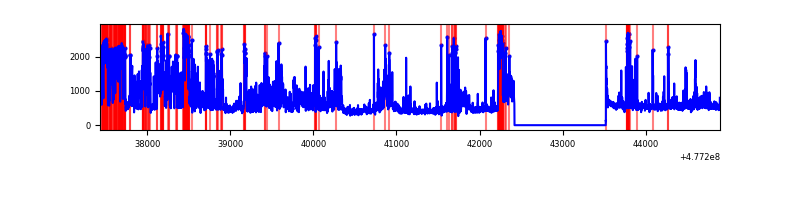 |
| B | 7458 | 6359 | 102 | 102 | 1.37% | 1.60% | 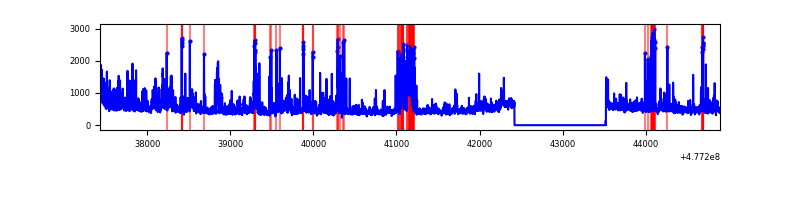 |
| C | 7458 | 6359 | 287 | 287 | 3.85% | 4.51% | 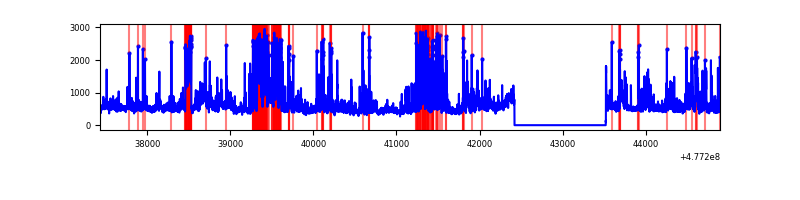 |
| D | 7457 | 6358 | 361 | 361 | 4.84% | 5.68% | 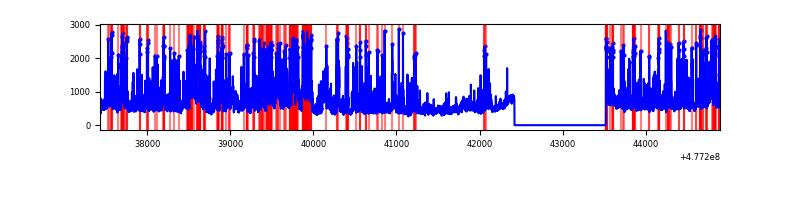 |
Top three noisy pixels from each quadrant. If the there are fewer than three noisy pixels in the level2.evt file, extra rows are filled as -1
| Pixel properties | Quadrant properties | ||||||
|---|---|---|---|---|---|---|---|
| Quadrant | DetID | PixID | Counts | Sigma | Mean | Median | Sigma |
| A | 4 | 4 | 1223558 | 7168.68 | 684 | 665 | 170.6 |
| A | 3 | 114 | 223099 | 1303.92 | 684 | 665 | 170.6 |
| A | 4 | 3 | 210252 | 1228.61 | 684 | 665 | 170.6 |
| B | 0 | 213 | 233090 | 1596.91 | 690 | 664 | 145.5 |
| B | 10 | 247 | 200641 | 1373.97 | 690 | 664 | 145.5 |
| B | 7 | 0 | 198512 | 1359.34 | 690 | 664 | 145.5 |
| C | 15 | 198 | 486290 | 2673.29 | 672 | 667 | 181.7 |
| C | 5 | 10 | 481297 | 2645.81 | 672 | 667 | 181.7 |
| C | 13 | 3 | 302217 | 1660.0 | 672 | 667 | 181.7 |
| D | 2 | 216 | 750437 | 4030.12 | 664 | 642 | 186.0 |
| D | 15 | 93 | 502984 | 2700.07 | 664 | 642 | 186.0 |
| D | 2 | 249 | 311416 | 1670.4 | 664 | 642 | 186.0 |
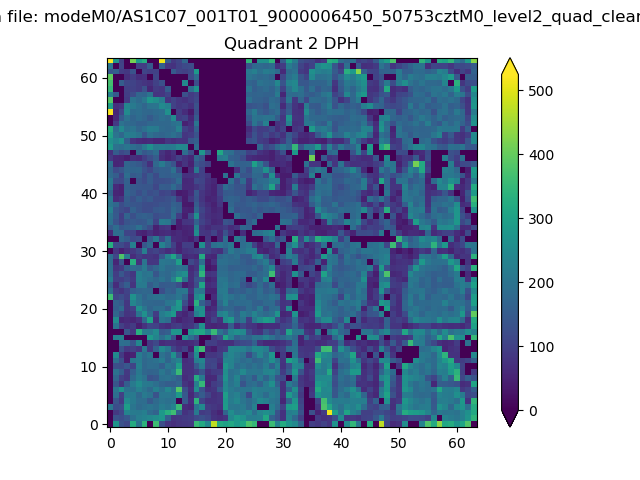
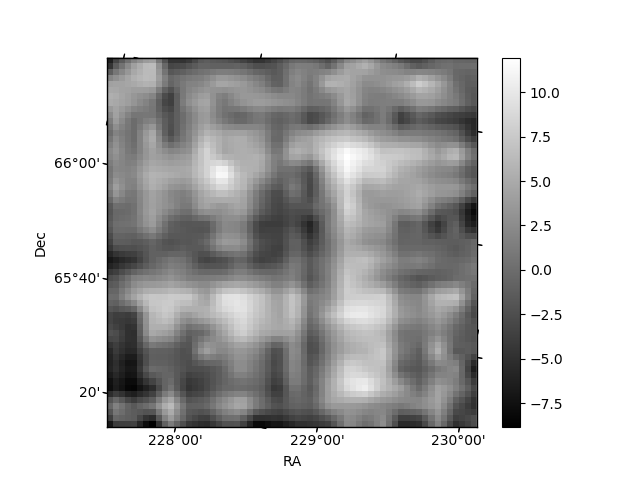
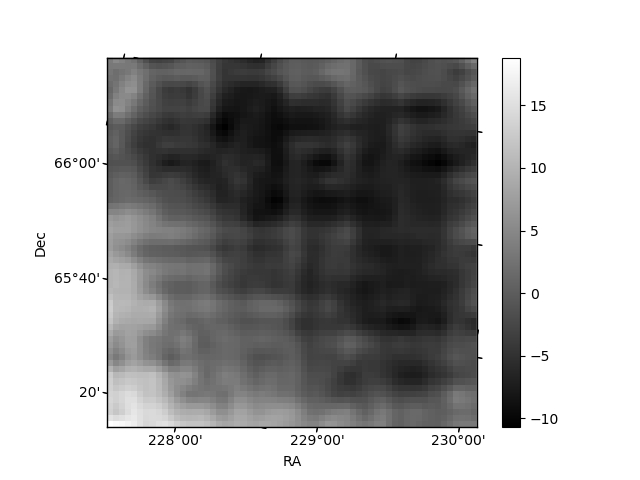
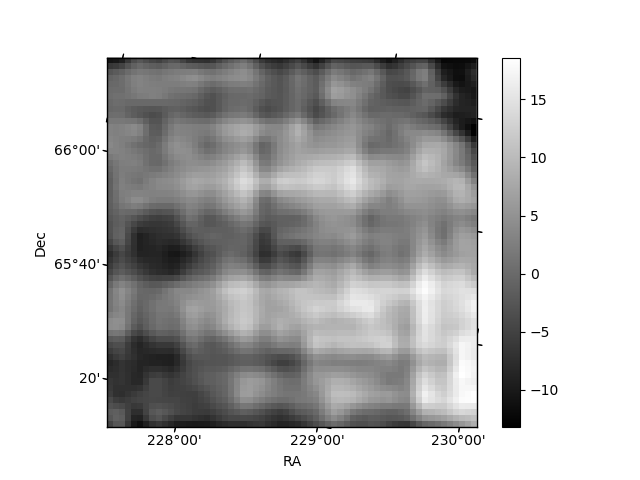
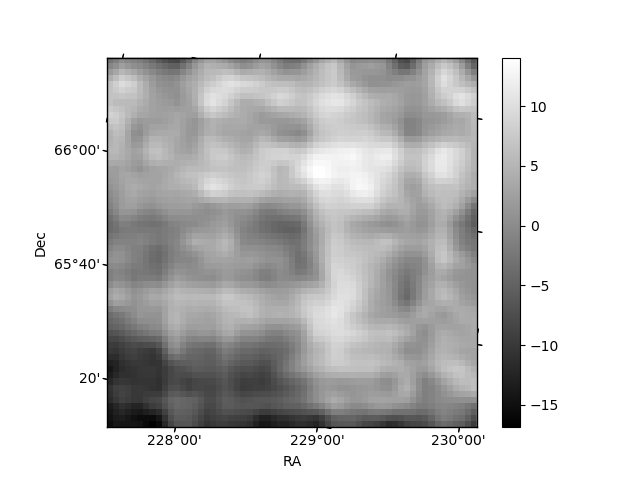
Histogram calculated using DETX and DETY for each event in the final _common_clean file
| Quadrant A | 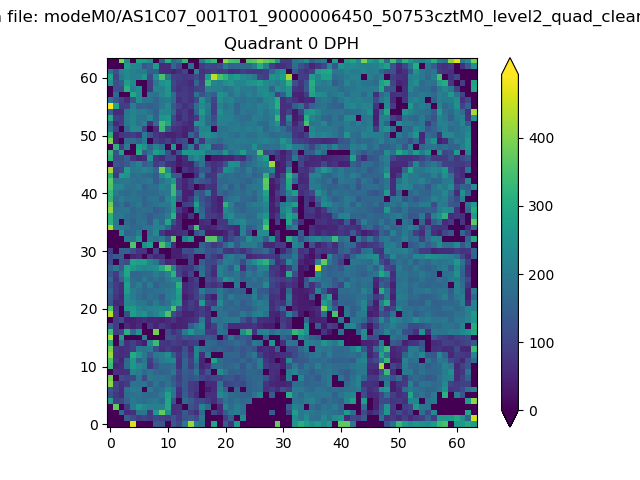 |
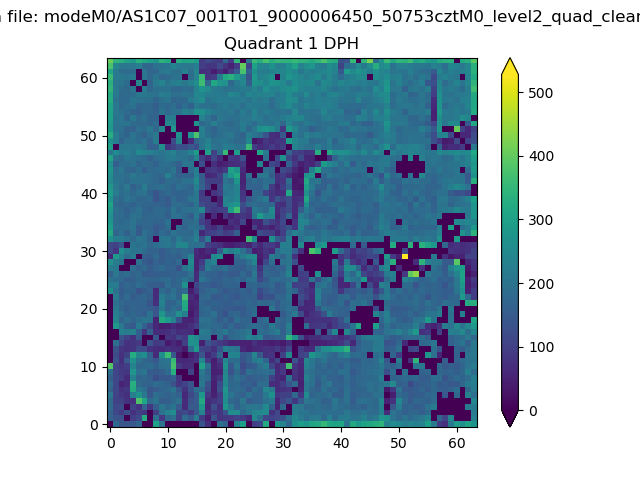 |
Quadrant B |
|---|---|---|---|
| Quadrant D | 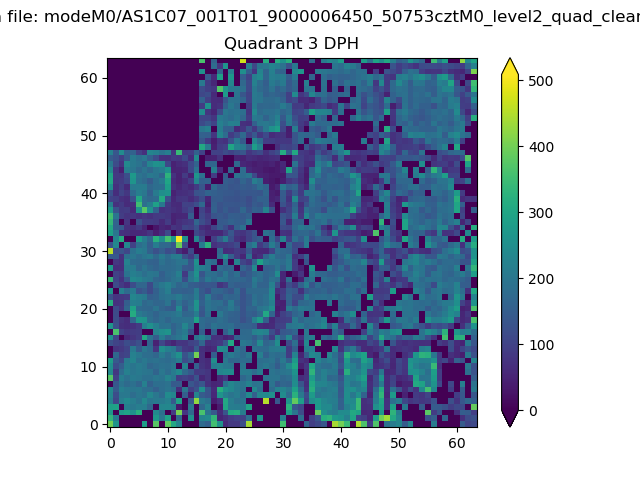 |
 |
Quadrant C |
| Plot type | Count rate plots | Images |
|---|---|---|
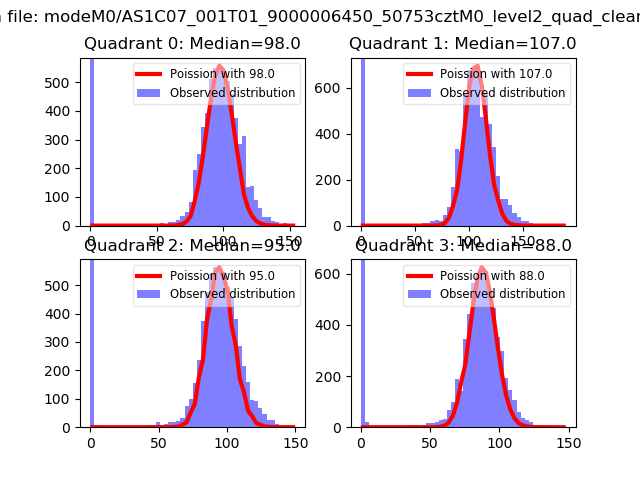
| Comparison with Poisson distribution Blue bars denote a histogram of data divided into 1 sec bins. Red curve is a Poisson curve with rate = median count rate of data. |
 |
 |
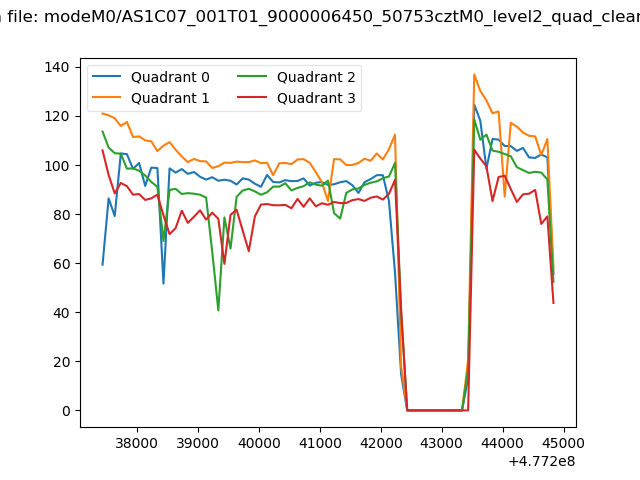
| Quadrant-wise count rates Data is divided into 100 sec bins |
 |
|
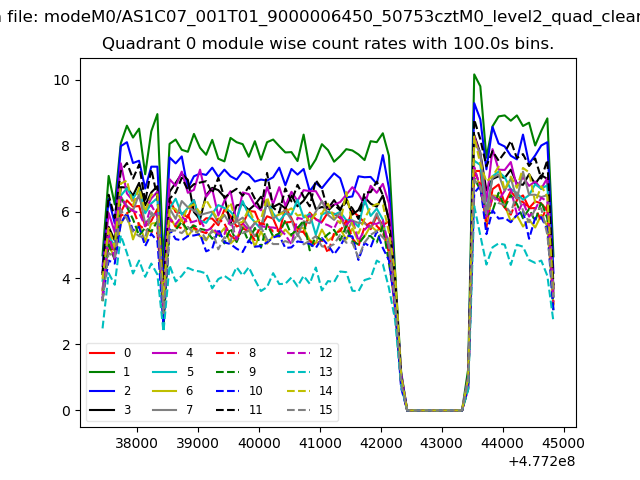
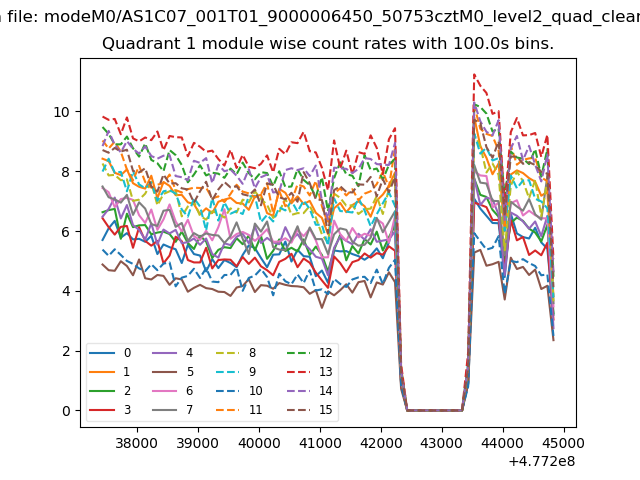
| Module-wise count rates for Quadrant A Data is divided into 100 sec bins |
 |
 |
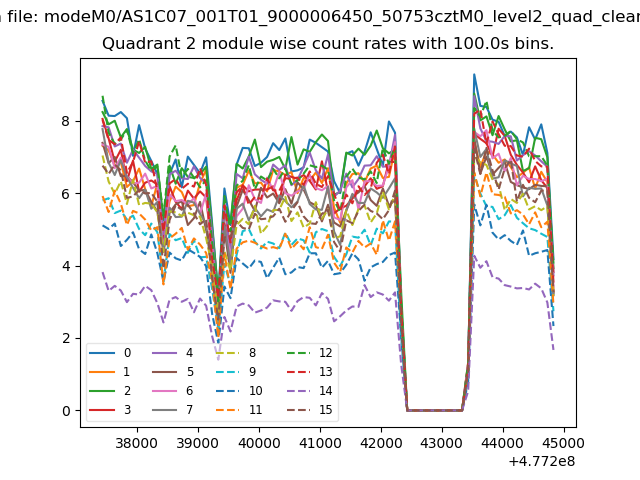
| Module-wise count rates for Quadrant B Data is divided into 100 sec bins |
 |
 |
| Module-wise count rates for Quadrant C Data is divided into 100 sec bins |
 |
 |
| Module-wise count rates for Quadrant D Data is divided into 100 sec bins |
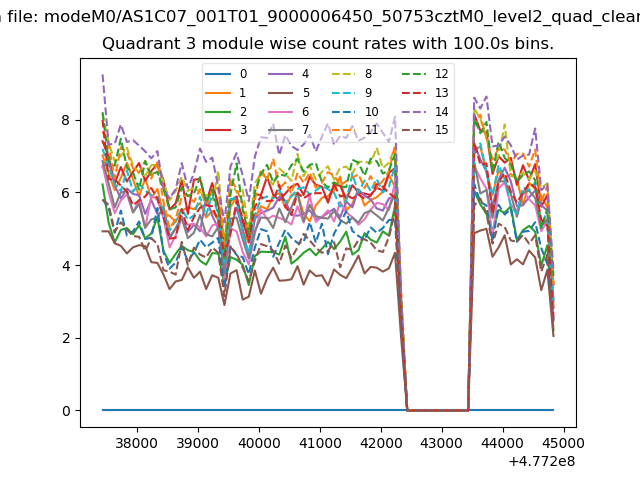 |
 |
| Parameter | Plot |
|---|---|
| CZT HV Monitor |  |
| D_VDD | 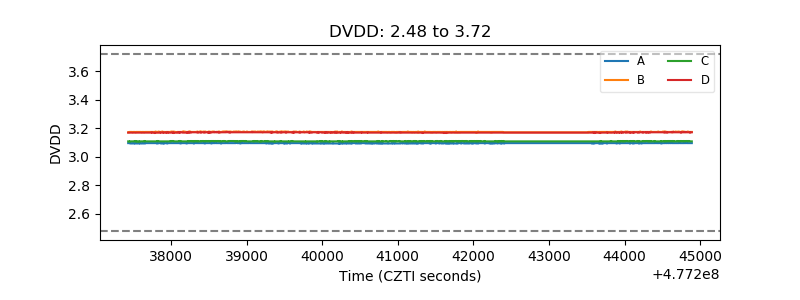 |
| Temperature 1 | 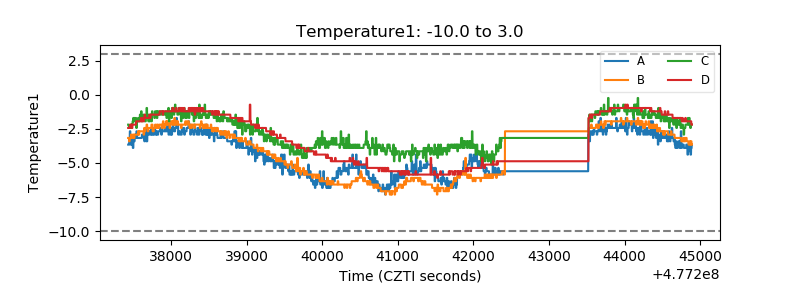 |
| Veto HV Monitor | 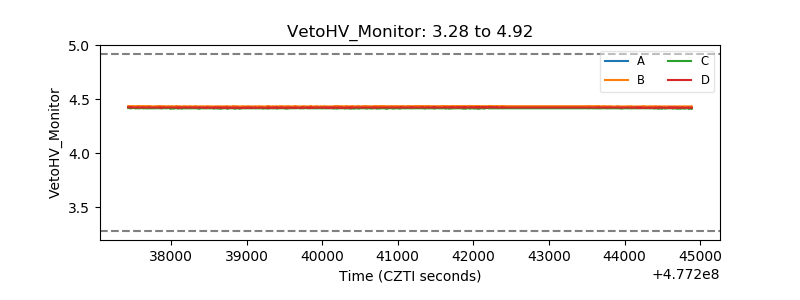 |
| Veto LLD | 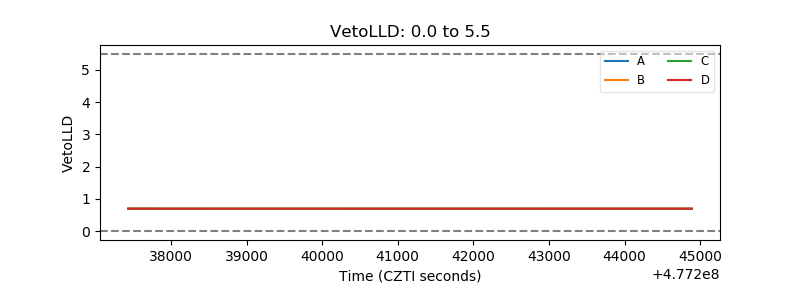 |
| Alpha Counter | 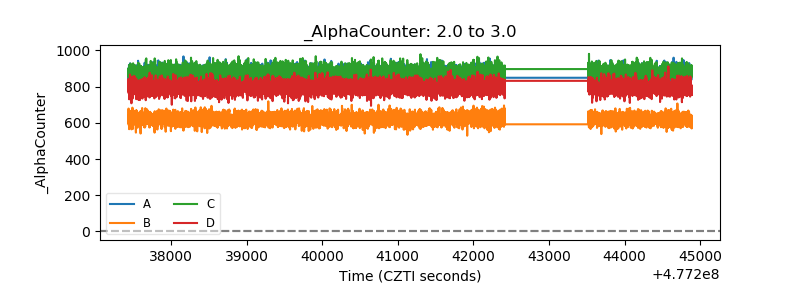 |
| _CPM_Rate | 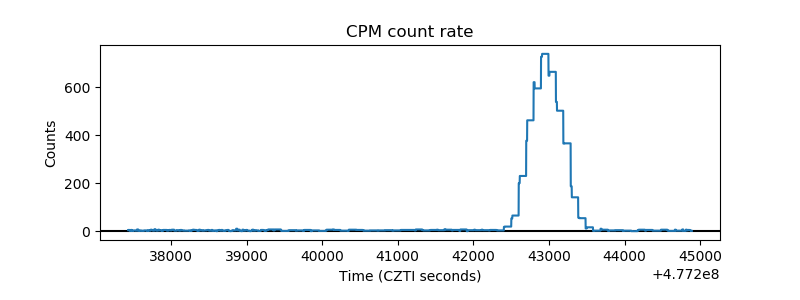 |
| CZT Counter | 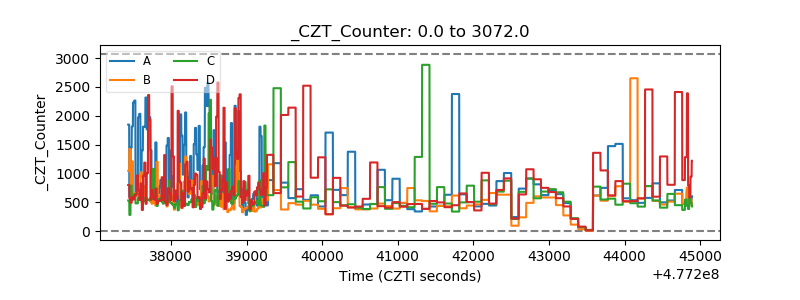 |
| +2.5 Volts monitor | 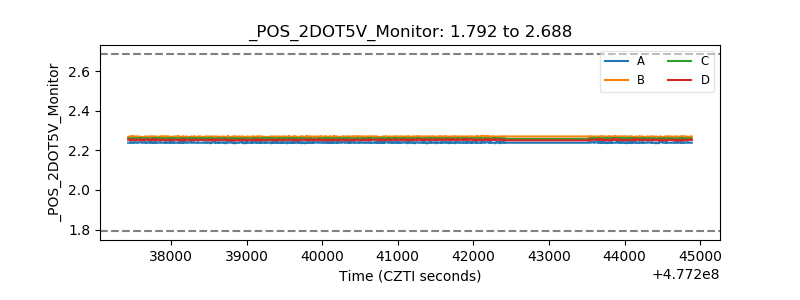 |
| +5 Volts monitor | 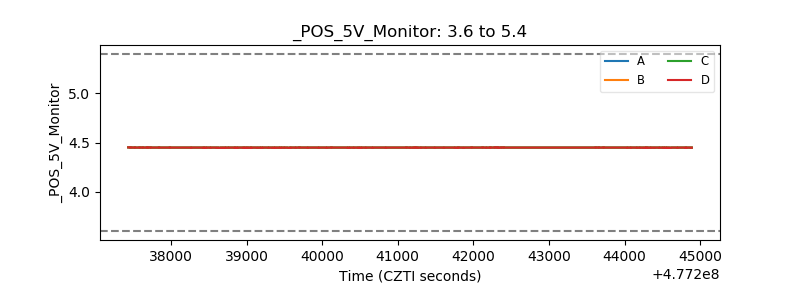 |
| _ROLL_ROT | 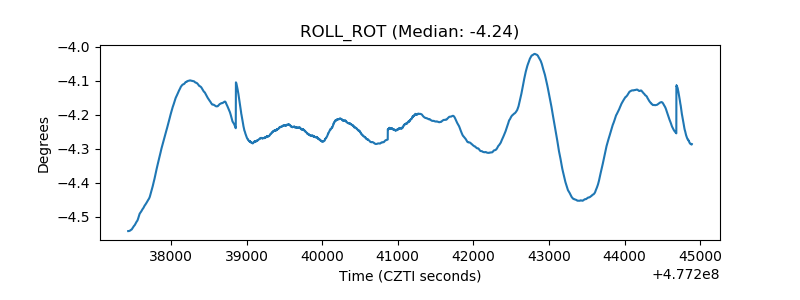 |
| _Roll_DEC | 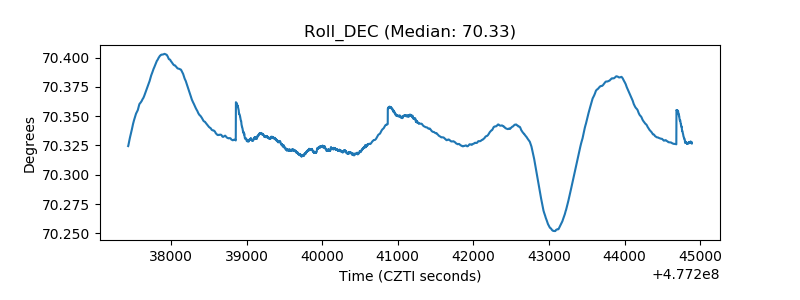 |
| _Roll_RA | 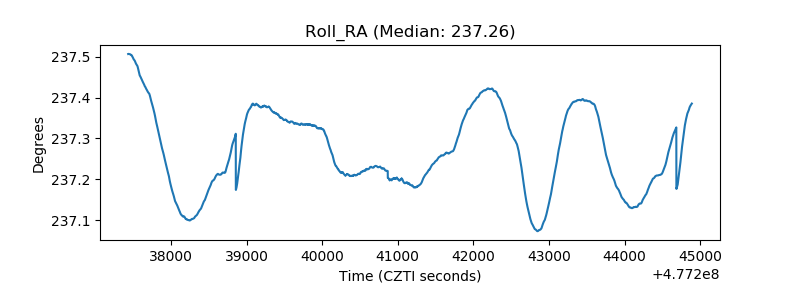 |
| Veto Counter | 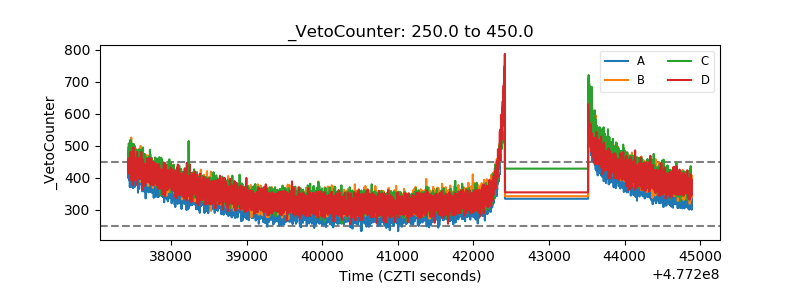 |