| Param | Original file | Final file |
|---|---|---|
| Filename | modeM0/AS1C07_001T01_9000006450_50754cztM0_level2.fits | modeM0/AS1C07_001T01_9000006450_50754cztM0_level2_quad_clean.evt |
| Size (bytes) | 484,557,120 | 89,478,720 |
| Size | 462.1 MB | 85.3 MB |
| Events in quadrant A | 3,623,093 | 594,399 |
| Events in quadrant B | 3,265,857 | 644,061 |
| Events in quadrant C | 4,703,397 | 552,689 |
| Events in quadrant D | 5,873,617 | 494,791 |
| Mode SS | |||
|---|---|---|---|
| Quadrant | BADHDUFLAG | Total packets | Discarded packets |
| A | 0 | 126 | 0 |
| B | 0 | 126 | 2 |
| C | 0 | 126 | 4 |
| D | 0 | 126 | 2 |
| Mode M0 | |||
|---|---|---|---|
| Quadrant | BADHDUFLAG | Total packets | Discarded packets |
| A | 0 | 15295 | 467 |
| B | 0 | 14224 | 321 |
| C | 0 | 18449 | 349 |
| D | 0 | 22185 | 518 |
| Mode M9 | |||
|---|---|---|---|
| Quadrant | BADHDUFLAG | Total packets | Discarded packets |
| A | 0 | 12 | 0 |
| B | 0 | 12 | 0 |
| C | 0 | 12 | 0 |
| D | 0 | 12 | 0 |
| Quadrant | Total seconds | Saturated seconds | Saturation percentage |
|---|---|---|---|
| A | 6063 | 120 | 1.979218% |
| B | 6067 | 176 | 2.900940% |
| C | 6060 | 404 | 6.666667% |
| D | 6055 | 631 | 10.421140% |
Noise dominated data is calculated using 1-second bins in cleaned event files. If a bin has >2000 counts, and if more than 50% of those come from <1% of pixels, then it is considered to be noise-dominated and hence unusable.
| Quadrant | # 1 sec bins | Bins with >0 counts | Bins with >2000 counts | High rate bins dominated by noise | Noise dominated (total time) | Noise dominated (detector-on time) | Marked lightcurve |
|---|---|---|---|---|---|---|---|
| A | 7317 | 6098 | 23 | 23 | 0.31% | 0.38% | 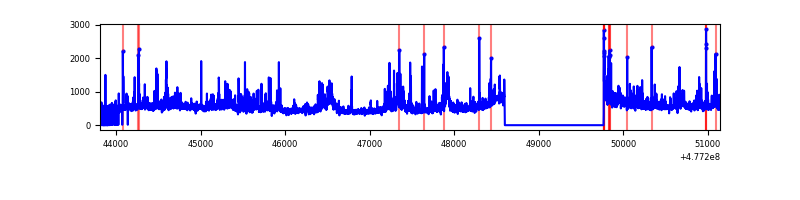 |
| B | 7328 | 6100 | 71 | 71 | 0.97% | 1.16% | 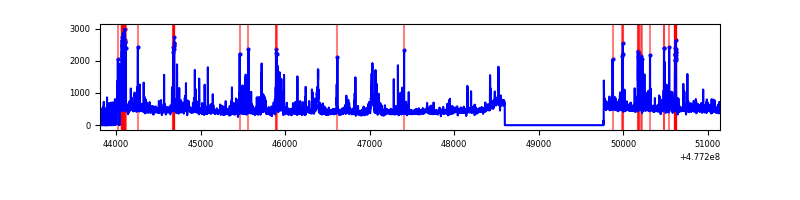 |
| C | 7333 | 6098 | 316 | 316 | 4.31% | 5.18% | 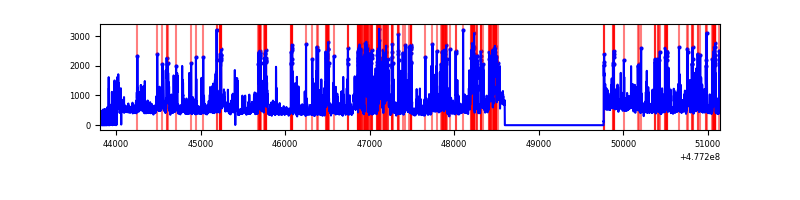 |
| D | 7323 | 6087 | 553 | 553 | 7.55% | 9.08% | 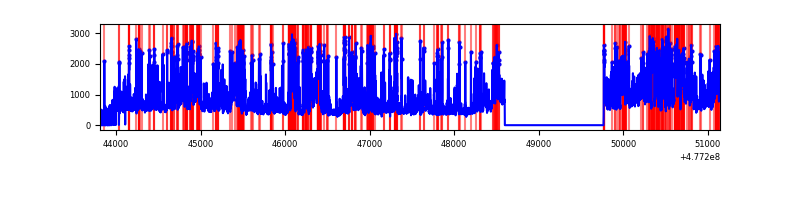 |
Top three noisy pixels from each quadrant. If the there are fewer than three noisy pixels in the level2.evt file, extra rows are filled as -1
| Pixel properties | Quadrant properties | ||||||
|---|---|---|---|---|---|---|---|
| Quadrant | DetID | PixID | Counts | Sigma | Mean | Median | Sigma |
| A | 4 | 3 | 262376 | 1599.73 | 661 | 645 | 163.6 |
| A | 6 | 195 | 145609 | 886.04 | 661 | 645 | 163.6 |
| A | 14 | 254 | 88273 | 535.59 | 661 | 645 | 163.6 |
| B | 10 | 247 | 178748 | 1279.91 | 658 | 635 | 139.2 |
| B | 7 | 0 | 104460 | 746.08 | 658 | 635 | 139.2 |
| B | 5 | 172 | 93330 | 666.1 | 658 | 635 | 139.2 |
| C | 13 | 3 | 1025628 | 5885.85 | 638 | 634 | 174.1 |
| C | 5 | 10 | 382570 | 2193.2 | 638 | 634 | 174.1 |
| C | 12 | 252 | 139927 | 799.87 | 638 | 634 | 174.1 |
| D | 2 | 216 | 974398 | 5741.78 | 620 | 599 | 169.6 |
| D | 15 | 174 | 646816 | 3810.27 | 620 | 599 | 169.6 |
| D | 15 | 93 | 545861 | 3215.01 | 620 | 599 | 169.6 |
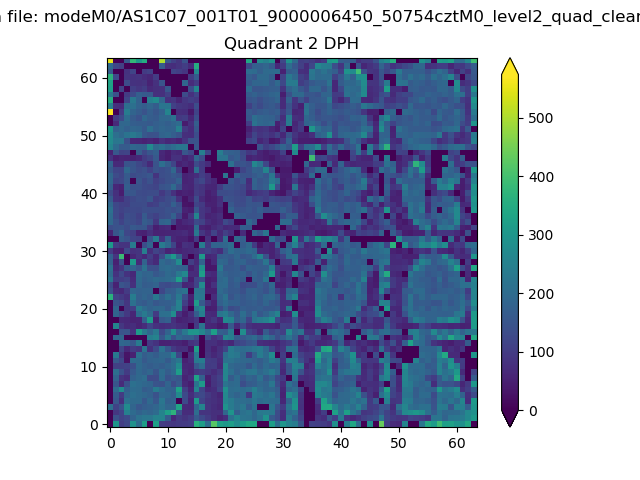
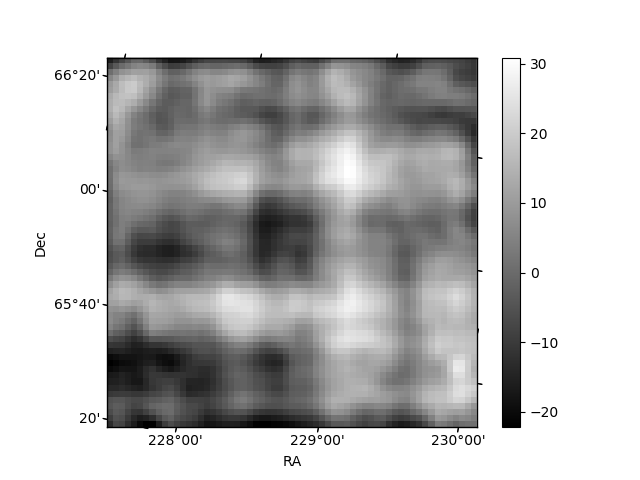
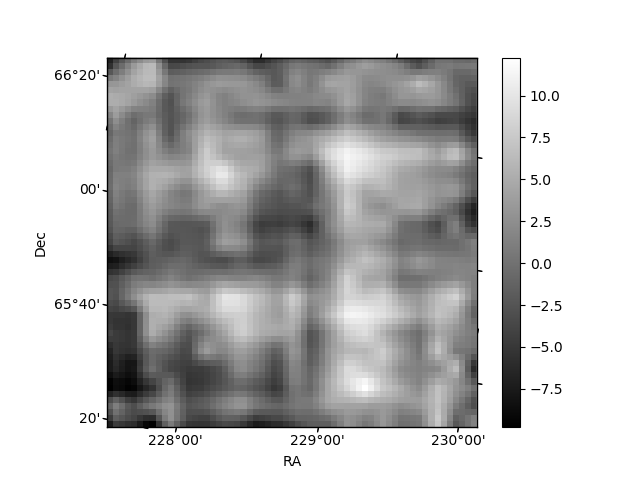
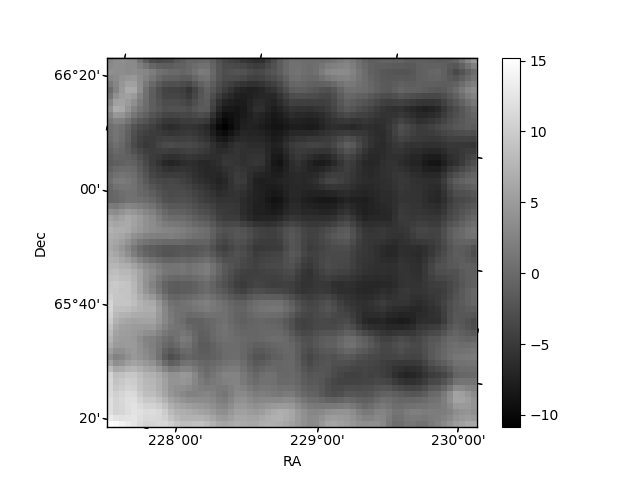
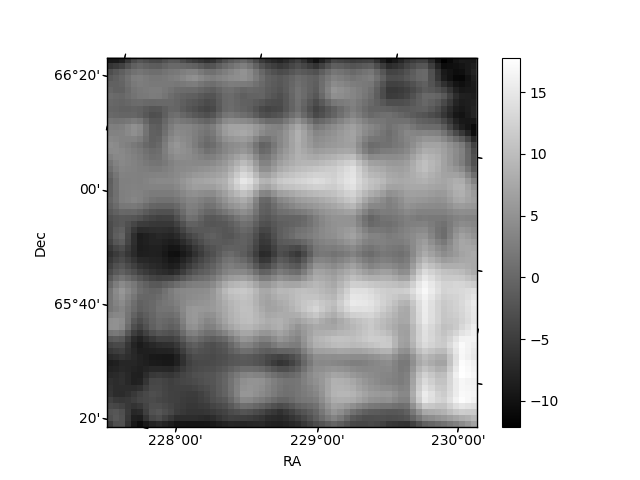
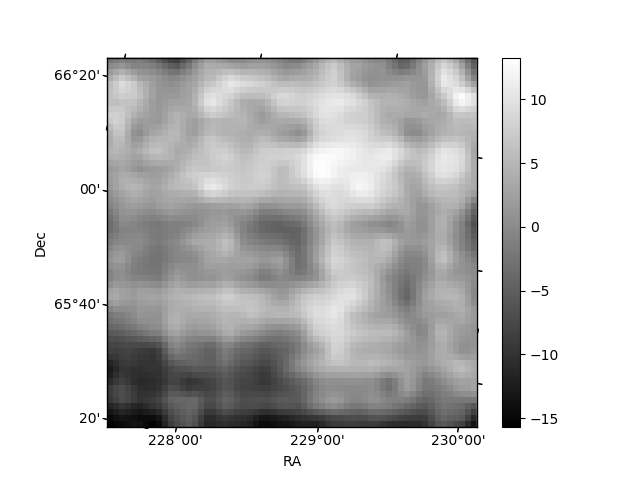
Histogram calculated using DETX and DETY for each event in the final _common_clean file
| Quadrant A | 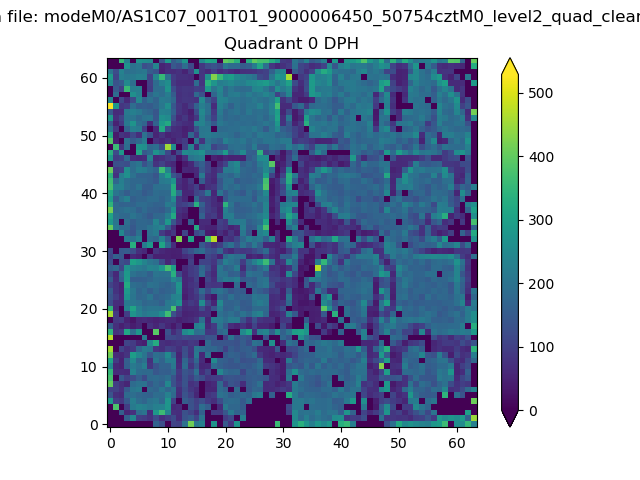 |
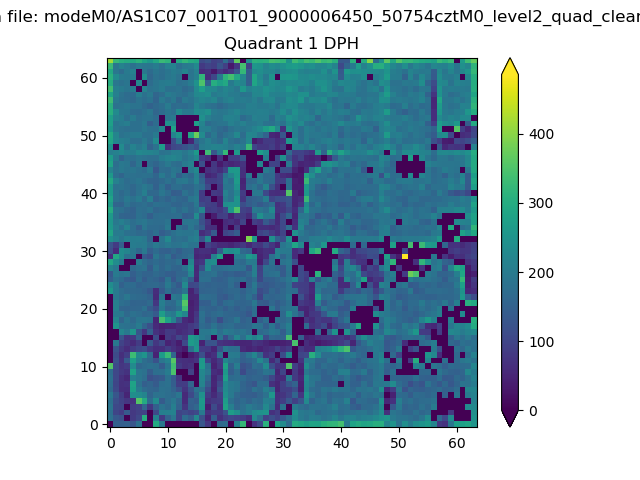 |
Quadrant B |
|---|---|---|---|
| Quadrant D | 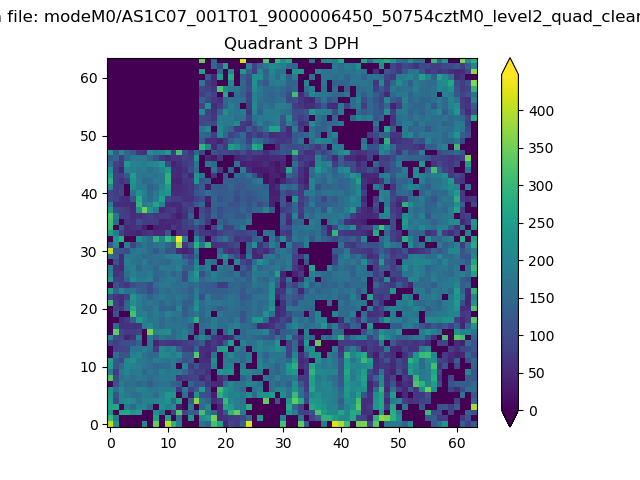 |
 |
Quadrant C |
| Plot type | Count rate plots | Images |
|---|---|---|
| Comparison with Poisson distribution Blue bars denote a histogram of data divided into 1 sec bins. Red curve is a Poisson curve with rate = median count rate of data. |
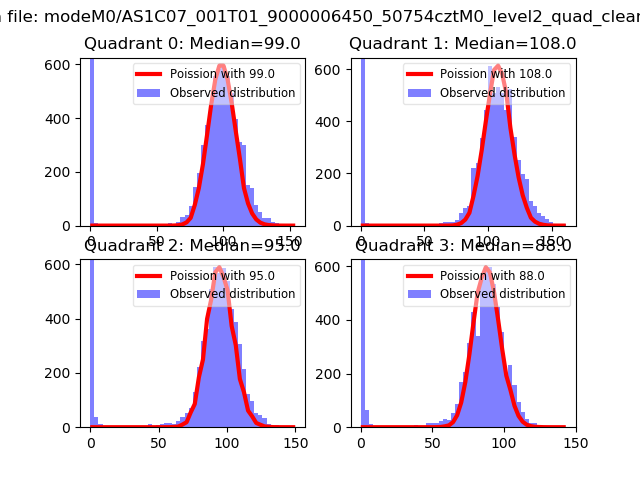 |
 |
| Quadrant-wise count rates Data is divided into 100 sec bins |
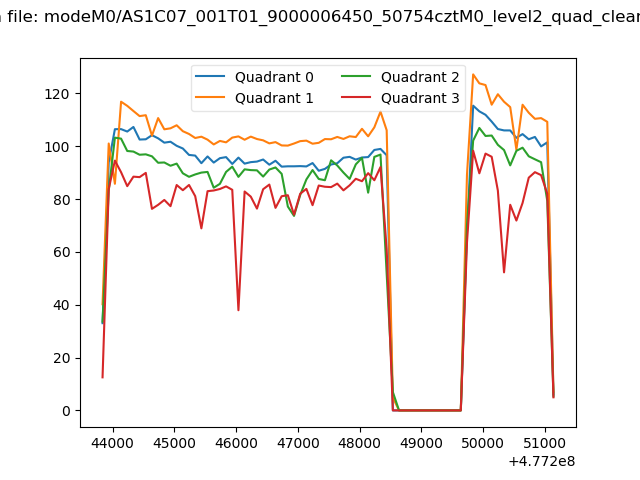 |
|
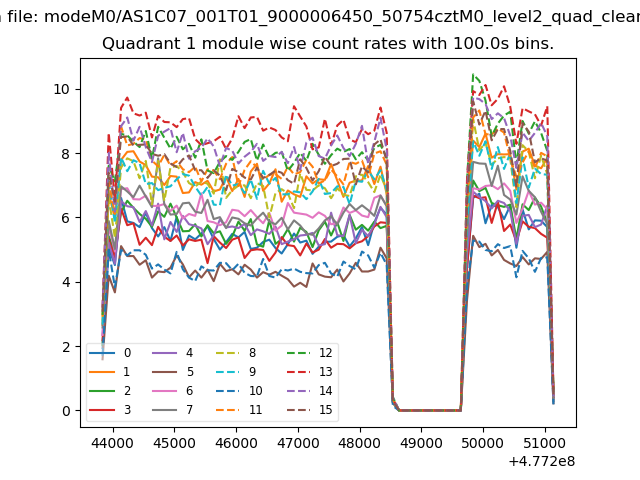
| Module-wise count rates for Quadrant A Data is divided into 100 sec bins |
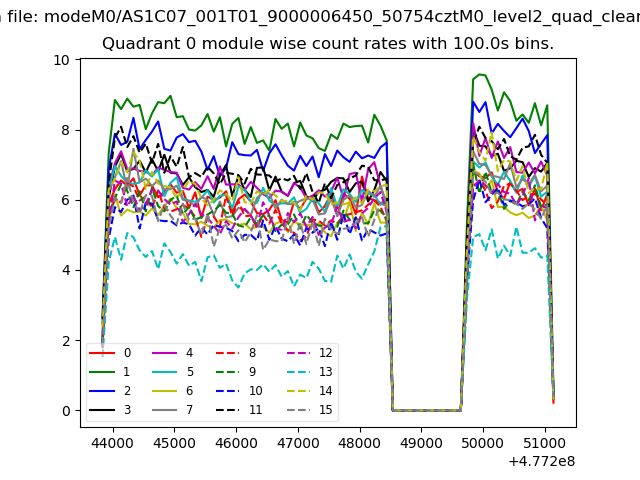 |
 |
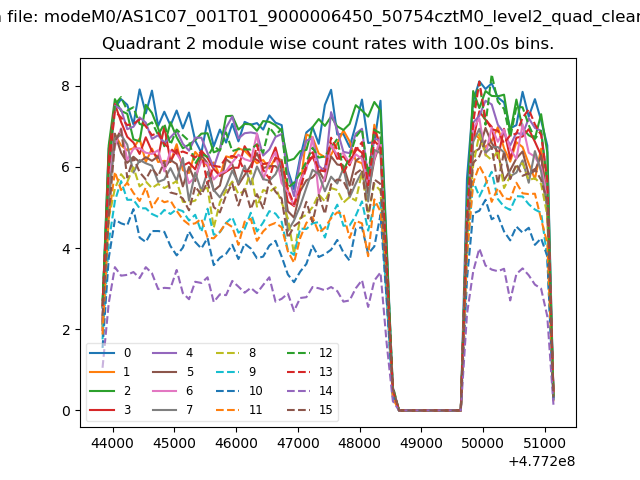
| Module-wise count rates for Quadrant B Data is divided into 100 sec bins |
 |
 |
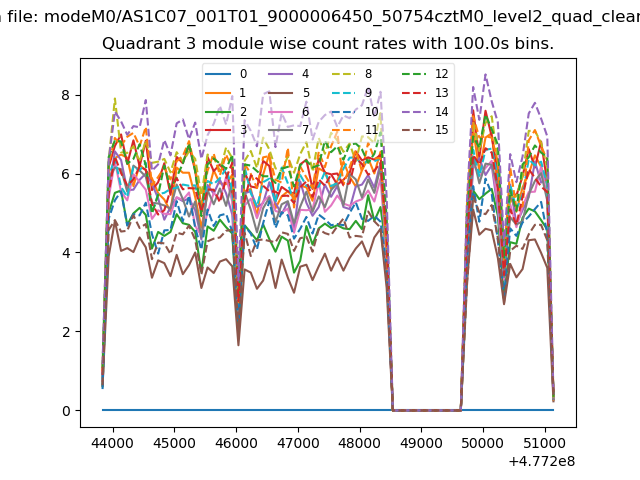
| Module-wise count rates for Quadrant C Data is divided into 100 sec bins |
 |
 |
| Module-wise count rates for Quadrant D Data is divided into 100 sec bins |
 |
 |
| Parameter | Plot |
|---|---|
| CZT HV Monitor | 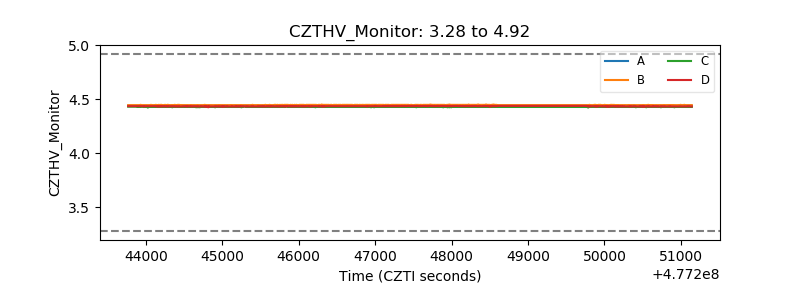 |
| D_VDD |  |
| Temperature 1 | 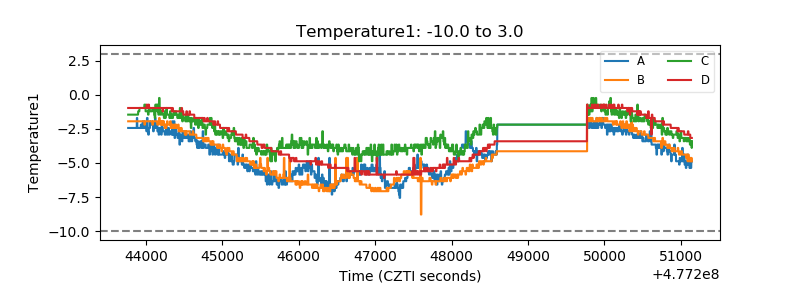 |
| Veto HV Monitor | 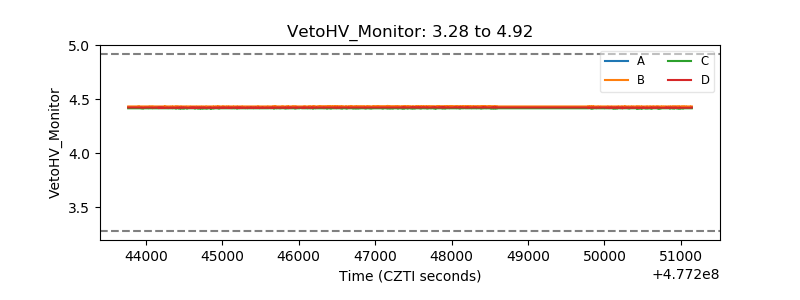 |
| Veto LLD | 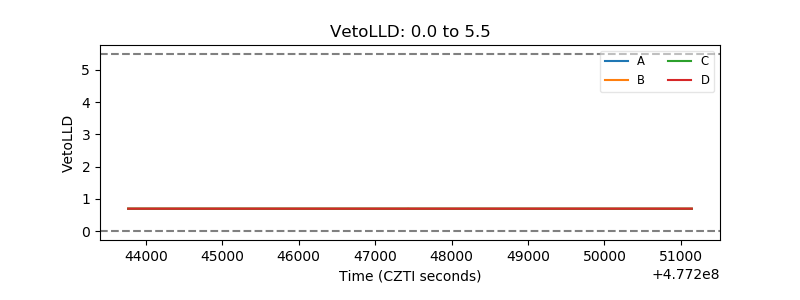 |
| Alpha Counter | 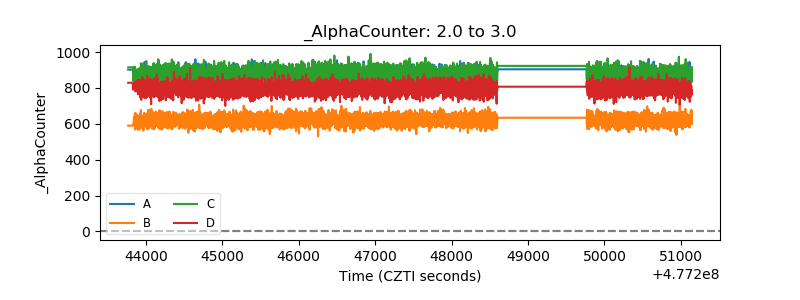 |
| _CPM_Rate | 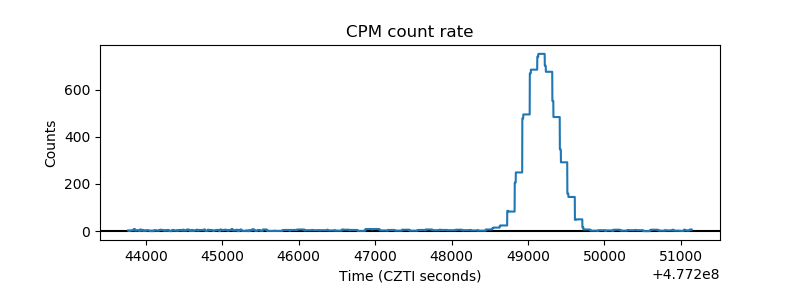 |
| CZT Counter | 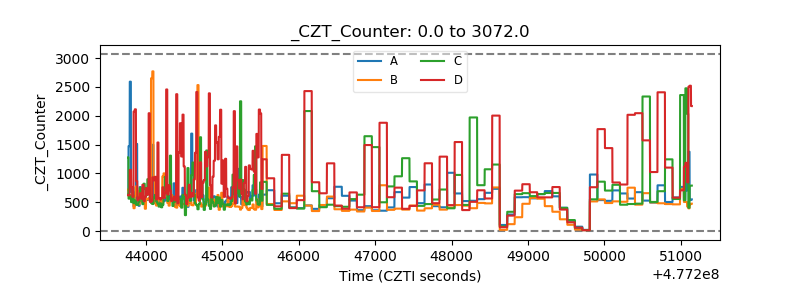 |
| +2.5 Volts monitor | 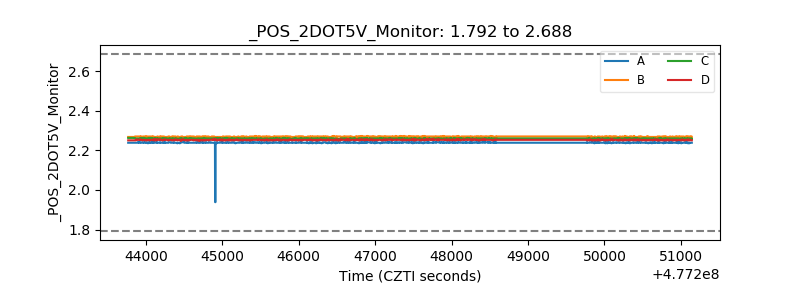 |
| +5 Volts monitor |  |
| _ROLL_ROT | 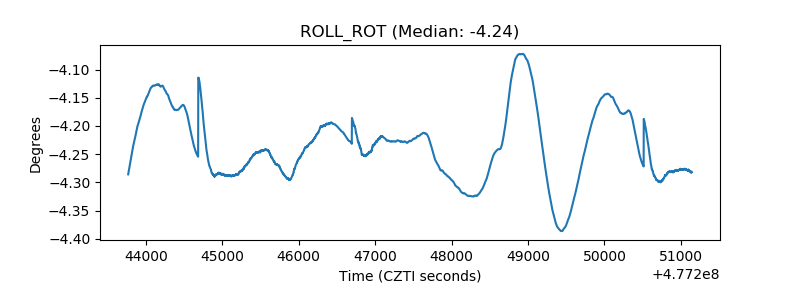 |
| _Roll_DEC | 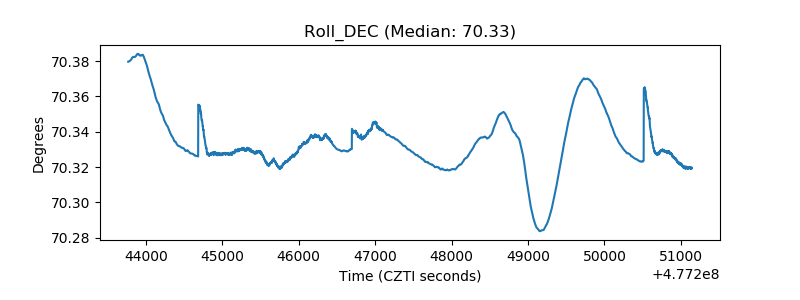 |
| _Roll_RA | 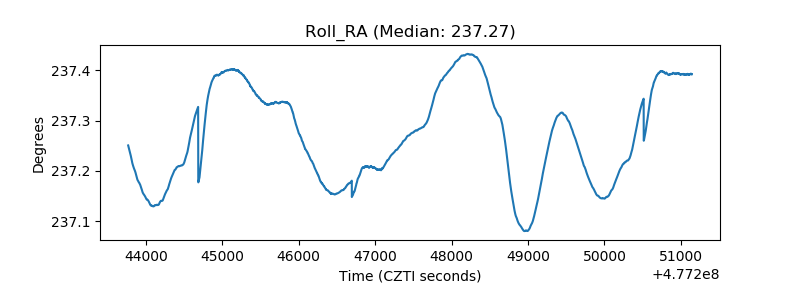 |
| Veto Counter | 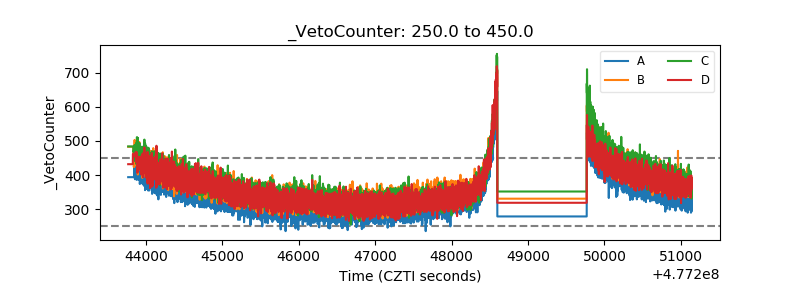 |