| Param | Original file | Final file |
|---|---|---|
| Filename | modeM0/AS1C07_001T01_9000006450_50755cztM0_level2.fits | modeM0/AS1C07_001T01_9000006450_50755cztM0_level2_quad_clean.evt |
| Size (bytes) | 520,931,520 | 90,702,720 |
| Size | 496.8 MB | 86.5 MB |
| Events in quadrant A | 4,276,581 | 602,754 |
| Events in quadrant B | 3,499,878 | 650,296 |
| Events in quadrant C | 4,411,094 | 567,561 |
| Events in quadrant D | 6,616,095 | 494,012 |
| Mode SS | |||
|---|---|---|---|
| Quadrant | BADHDUFLAG | Total packets | Discarded packets |
| A | 0 | 128 | 2 |
| B | 0 | 128 | 2 |
| C | 0 | 128 | 2 |
| D | 0 | 128 | 2 |
| Mode M0 | |||
|---|---|---|---|
| Quadrant | BADHDUFLAG | Total packets | Discarded packets |
| A | 0 | 17203 | 281 |
| B | 0 | 14894 | 213 |
| C | 0 | 17725 | 270 |
| D | 0 | 24472 | 487 |
| Mode M9 | |||
|---|---|---|---|
| Quadrant | BADHDUFLAG | Total packets | Discarded packets |
| A | 0 | 11 | 0 |
| B | 0 | 11 | 0 |
| C | 0 | 11 | 0 |
| D | 0 | 11 | 0 |
| Quadrant | Total seconds | Saturated seconds | Saturation percentage |
|---|---|---|---|
| A | 6184 | 196 | 3.169470% |
| B | 6193 | 256 | 4.133699% |
| C | 6186 | 383 | 6.191400% |
| D | 6170 | 816 | 13.225284% |
Noise dominated data is calculated using 1-second bins in cleaned event files. If a bin has >2000 counts, and if more than 50% of those come from <1% of pixels, then it is considered to be noise-dominated and hence unusable.
| Quadrant | # 1 sec bins | Bins with >0 counts | Bins with >2000 counts | High rate bins dominated by noise | Noise dominated (total time) | Noise dominated (detector-on time) | Marked lightcurve |
|---|---|---|---|---|---|---|---|
| A | 7315 | 6202 | 72 | 72 | 0.98% | 1.16% | 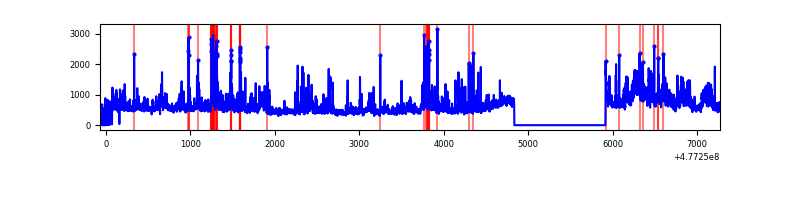 |
| B | 7338 | 6215 | 95 | 95 | 1.29% | 1.53% | 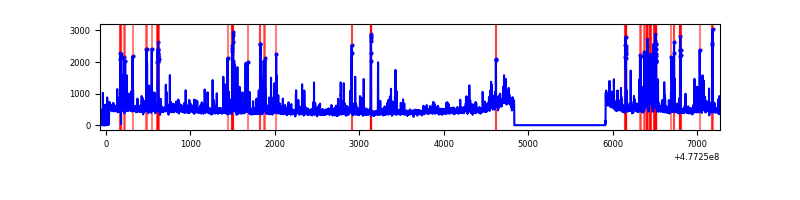 |
| C | 7323 | 6204 | 247 | 247 | 3.37% | 3.98% | 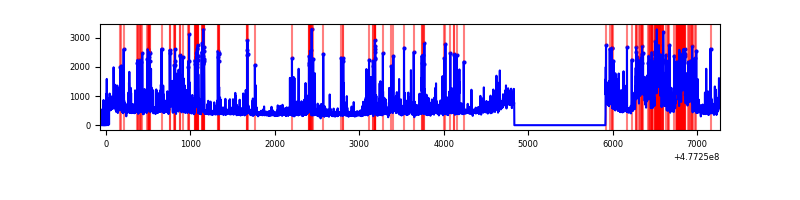 |
| D | 7295 | 6184 | 741 | 741 | 10.16% | 11.98% | 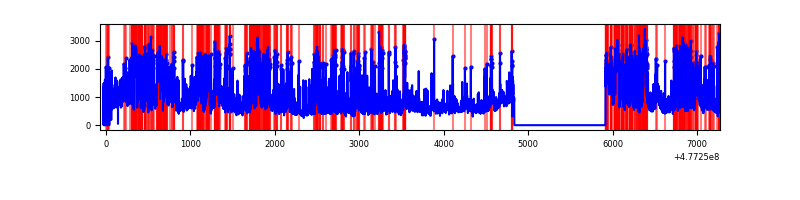 |
Top three noisy pixels from each quadrant. If the there are fewer than three noisy pixels in the level2.evt file, extra rows are filled as -1
| Pixel properties | Quadrant properties | ||||||
|---|---|---|---|---|---|---|---|
| Quadrant | DetID | PixID | Counts | Sigma | Mean | Median | Sigma |
| A | 4 | 4 | 320488 | 1904.94 | 675 | 657 | 167.9 |
| A | 4 | 3 | 263829 | 1567.47 | 675 | 657 | 167.9 |
| A | 9 | 96 | 203941 | 1210.77 | 675 | 657 | 167.9 |
| B | 10 | 247 | 167729 | 1183.82 | 672 | 647 | 141.1 |
| B | 8 | 128 | 140889 | 993.65 | 672 | 647 | 141.1 |
| B | 4 | 206 | 120340 | 848.06 | 672 | 647 | 141.1 |
| C | 10 | 171 | 572413 | 3173.85 | 660 | 654 | 180.1 |
| C | 13 | 3 | 325817 | 1804.99 | 660 | 654 | 180.1 |
| C | 5 | 10 | 236951 | 1311.69 | 660 | 654 | 180.1 |
| D | 15 | 93 | 828919 | 4827.72 | 624 | 603 | 171.6 |
| D | 8 | 176 | 631157 | 3675.09 | 624 | 603 | 171.6 |
| D | 2 | 153 | 619091 | 3604.77 | 624 | 603 | 171.6 |
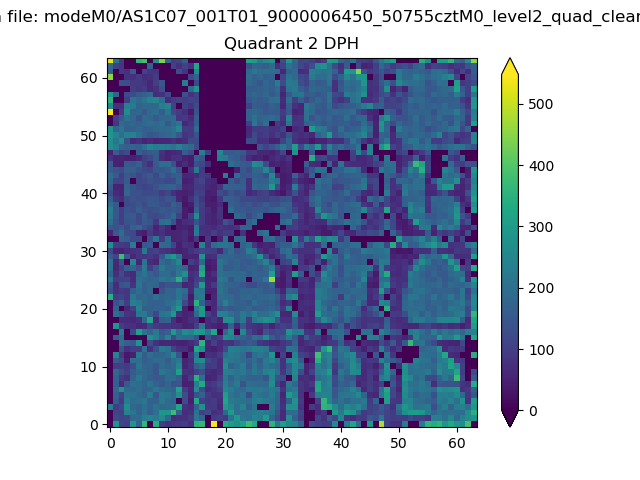
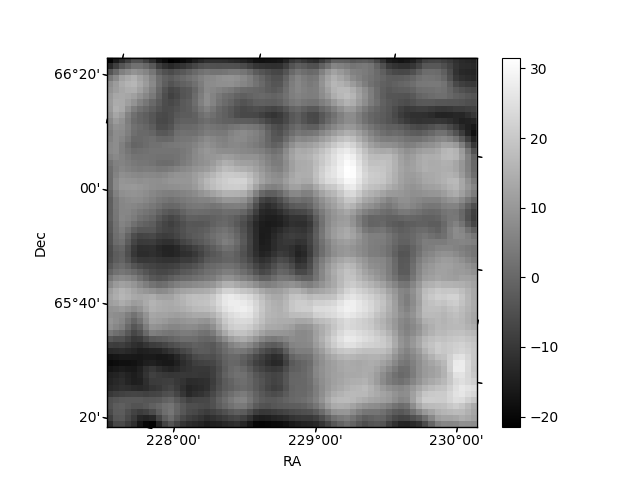
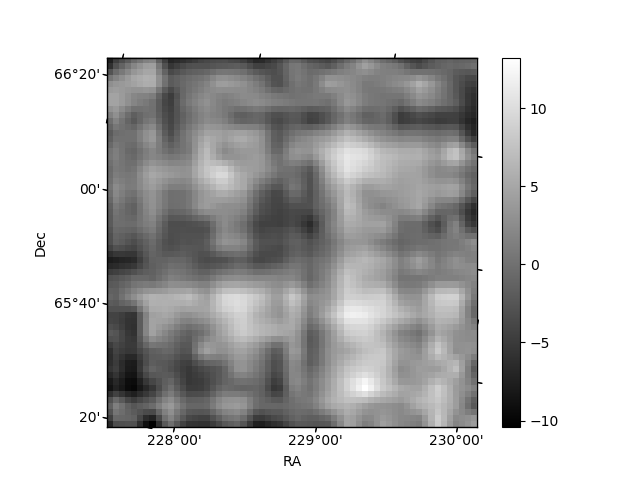
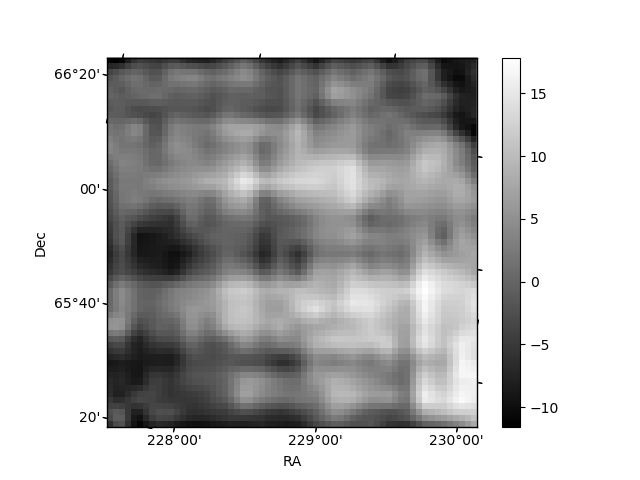
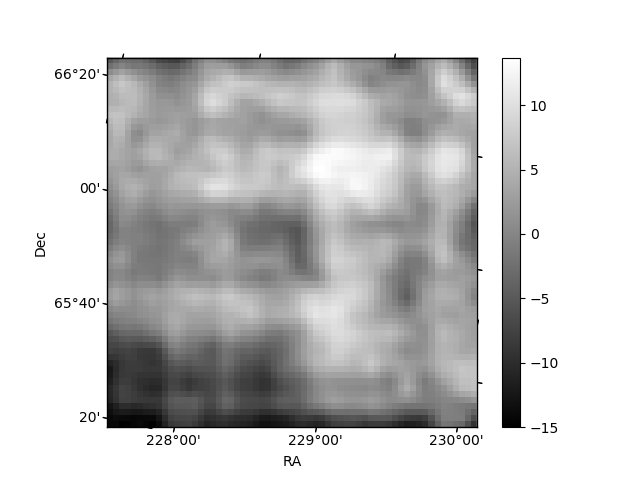
Histogram calculated using DETX and DETY for each event in the final _common_clean file
| Quadrant A | 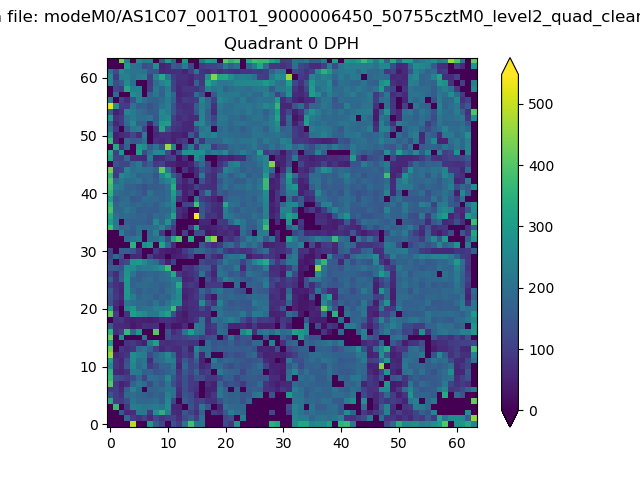 |
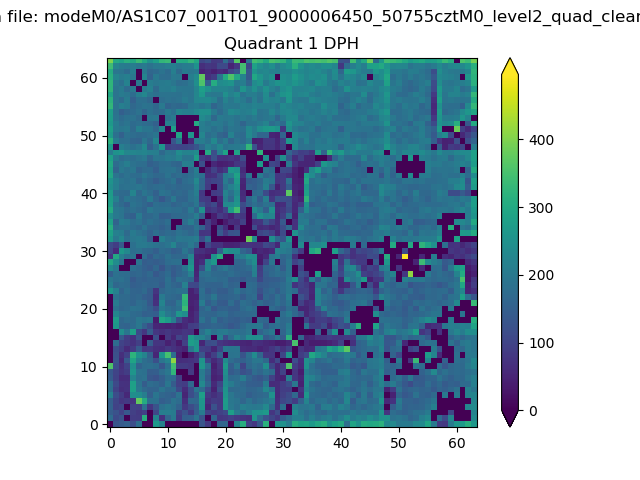 |
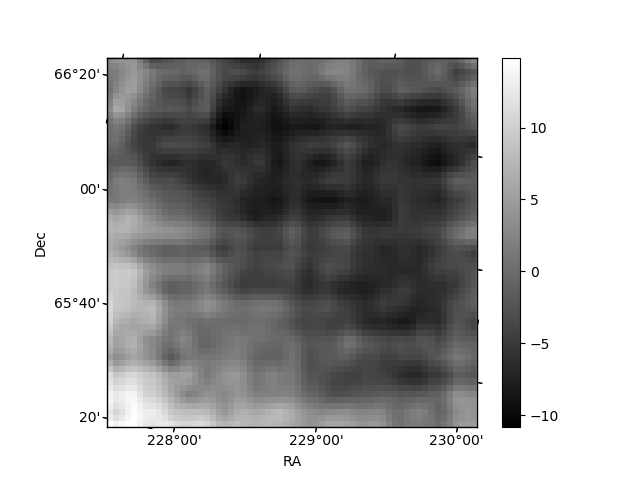
Quadrant B |
|---|---|---|---|
| Quadrant D | 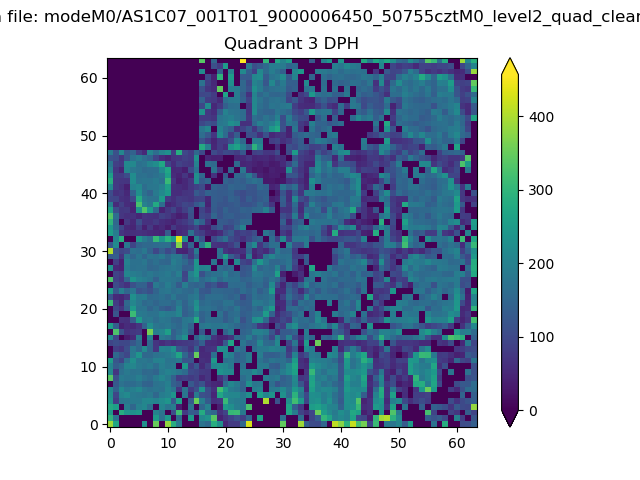 |
 |
Quadrant C |
| Plot type | Count rate plots | Images |
|---|---|---|
| Comparison with Poisson distribution Blue bars denote a histogram of data divided into 1 sec bins. Red curve is a Poisson curve with rate = median count rate of data. |
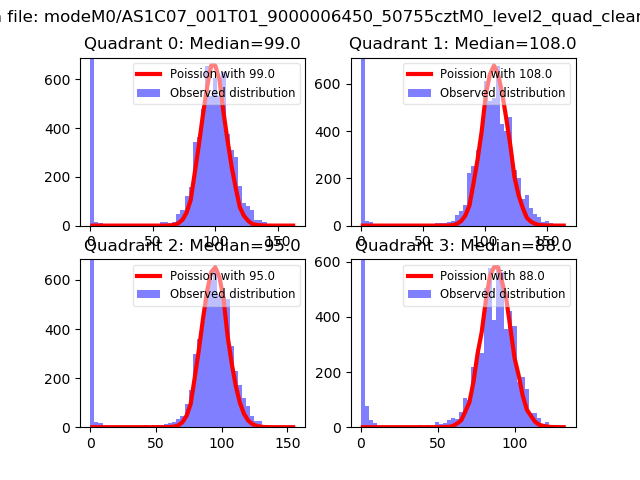 |
 |
| Quadrant-wise count rates Data is divided into 100 sec bins |
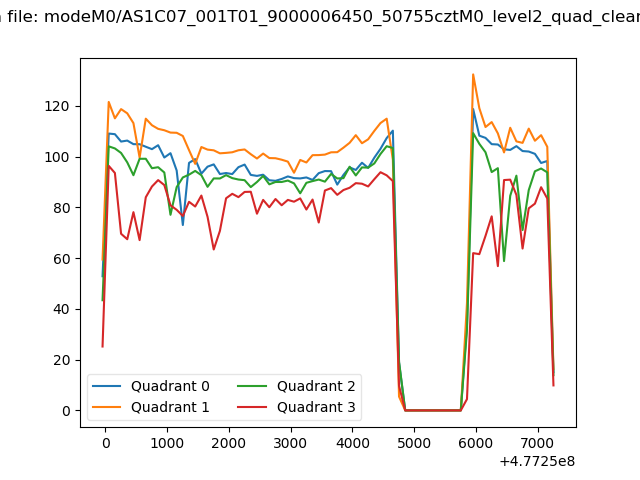 |
|
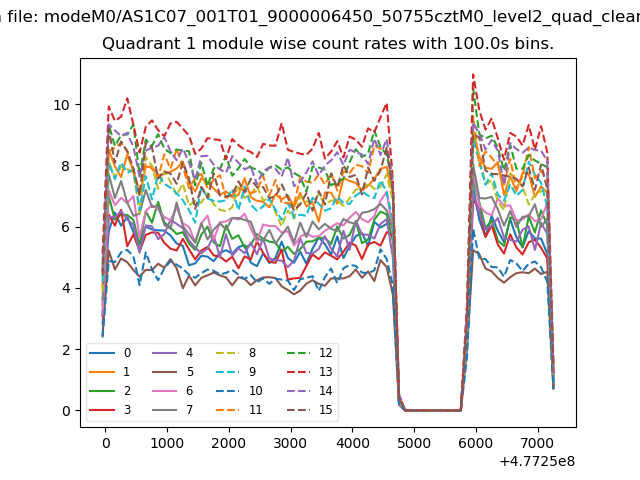
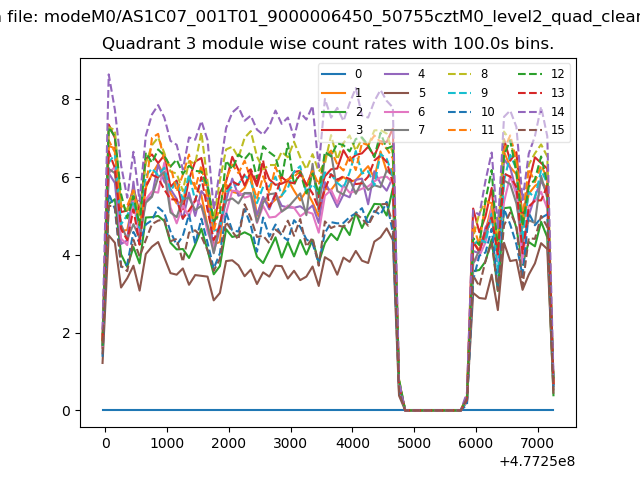
| Module-wise count rates for Quadrant A Data is divided into 100 sec bins |
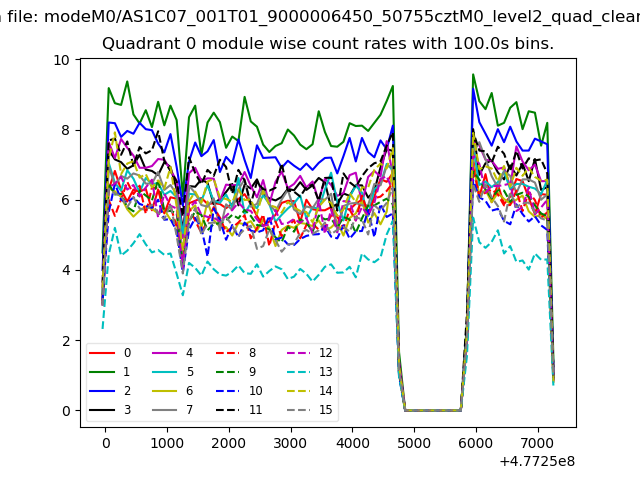 |
 |
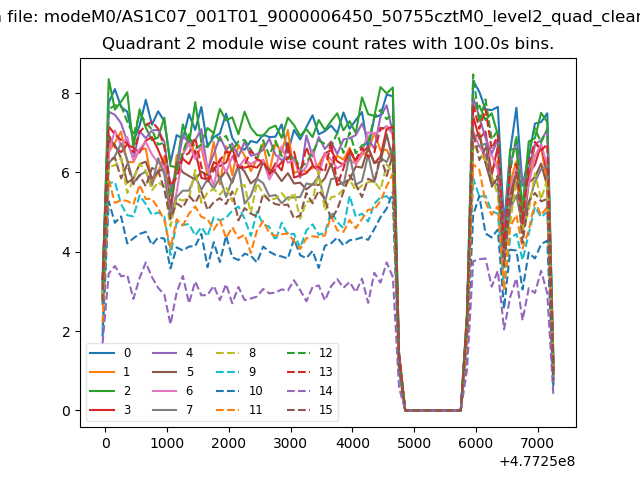
| Module-wise count rates for Quadrant B Data is divided into 100 sec bins |
 |
 |
| Module-wise count rates for Quadrant C Data is divided into 100 sec bins |
 |
 |
| Module-wise count rates for Quadrant D Data is divided into 100 sec bins |
 |
 |
| Parameter | Plot |
|---|---|
| CZT HV Monitor | 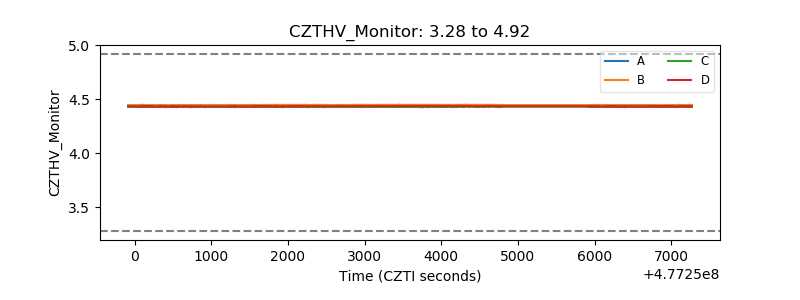 |
| D_VDD |  |
| Temperature 1 | 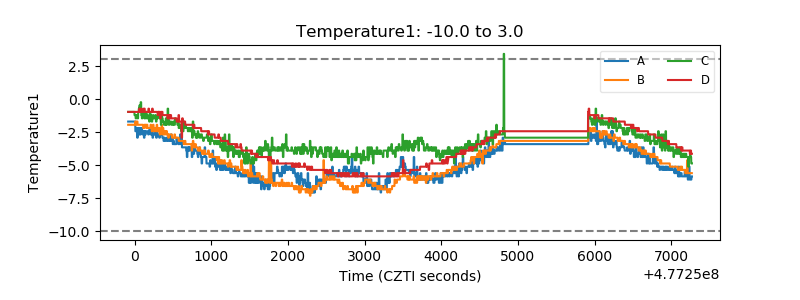 |
| Veto HV Monitor | 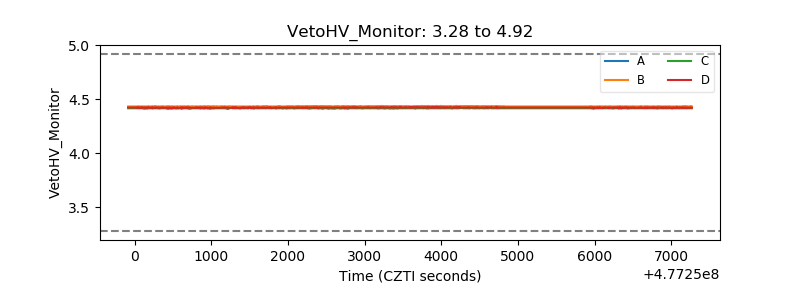 |
| Veto LLD | 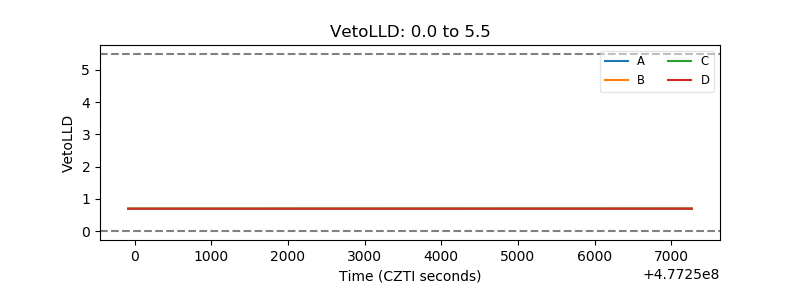 |
| Alpha Counter | 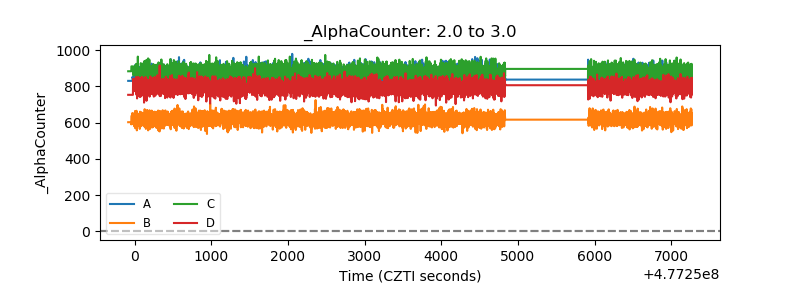 |
| _CPM_Rate | 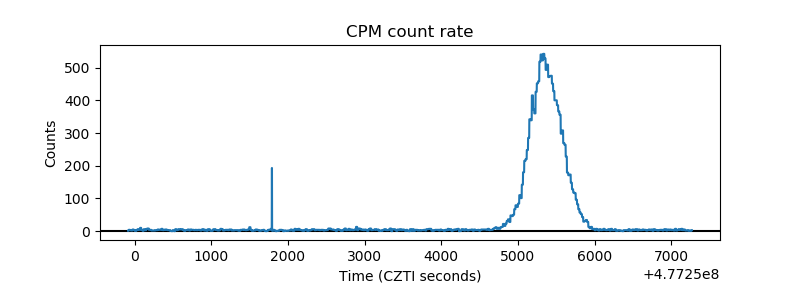 |
| CZT Counter | 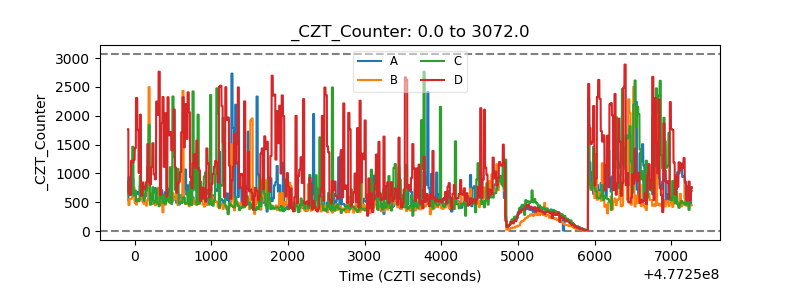 |
| +2.5 Volts monitor | 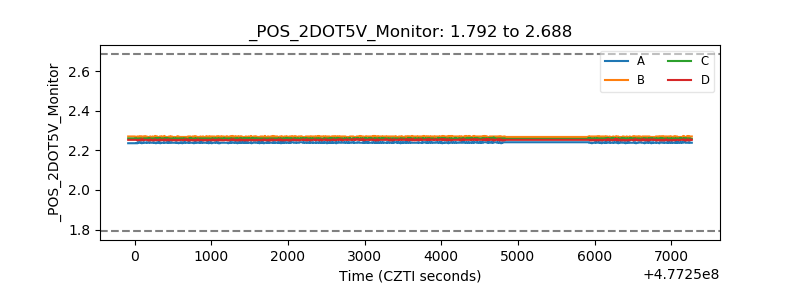 |
| +5 Volts monitor | 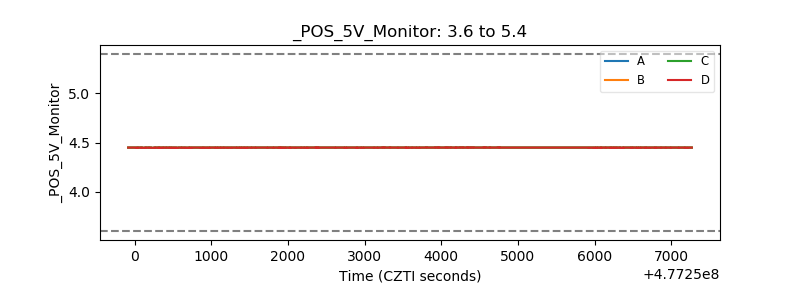 |
| _ROLL_ROT | 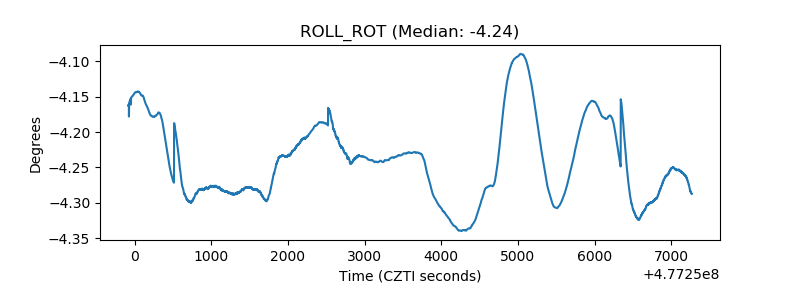 |
| _Roll_DEC | 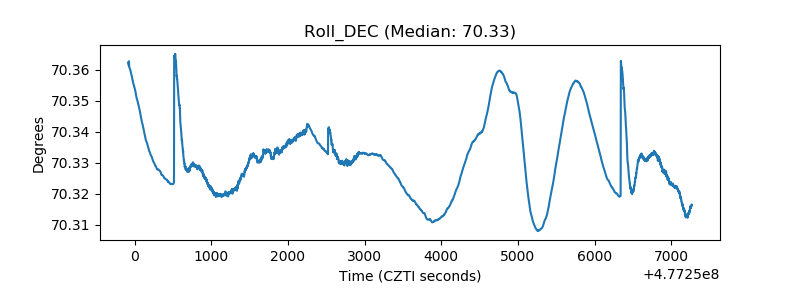 |
| _Roll_RA | 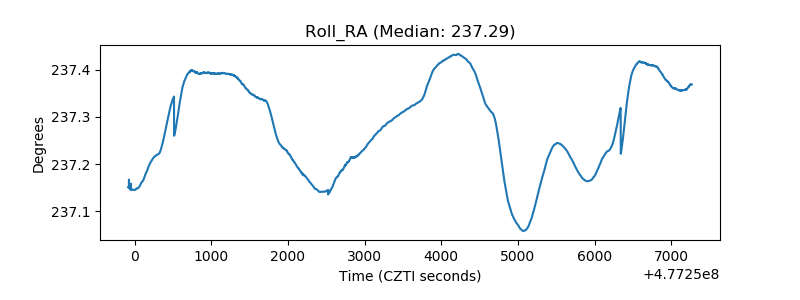 |
| Veto Counter | 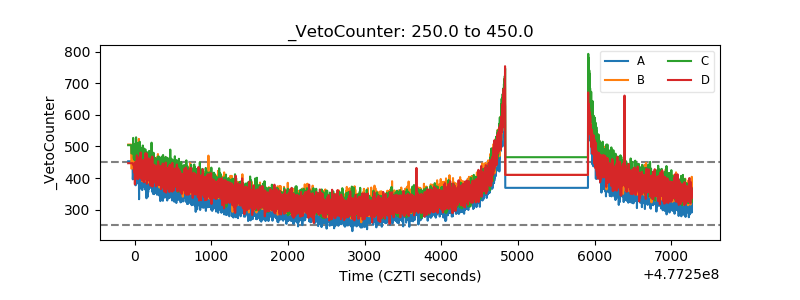 |