| Param | Original file | Final file |
|---|---|---|
| Filename | modeM0/AS1C07_001T01_9000006450_50756cztM0_level2.fits | modeM0/AS1C07_001T01_9000006450_50756cztM0_level2_quad_clean.evt |
| Size (bytes) | 596,387,520 | 87,163,200 |
| Size | 568.8 MB | 83.1 MB |
| Events in quadrant A | 4,568,375 | 586,333 |
| Events in quadrant B | 3,813,647 | 636,510 |
| Events in quadrant C | 4,444,963 | 561,465 |
| Events in quadrant D | 8,769,092 | 422,187 |
| Mode SS | |||
|---|---|---|---|
| Quadrant | BADHDUFLAG | Total packets | Discarded packets |
| A | 0 | 126 | 0 |
| B | 0 | 126 | 0 |
| C | 0 | 126 | 2 |
| D | 0 | 126 | 0 |
| Mode M0 | |||
|---|---|---|---|
| Quadrant | BADHDUFLAG | Total packets | Discarded packets |
| A | 0 | 18087 | 219 |
| B | 0 | 15759 | 120 |
| C | 0 | 17737 | 120 |
| D | 0 | 30685 | 329 |
| Mode M9 | |||
|---|---|---|---|
| Quadrant | BADHDUFLAG | Total packets | Discarded packets |
| A | 0 | 11 | 0 |
| B | 0 | 11 | 0 |
| C | 0 | 11 | 0 |
| D | 0 | 11 | 0 |
| Quadrant | Total seconds | Saturated seconds | Saturation percentage |
|---|---|---|---|
| A | 6194 | 191 | 3.083629% |
| B | 6206 | 241 | 3.883339% |
| C | 6203 | 298 | 4.804127% |
| D | 6193 | 1613 | 26.045535% |
Noise dominated data is calculated using 1-second bins in cleaned event files. If a bin has >2000 counts, and if more than 50% of those come from <1% of pixels, then it is considered to be noise-dominated and hence unusable.
| Quadrant | # 1 sec bins | Bins with >0 counts | Bins with >2000 counts | High rate bins dominated by noise | Noise dominated (total time) | Noise dominated (detector-on time) | Marked lightcurve |
|---|---|---|---|---|---|---|---|
| A | 7277 | 6212 | 122 | 122 | 1.68% | 1.96% | 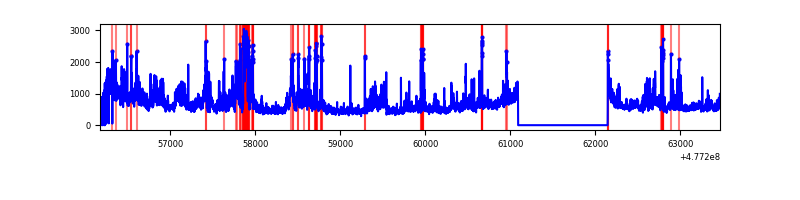 |
| B | 7288 | 6220 | 140 | 140 | 1.92% | 2.25% | 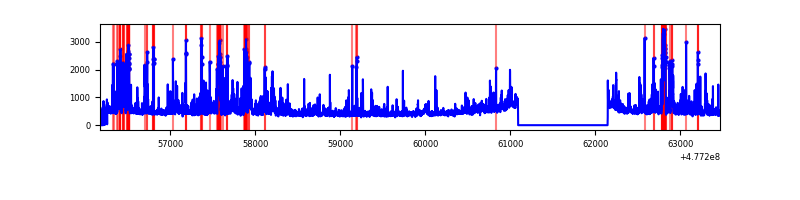 |
| C | 7295 | 6219 | 228 | 228 | 3.13% | 3.67% | 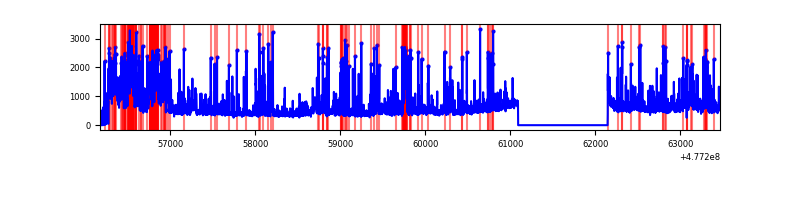 |
| D | 7282 | 6205 | 1619 | 1619 | 22.23% | 26.09% | 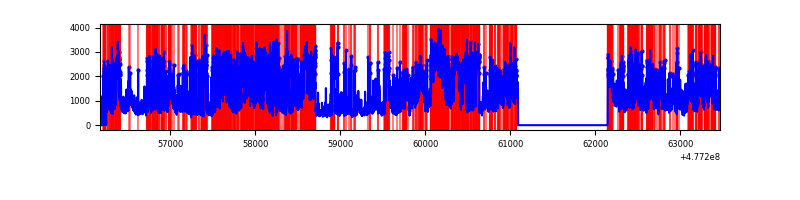 |
Top three noisy pixels from each quadrant. If the there are fewer than three noisy pixels in the level2.evt file, extra rows are filled as -1
| Pixel properties | Quadrant properties | ||||||
|---|---|---|---|---|---|---|---|
| Quadrant | DetID | PixID | Counts | Sigma | Mean | Median | Sigma |
| A | 4 | 4 | 563101 | 3452.37 | 653 | 636 | 162.9 |
| A | 9 | 96 | 285285 | 1747.16 | 653 | 636 | 162.9 |
| A | 14 | 254 | 262303 | 1606.09 | 653 | 636 | 162.9 |
| B | 4 | 206 | 394761 | 2833.8 | 653 | 632 | 139.1 |
| B | 10 | 247 | 176996 | 1268.06 | 653 | 632 | 139.1 |
| B | 2 | 176 | 137834 | 986.49 | 653 | 632 | 139.1 |
| C | 10 | 171 | 525560 | 2984.76 | 642 | 637 | 175.9 |
| C | 5 | 10 | 439457 | 2495.17 | 642 | 637 | 175.9 |
| C | 9 | 38 | 294177 | 1669.1 | 642 | 637 | 175.9 |
| D | 8 | 176 | 2594103 | 16569.64 | 562 | 541 | 156.5 |
| D | 15 | 93 | 657934 | 4199.92 | 562 | 541 | 156.5 |
| D | 8 | 48 | 645367 | 4119.64 | 562 | 541 | 156.5 |
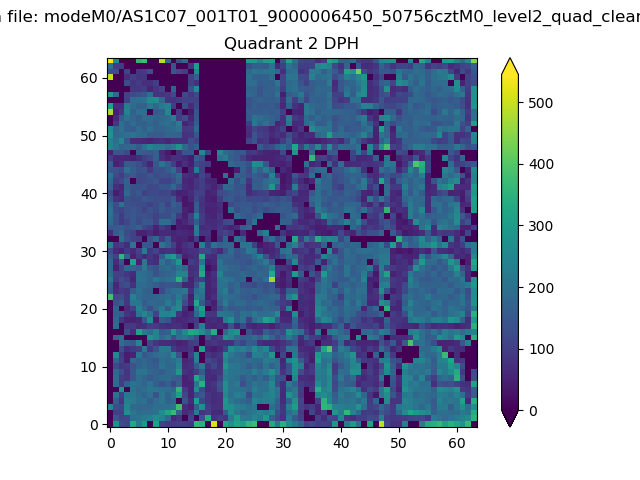
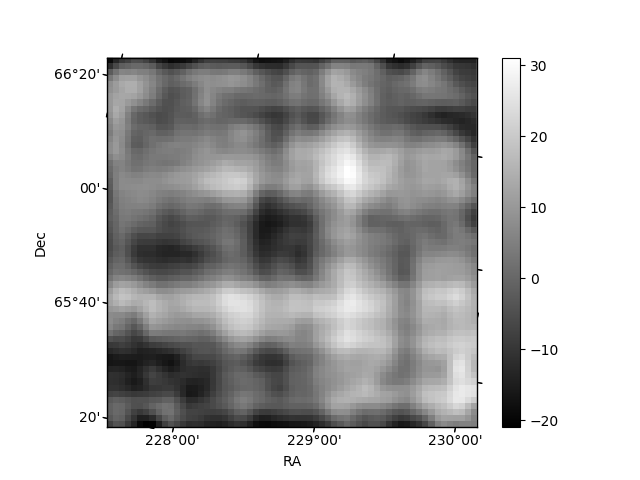
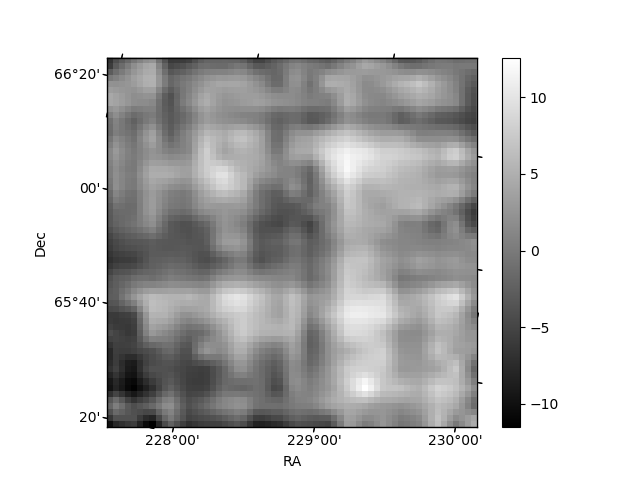
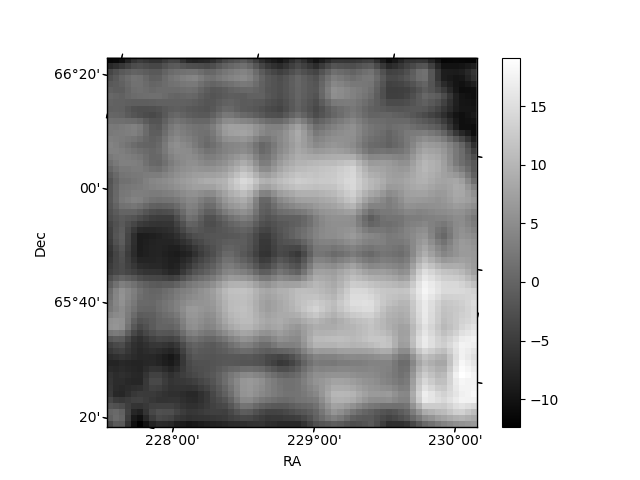
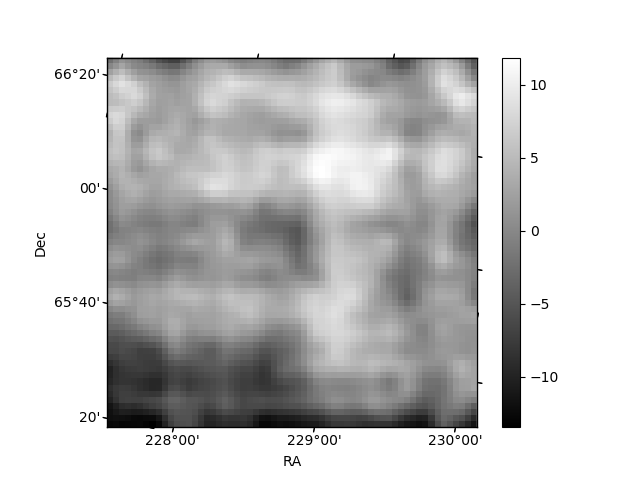
Histogram calculated using DETX and DETY for each event in the final _common_clean file
| Quadrant A | 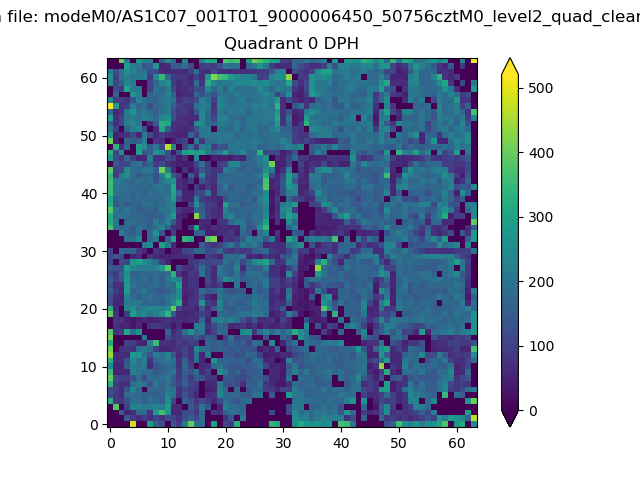 |
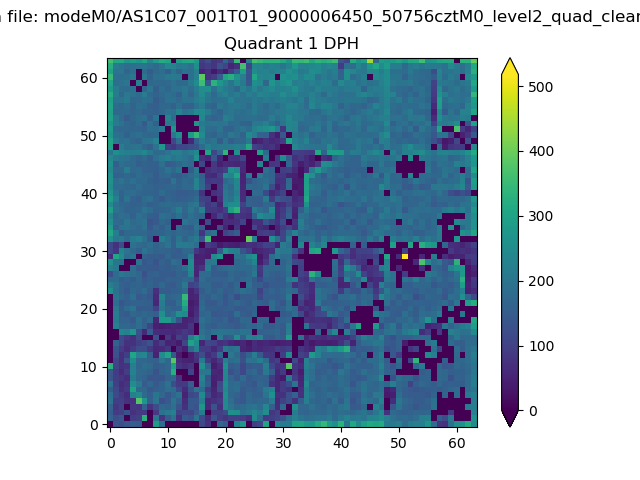 |
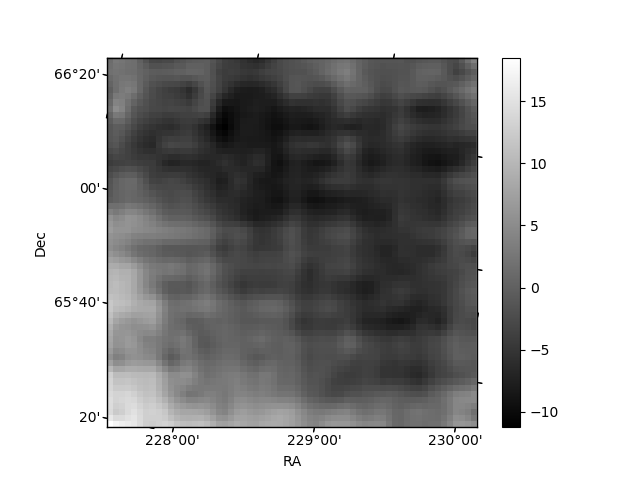
Quadrant B |
|---|---|---|---|
| Quadrant D | 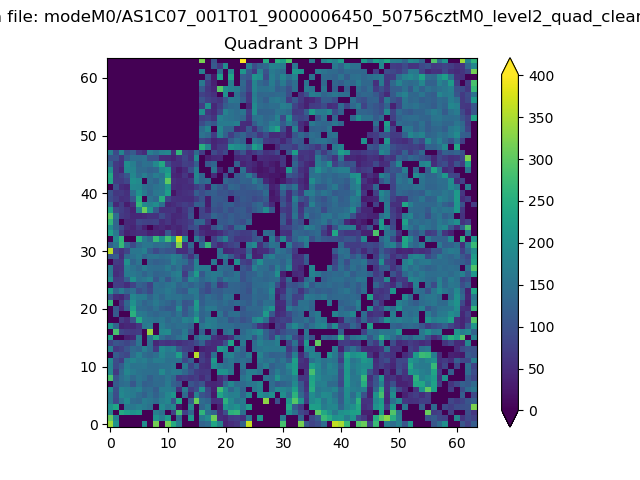 |
 |
Quadrant C |
| Plot type | Count rate plots | Images |
|---|---|---|
| Comparison with Poisson distribution Blue bars denote a histogram of data divided into 1 sec bins. Red curve is a Poisson curve with rate = median count rate of data. |
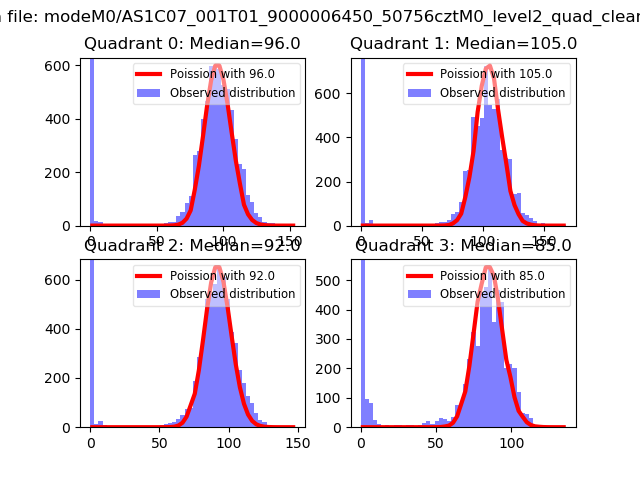 |
 |
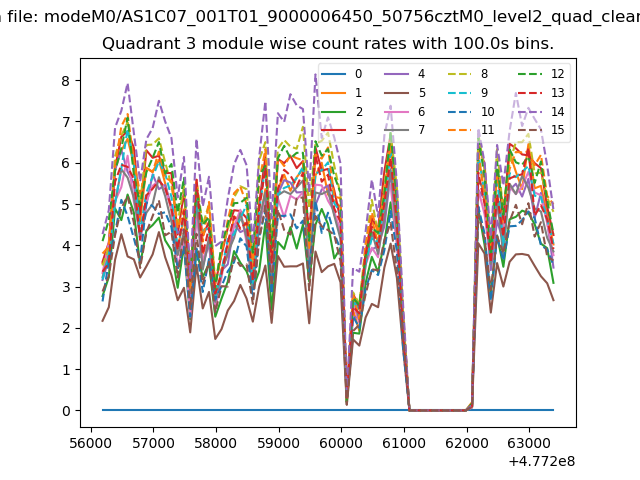
| Quadrant-wise count rates Data is divided into 100 sec bins |
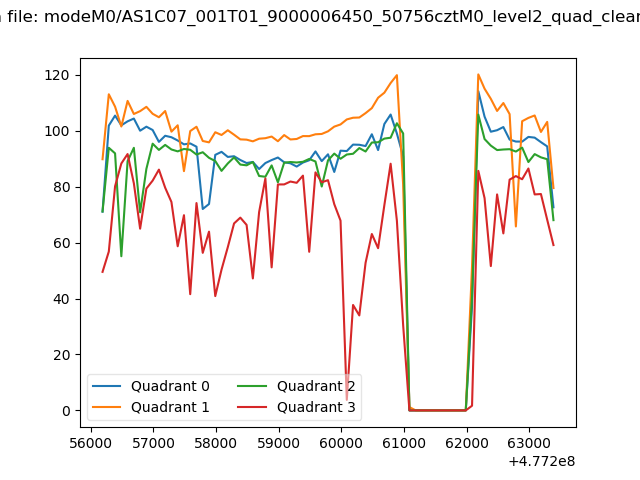 |
|
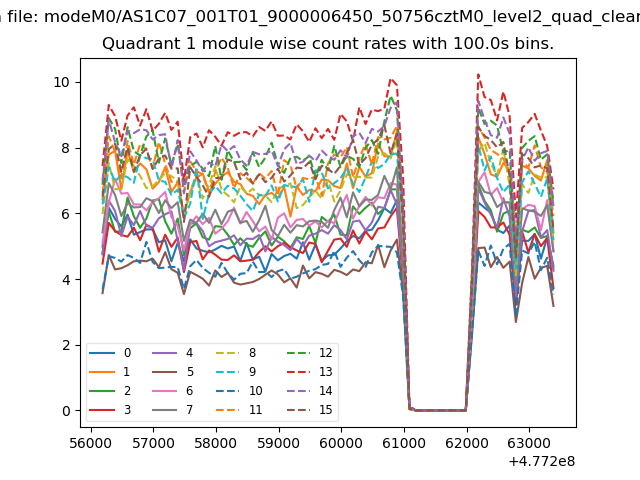
| Module-wise count rates for Quadrant A Data is divided into 100 sec bins |
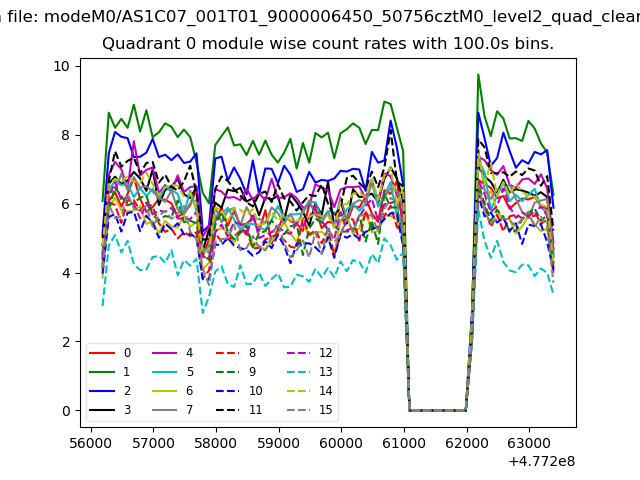 |
 |
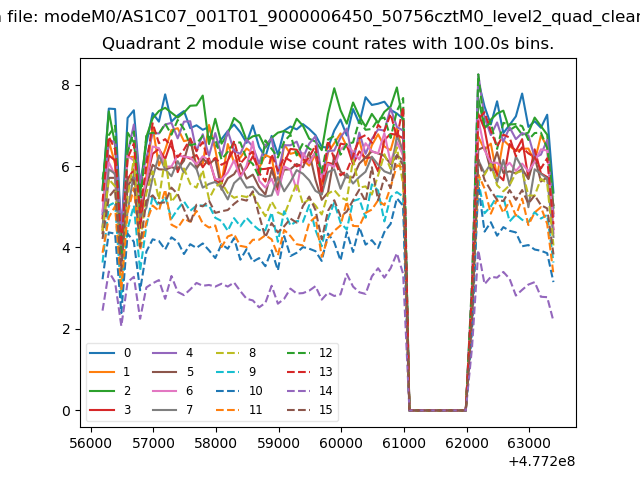
| Module-wise count rates for Quadrant B Data is divided into 100 sec bins |
 |
 |
| Module-wise count rates for Quadrant C Data is divided into 100 sec bins |
 |
 |
| Module-wise count rates for Quadrant D Data is divided into 100 sec bins |
 |
 |
| Parameter | Plot |
|---|---|
| CZT HV Monitor |  |
| D_VDD | 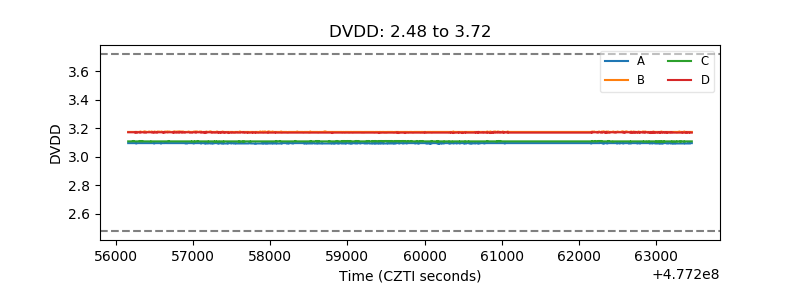 |
| Temperature 1 | 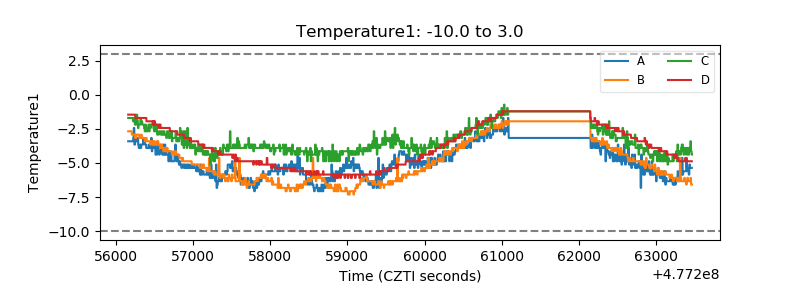 |
| Veto HV Monitor | 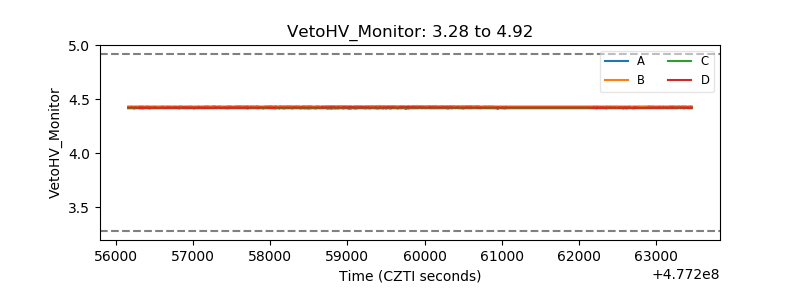 |
| Veto LLD | 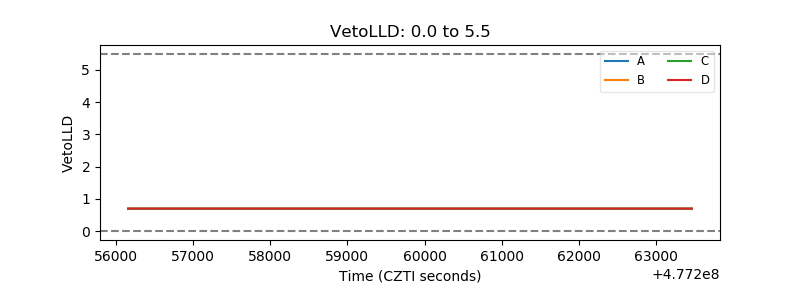 |
| Alpha Counter | 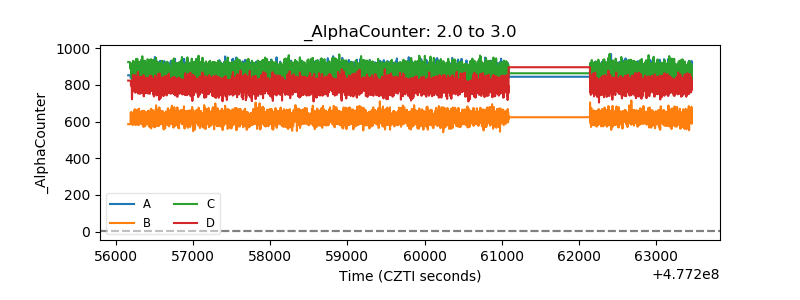 |
| _CPM_Rate | 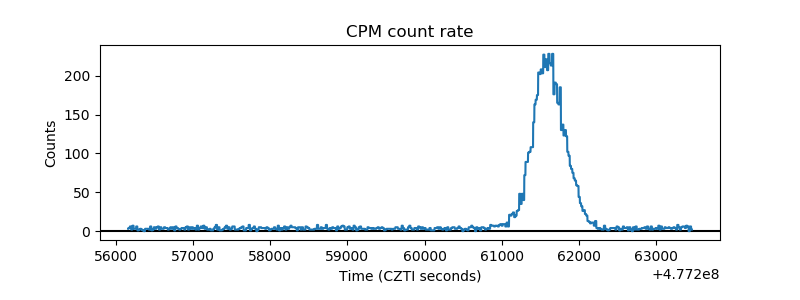 |
| CZT Counter | 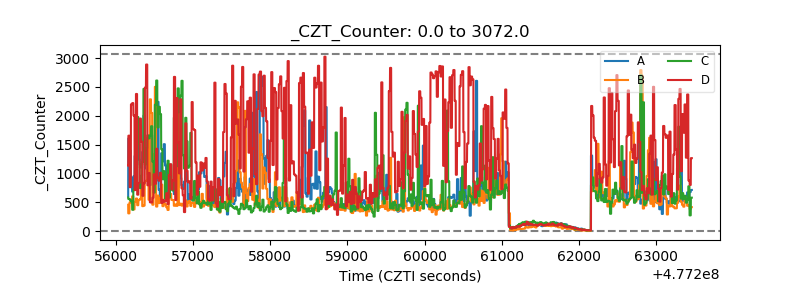 |
| +2.5 Volts monitor | 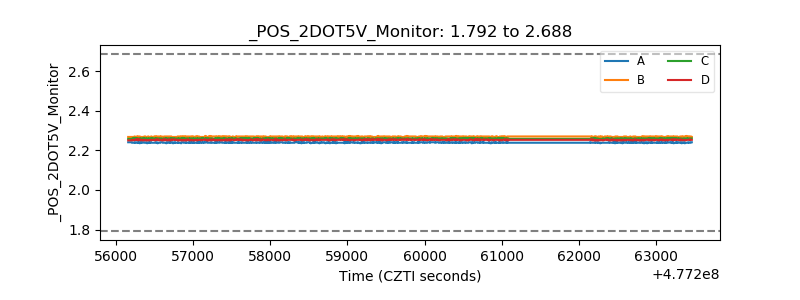 |
| +5 Volts monitor | 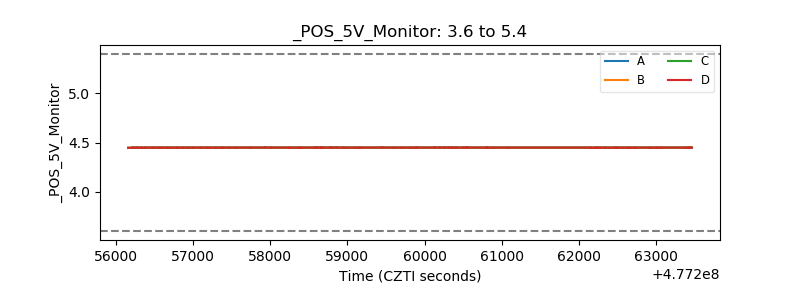 |
| _ROLL_ROT | 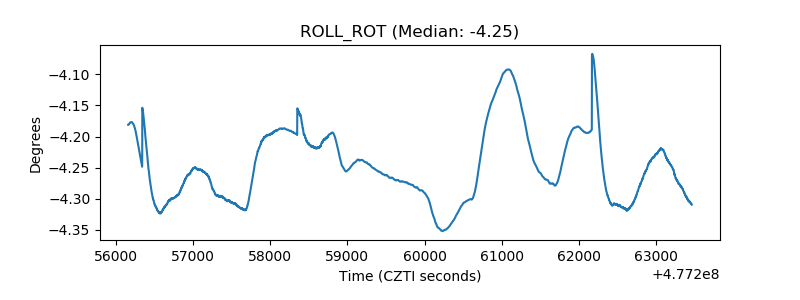 |
| _Roll_DEC | 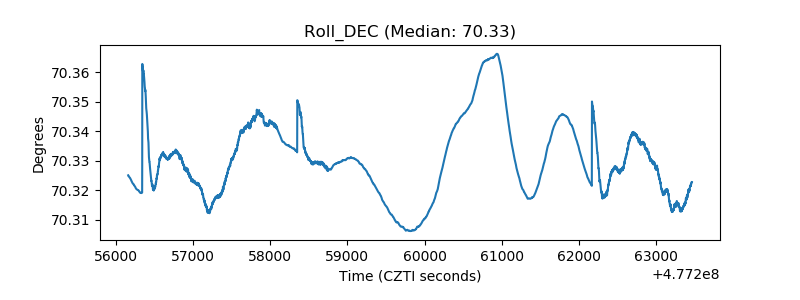 |
| _Roll_RA | 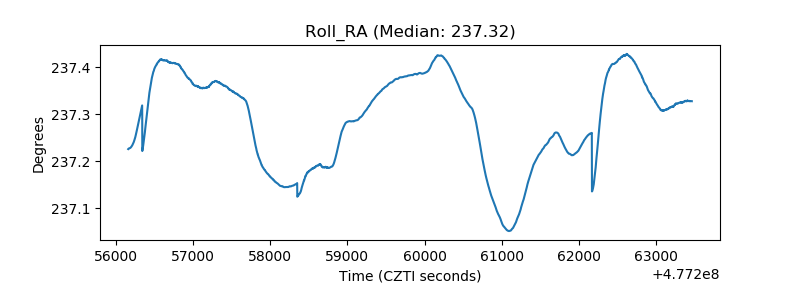 |
| Veto Counter | 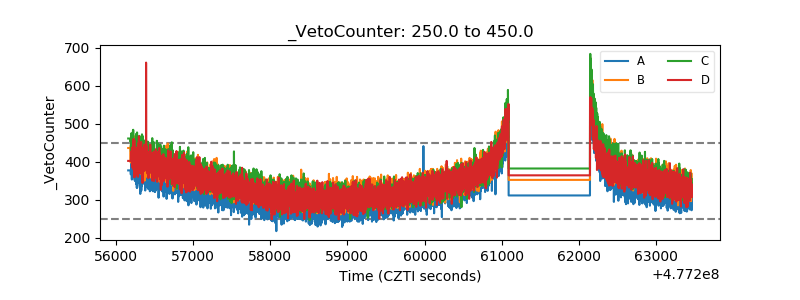 |