| Param | Original file | Final file |
|---|---|---|
| Filename | modeM0/AS1C07_001T01_9000006450_50757cztM0_level2.fits | modeM0/AS1C07_001T01_9000006450_50757cztM0_level2_quad_clean.evt |
| Size (bytes) | 541,278,720 | 86,425,920 |
| Size | 516.2 MB | 82.4 MB |
| Events in quadrant A | 3,815,987 | 572,564 |
| Events in quadrant B | 3,739,131 | 615,035 |
| Events in quadrant C | 5,292,114 | 535,216 |
| Events in quadrant D | 6,714,914 | 466,459 |
| Mode SS | |||
|---|---|---|---|
| Quadrant | BADHDUFLAG | Total packets | Discarded packets |
| A | 0 | 130 | 4 |
| B | 0 | 130 | 8 |
| C | 0 | 130 | 2 |
| D | 0 | 130 | 6 |
| Mode M0 | |||
|---|---|---|---|
| Quadrant | BADHDUFLAG | Total packets | Discarded packets |
| A | 0 | 16358 | 790 |
| B | 0 | 16493 | 968 |
| C | 0 | 20646 | 731 |
| D | 0 | 25713 | 1462 |
| Mode M9 | |||
|---|---|---|---|
| Quadrant | BADHDUFLAG | Total packets | Discarded packets |
| A | 0 | 8 | 0 |
| B | 0 | 8 | 0 |
| C | 0 | 8 | 0 |
| D | 0 | 8 | 0 |
| Quadrant | Total seconds | Saturated seconds | Saturation percentage |
|---|---|---|---|
| A | 6139 | 86 | 1.400880% |
| B | 6126 | 205 | 3.346392% |
| C | 6125 | 319 | 5.208163% |
| D | 6091 | 770 | 12.641602% |
Noise dominated data is calculated using 1-second bins in cleaned event files. If a bin has >2000 counts, and if more than 50% of those come from <1% of pixels, then it is considered to be noise-dominated and hence unusable.
| Quadrant | # 1 sec bins | Bins with >0 counts | Bins with >2000 counts | High rate bins dominated by noise | Noise dominated (total time) | Noise dominated (detector-on time) | Marked lightcurve |
|---|---|---|---|---|---|---|---|
| A | 7078 | 6211 | 36 | 36 | 0.51% | 0.58% | 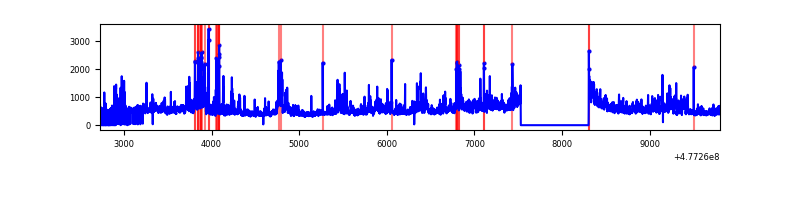 |
| B | 7051 | 6182 | 98 | 98 | 1.39% | 1.59% | 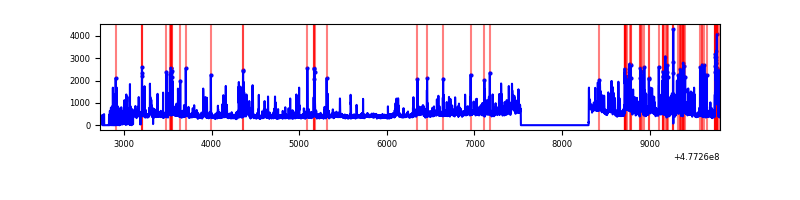 |
| C | 7077 | 6207 | 224 | 224 | 3.17% | 3.61% | 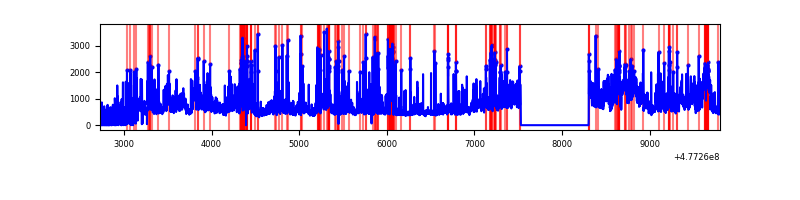 |
| D | 7011 | 6162 | 708 | 708 | 10.10% | 11.49% | 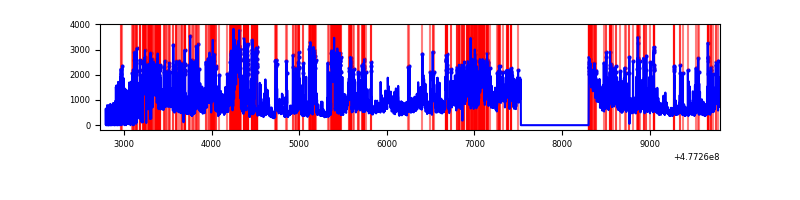 |
Top three noisy pixels from each quadrant. If the there are fewer than three noisy pixels in the level2.evt file, extra rows are filled as -1
| Pixel properties | Quadrant properties | ||||||
|---|---|---|---|---|---|---|---|
| Quadrant | DetID | PixID | Counts | Sigma | Mean | Median | Sigma |
| A | 4 | 4 | 375783 | 2348.67 | 635 | 619 | 159.7 |
| A | 4 | 3 | 197606 | 1233.21 | 635 | 619 | 159.7 |
| A | 14 | 254 | 179372 | 1119.06 | 635 | 619 | 159.7 |
| B | 4 | 206 | 435821 | 3227.19 | 631 | 610 | 134.9 |
| B | 7 | 0 | 147403 | 1088.51 | 631 | 610 | 134.9 |
| B | 10 | 247 | 102101 | 752.58 | 631 | 610 | 134.9 |
| C | 5 | 10 | 1252459 | 7388.92 | 613 | 610 | 169.4 |
| C | 13 | 3 | 289389 | 1704.49 | 613 | 610 | 169.4 |
| C | 9 | 38 | 238001 | 1401.18 | 613 | 610 | 169.4 |
| D | 15 | 93 | 1263828 | 7646.91 | 583 | 559 | 165.2 |
| D | 8 | 176 | 698762 | 4226.41 | 583 | 559 | 165.2 |
| D | 8 | 48 | 686720 | 4153.52 | 583 | 559 | 165.2 |
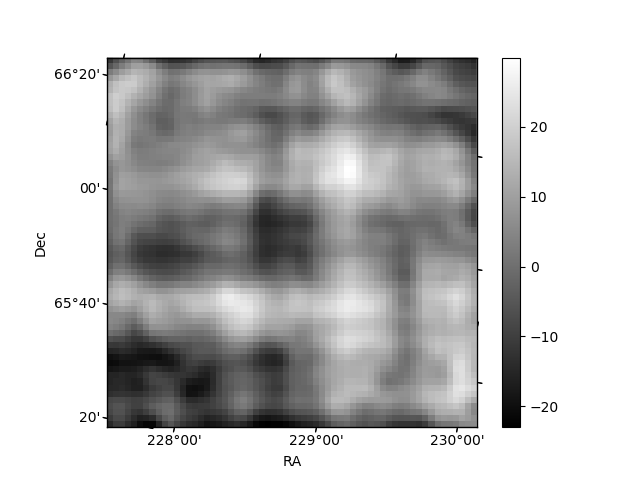
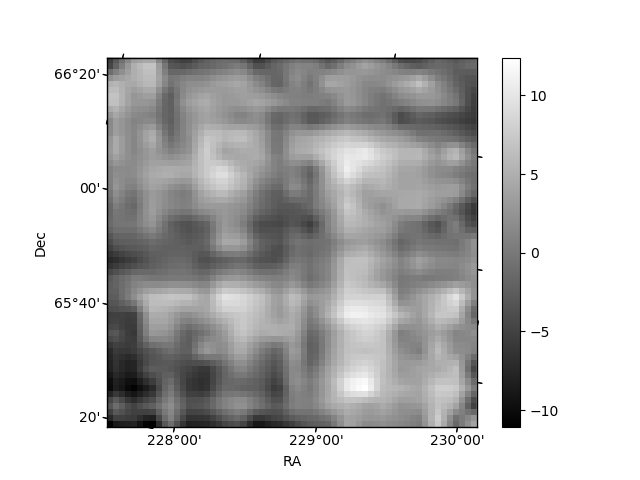
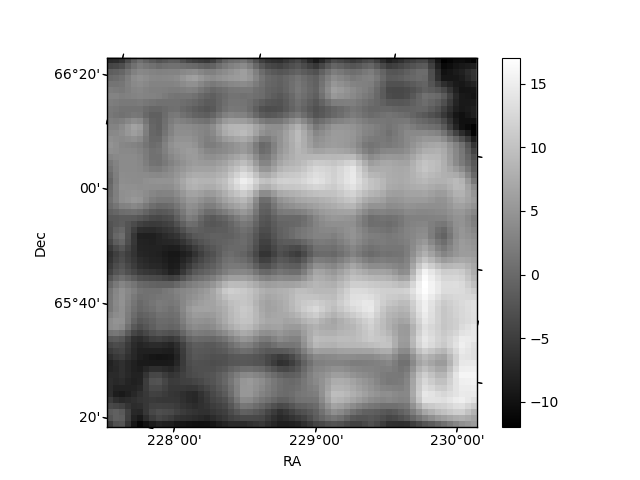
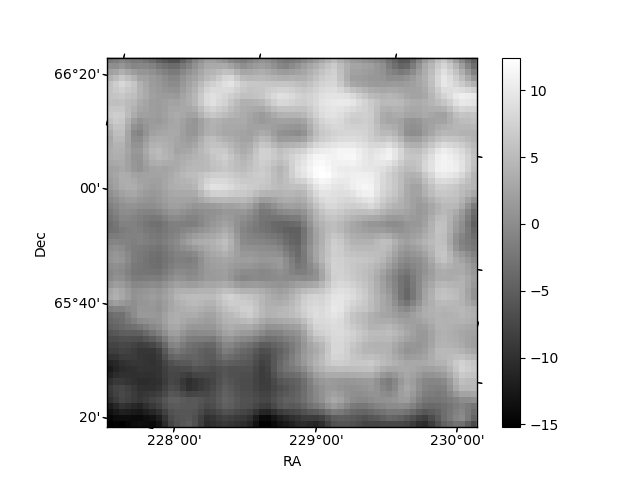
Histogram calculated using DETX and DETY for each event in the final _common_clean file
| Quadrant A | 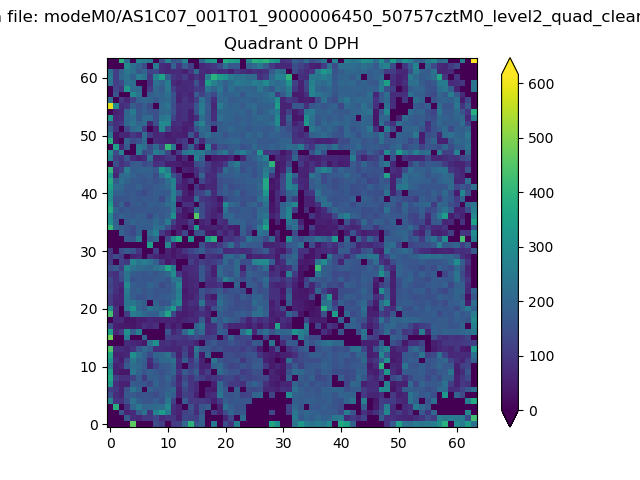 |
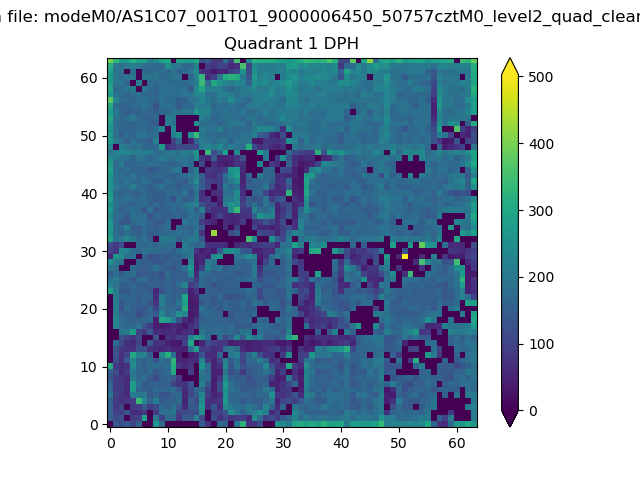 |
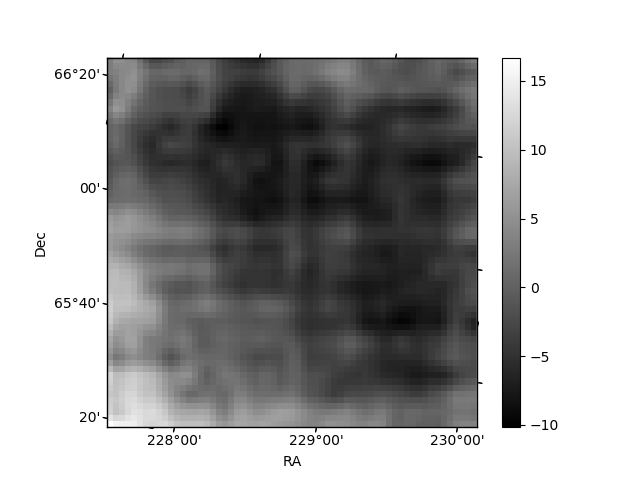
Quadrant B |
|---|---|---|---|
| Quadrant D | 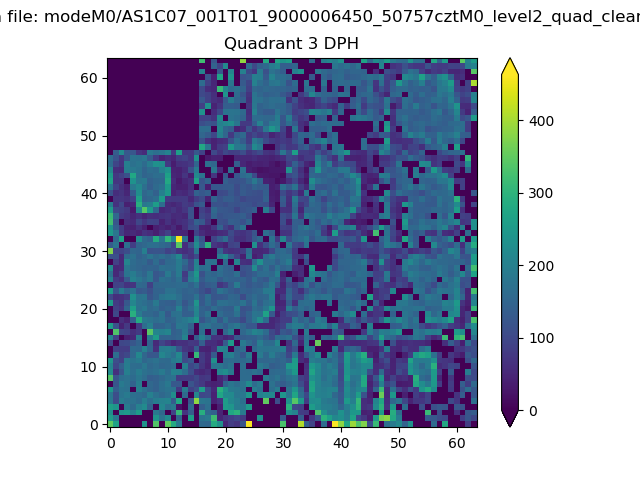 |
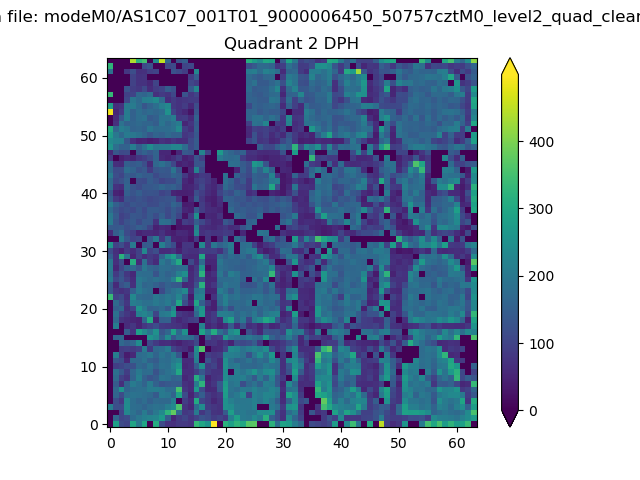 |
Quadrant C |
| Plot type | Count rate plots | Images |
|---|---|---|
| Comparison with Poisson distribution Blue bars denote a histogram of data divided into 1 sec bins. Red curve is a Poisson curve with rate = median count rate of data. |
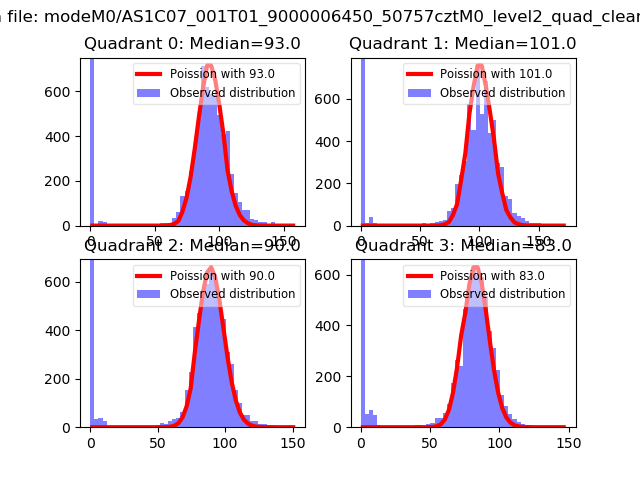 |
 |
| Quadrant-wise count rates Data is divided into 100 sec bins |
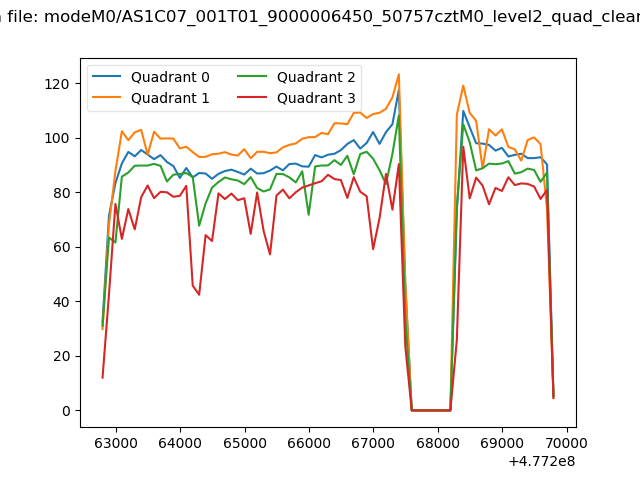 |
|
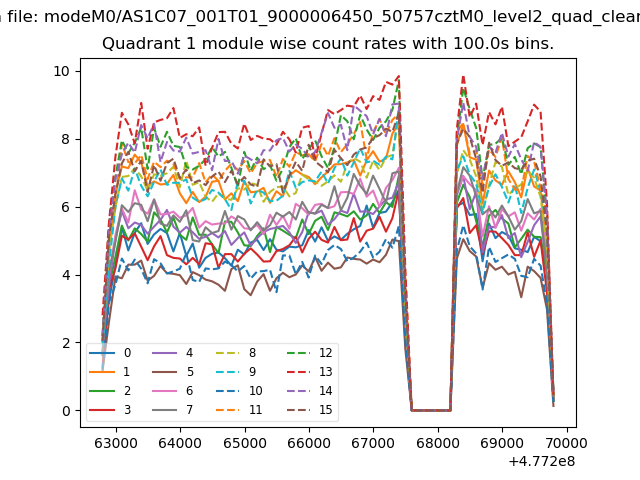
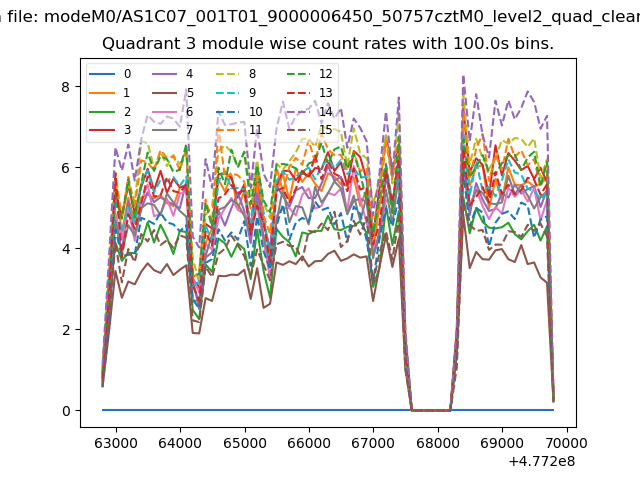
| Module-wise count rates for Quadrant A Data is divided into 100 sec bins |
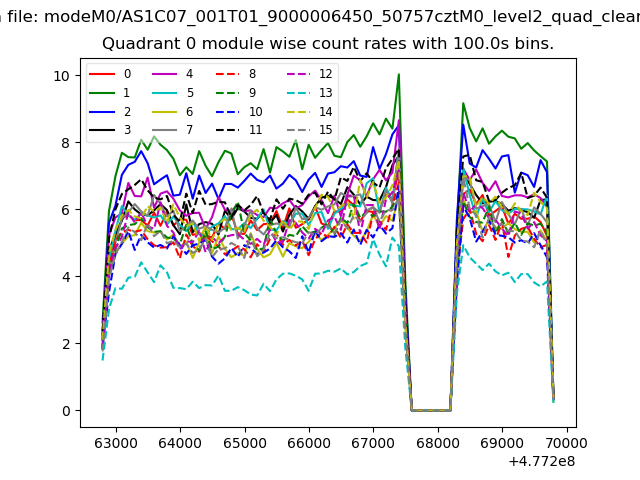 |
 |
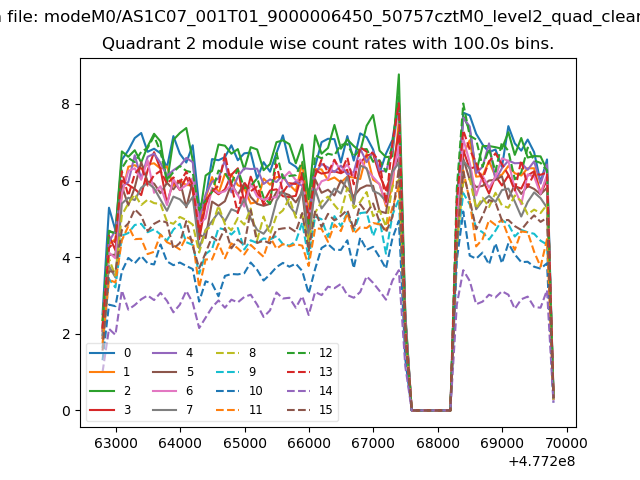
| Module-wise count rates for Quadrant B Data is divided into 100 sec bins |
 |
 |
| Module-wise count rates for Quadrant C Data is divided into 100 sec bins |
 |
 |
| Module-wise count rates for Quadrant D Data is divided into 100 sec bins |
 |
 |
| Parameter | Plot |
|---|---|
| CZT HV Monitor | 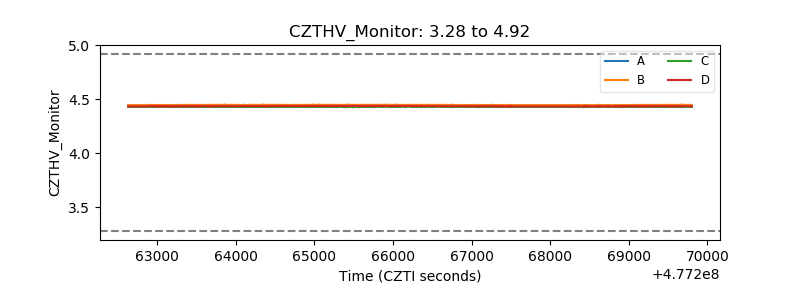 |
| D_VDD | 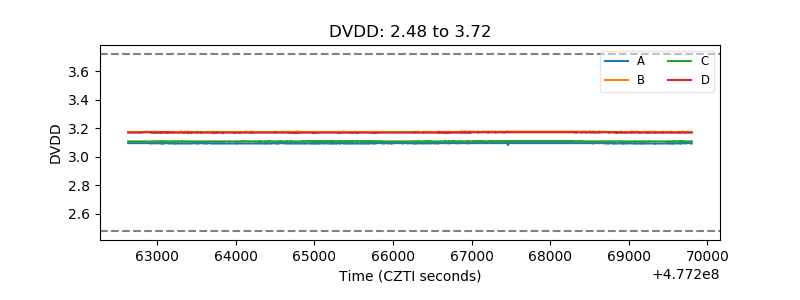 |
| Temperature 1 | 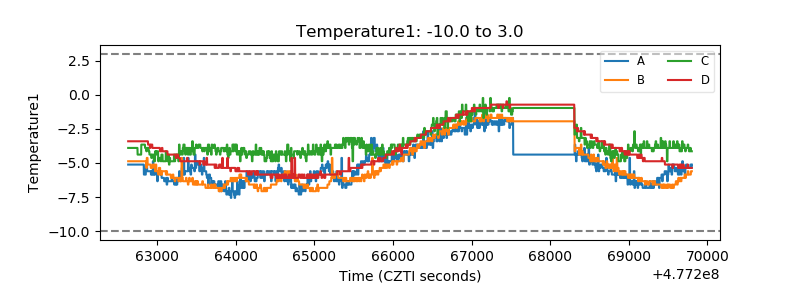 |
| Veto HV Monitor | 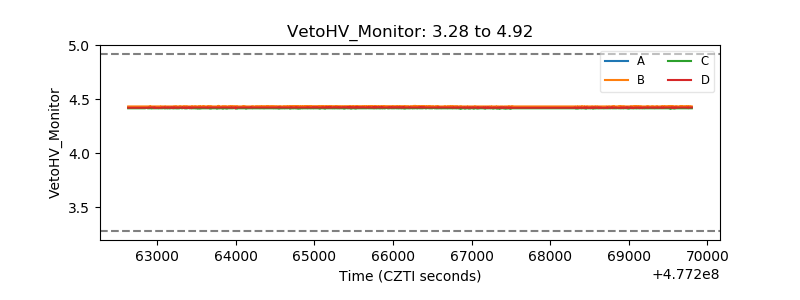 |
| Veto LLD | 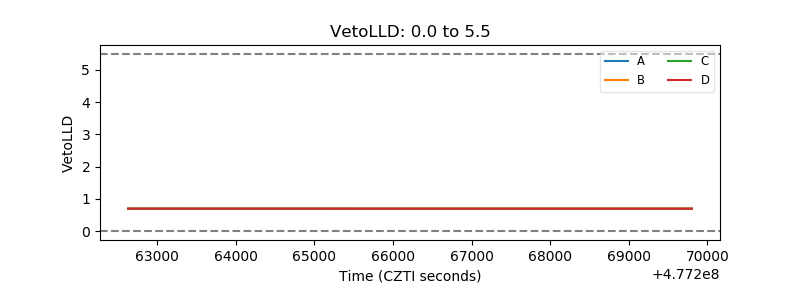 |
| Alpha Counter | 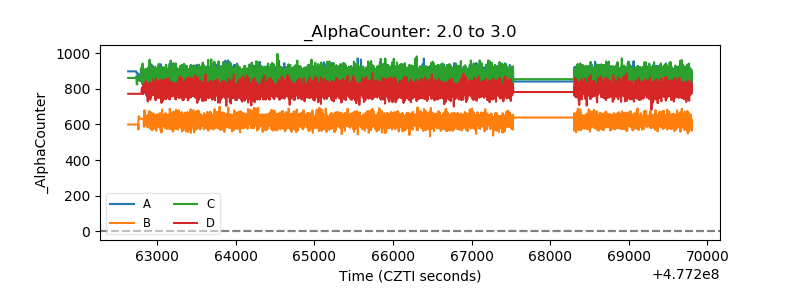 |
| _CPM_Rate | 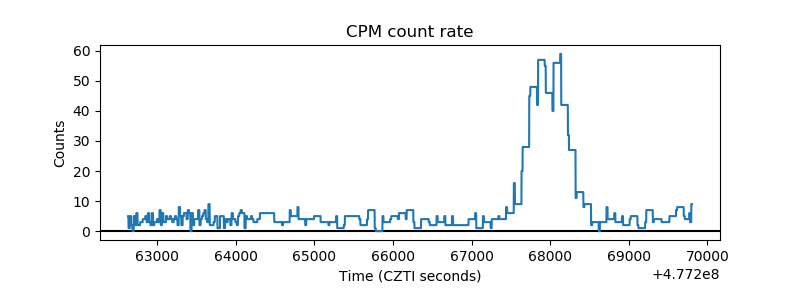 |
| CZT Counter | 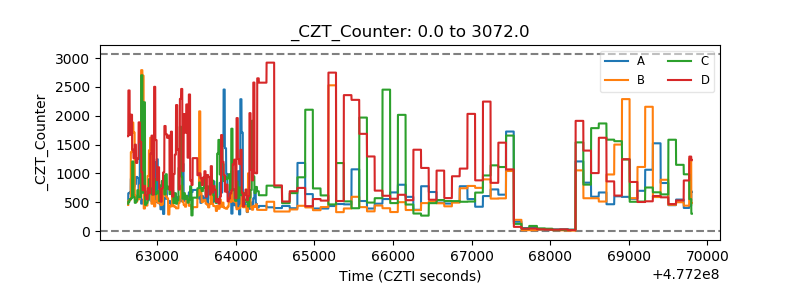 |
| +2.5 Volts monitor |  |
| +5 Volts monitor | 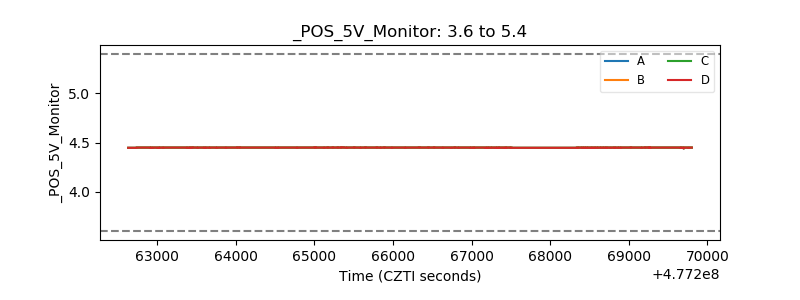 |
| _ROLL_ROT | 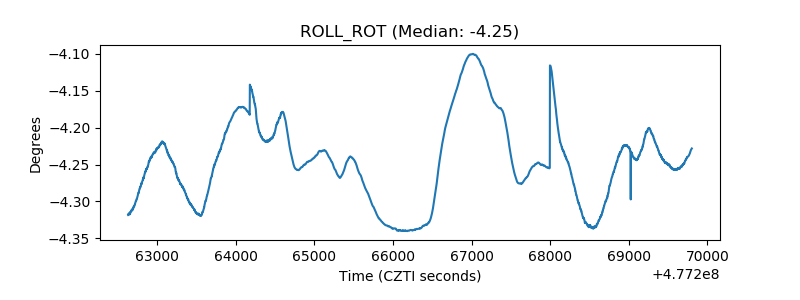 |
| _Roll_DEC | 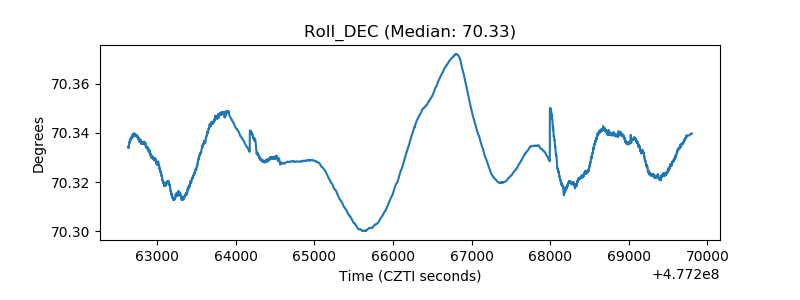 |
| _Roll_RA | 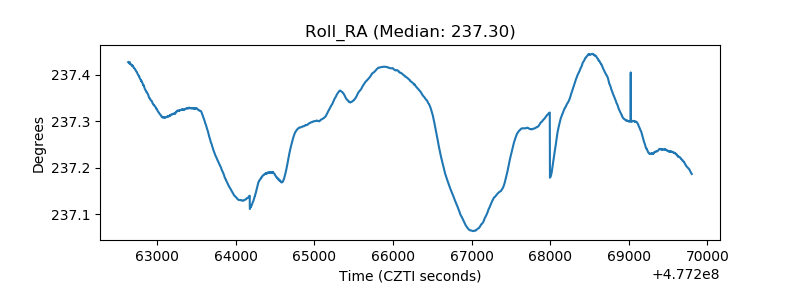 |
| Veto Counter | 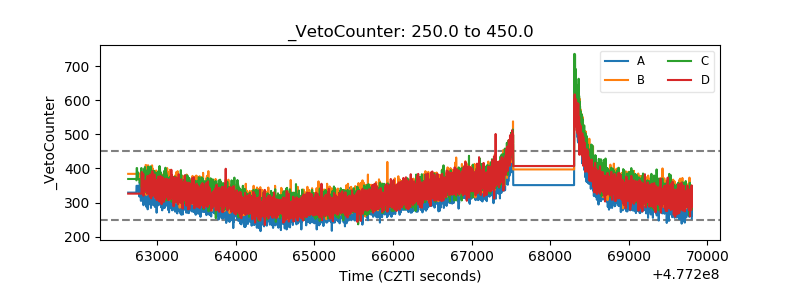 |