| Param | Original file | Final file |
|---|---|---|
| Filename | modeM0/AS1C07_001T01_9000006450_50758cztM0_level2.fits | modeM0/AS1C07_001T01_9000006450_50758cztM0_level2_quad_clean.evt |
| Size (bytes) | 698,135,040 | 106,223,040 |
| Size | 665.8 MB | 101.3 MB |
| Events in quadrant A | 4,923,850 | 700,938 |
| Events in quadrant B | 5,908,079 | 722,597 |
| Events in quadrant C | 7,586,384 | 667,260 |
| Events in quadrant D | 6,840,286 | 599,609 |
| Mode SS | |||
|---|---|---|---|
| Quadrant | BADHDUFLAG | Total packets | Discarded packets |
| A | 0 | 154 | 0 |
| B | 0 | 154 | 0 |
| C | 0 | 154 | 0 |
| D | 0 | 154 | 0 |
| Mode M0 | |||
|---|---|---|---|
| Quadrant | BADHDUFLAG | Total packets | Discarded packets |
| A | 0 | 19793 | 2 |
| B | 0 | 22840 | 2 |
| C | 0 | 27843 | 2 |
| D | 0 | 25585 | 2 |
| Mode M9 | |||
|---|---|---|---|
| Quadrant | BADHDUFLAG | Total packets | Discarded packets |
| A | 0 | 4 | 0 |
| B | 0 | 4 | 0 |
| C | 0 | 5 | 0 |
| D | 0 | 5 | 0 |
| Quadrant | Total seconds | Saturated seconds | Saturation percentage |
|---|---|---|---|
| A | 7555 | 156 | 2.064858% |
| B | 7555 | 740 | 9.794838% |
| C | 7555 | 462 | 6.115156% |
| D | 7555 | 664 | 8.788882% |
Noise dominated data is calculated using 1-second bins in cleaned event files. If a bin has >2000 counts, and if more than 50% of those come from <1% of pixels, then it is considered to be noise-dominated and hence unusable.
| Quadrant | # 1 sec bins | Bins with >0 counts | Bins with >2000 counts | High rate bins dominated by noise | Noise dominated (total time) | Noise dominated (detector-on time) | Marked lightcurve |
|---|---|---|---|---|---|---|---|
| A | 7810 | 7556 | 39 | 39 | 0.50% | 0.52% | 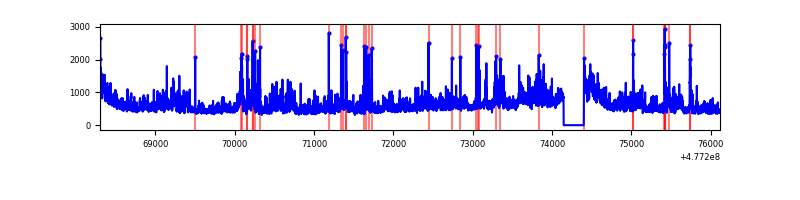 |
| B | 7810 | 7556 | 401 | 401 | 5.13% | 5.31% | 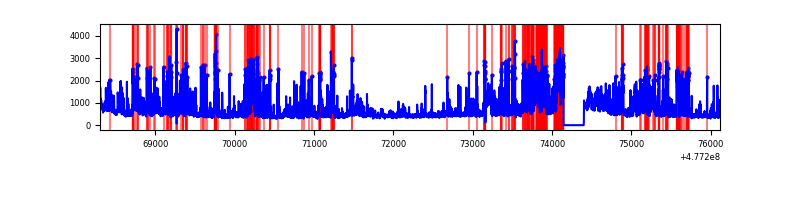 |
| C | 7810 | 7556 | 321 | 321 | 4.11% | 4.25% | 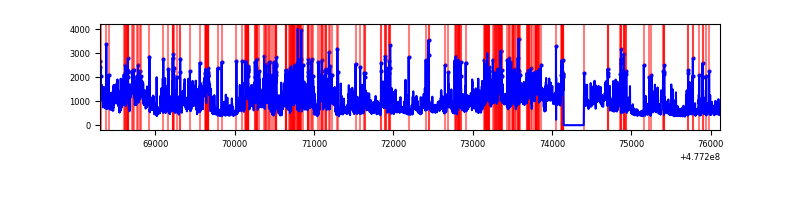 |
| D | 7810 | 7556 | 521 | 521 | 6.67% | 6.90% | 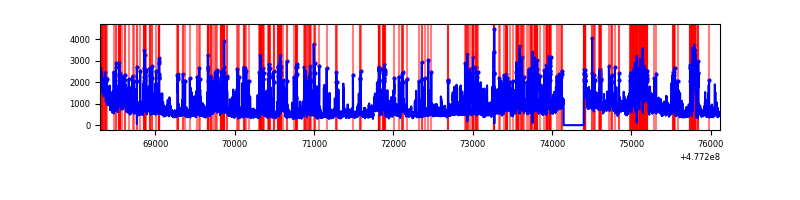 |
Top three noisy pixels from each quadrant. If the there are fewer than three noisy pixels in the level2.evt file, extra rows are filled as -1
| Pixel properties | Quadrant properties | ||||||
|---|---|---|---|---|---|---|---|
| Quadrant | DetID | PixID | Counts | Sigma | Mean | Median | Sigma |
| A | 4 | 4 | 580186 | 2842.24 | 807 | 785 | 203.9 |
| A | 14 | 254 | 399218 | 1954.51 | 807 | 785 | 203.9 |
| A | 4 | 3 | 223479 | 1092.42 | 807 | 785 | 203.9 |
| B | 4 | 206 | 1598725 | 9654.84 | 779 | 751 | 165.5 |
| B | 7 | 0 | 460263 | 2776.34 | 779 | 751 | 165.5 |
| B | 10 | 247 | 182493 | 1098.07 | 779 | 751 | 165.5 |
| C | 5 | 10 | 2711458 | 12487.82 | 782 | 772 | 217.1 |
| C | 13 | 3 | 398608 | 1832.79 | 782 | 772 | 217.1 |
| C | 9 | 38 | 230541 | 1058.52 | 782 | 772 | 217.1 |
| D | 7 | 96 | 684370 | 3262.18 | 752 | 726 | 209.6 |
| D | 15 | 93 | 622747 | 2968.13 | 752 | 726 | 209.6 |
| D | 2 | 216 | 574910 | 2739.86 | 752 | 726 | 209.6 |
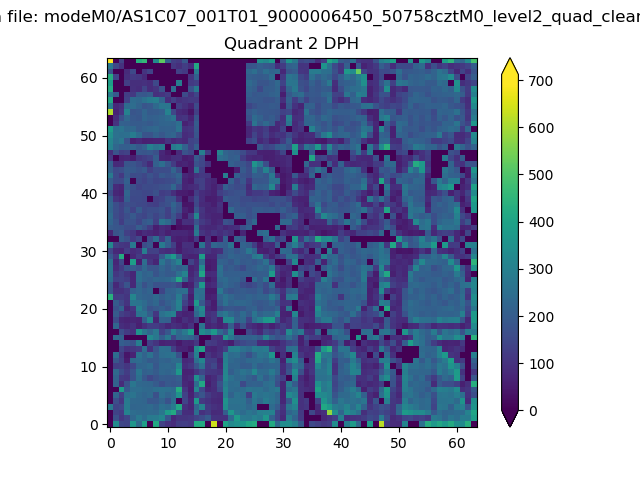
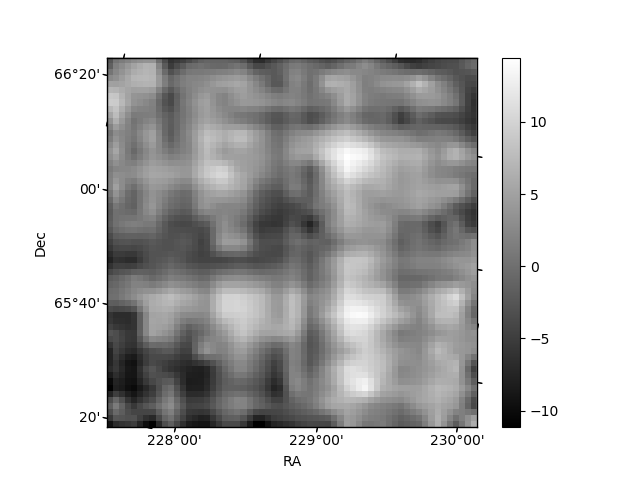
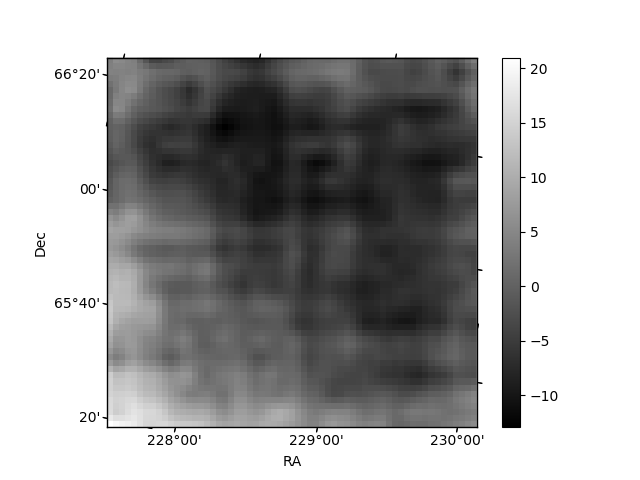
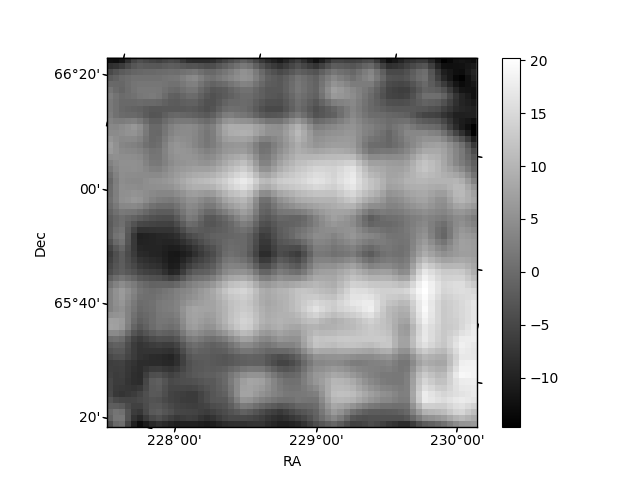
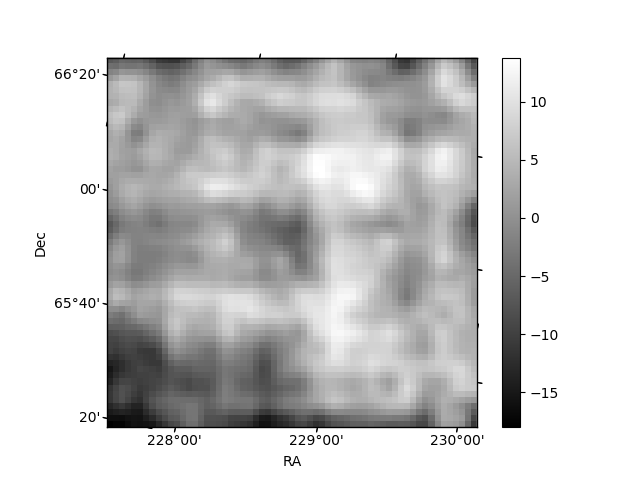
Histogram calculated using DETX and DETY for each event in the final _common_clean file
| Quadrant A | 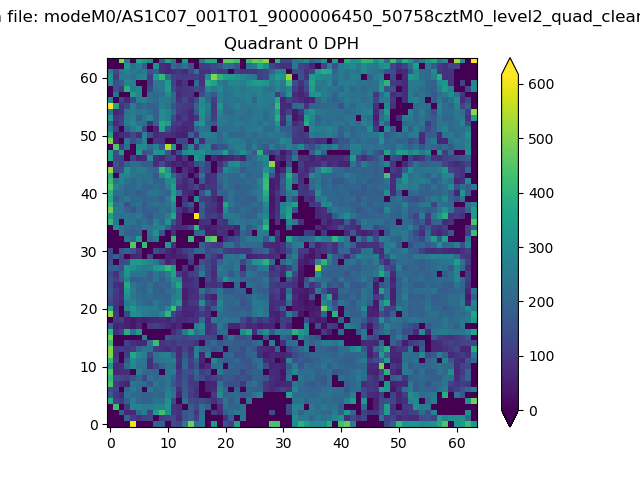 |
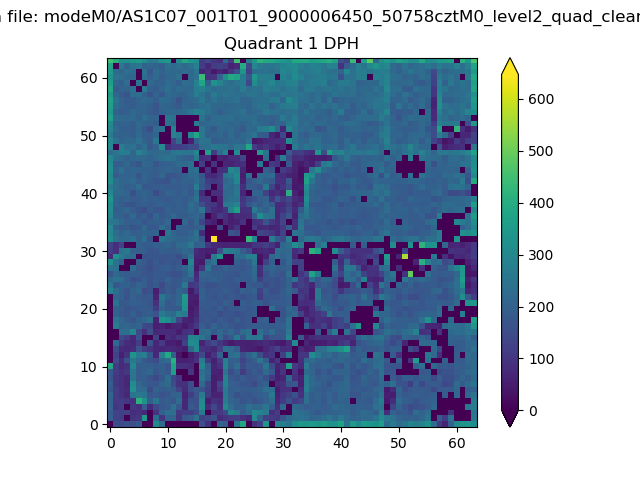 |
Quadrant B |
|---|---|---|---|
| Quadrant D | 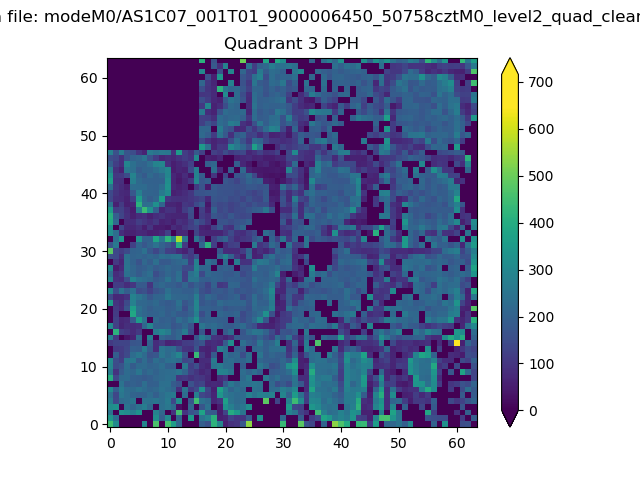 |
 |
Quadrant C |
| Plot type | Count rate plots | Images |
|---|---|---|
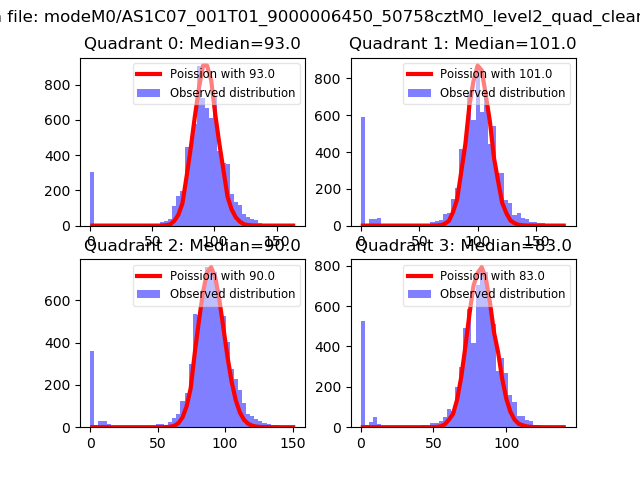
| Comparison with Poisson distribution Blue bars denote a histogram of data divided into 1 sec bins. Red curve is a Poisson curve with rate = median count rate of data. |
 |
 |
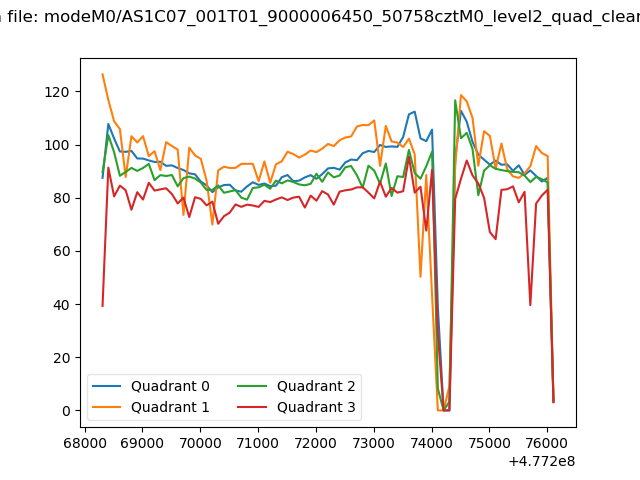
| Quadrant-wise count rates Data is divided into 100 sec bins |
 |
|
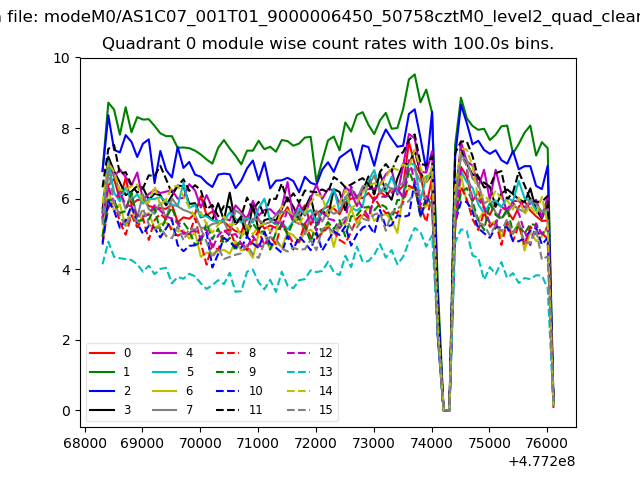
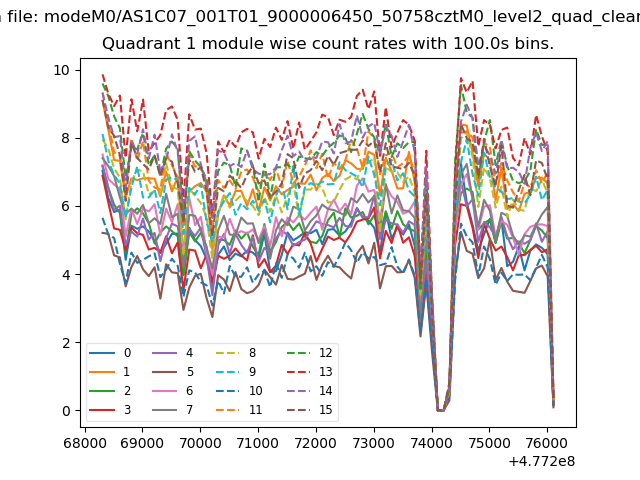
| Module-wise count rates for Quadrant A Data is divided into 100 sec bins |
 |
 |
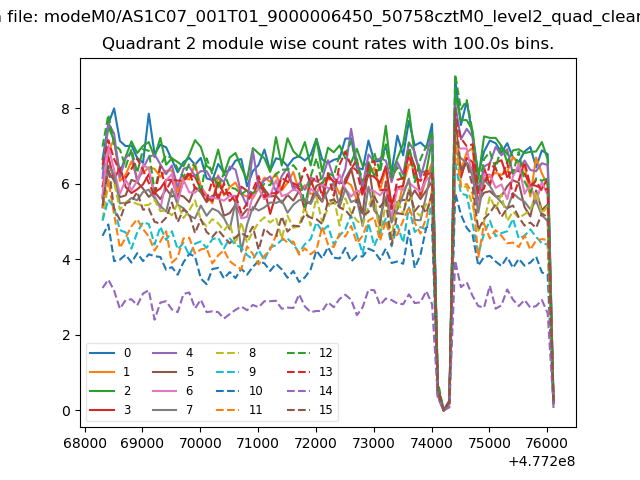
| Module-wise count rates for Quadrant B Data is divided into 100 sec bins |
 |
 |
| Module-wise count rates for Quadrant C Data is divided into 100 sec bins |
 |
 |
| Module-wise count rates for Quadrant D Data is divided into 100 sec bins |
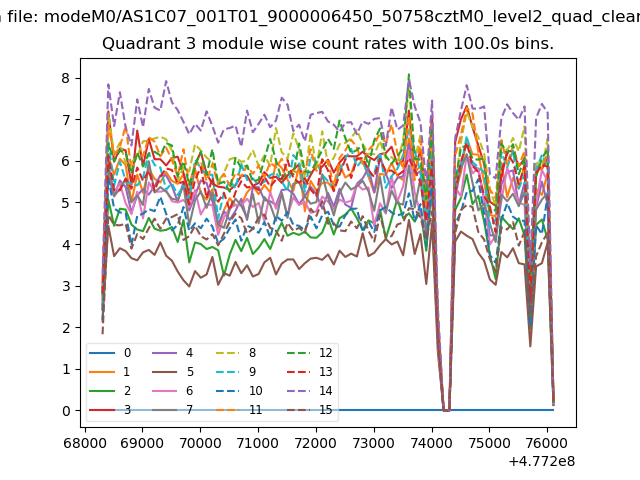 |
 |
| Parameter | Plot |
|---|---|
| CZT HV Monitor | 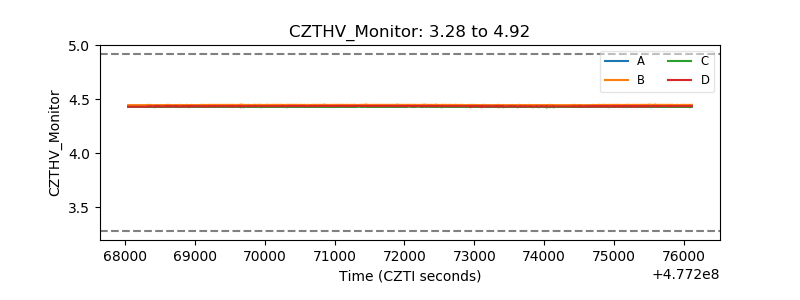 |
| D_VDD | 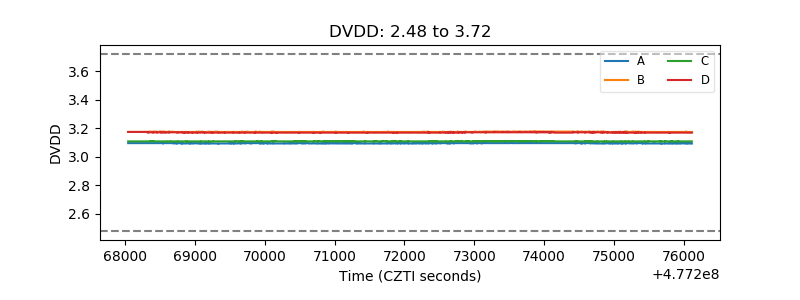 |
| Temperature 1 | 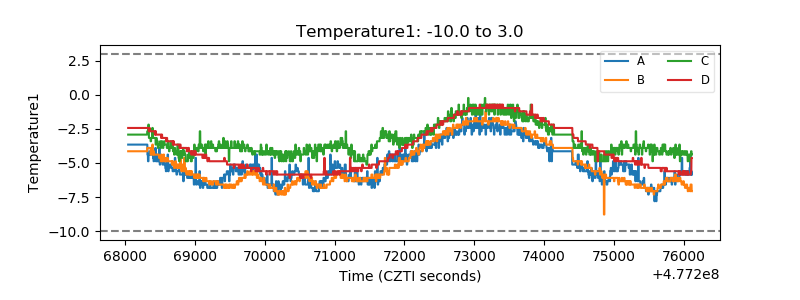 |
| Veto HV Monitor | 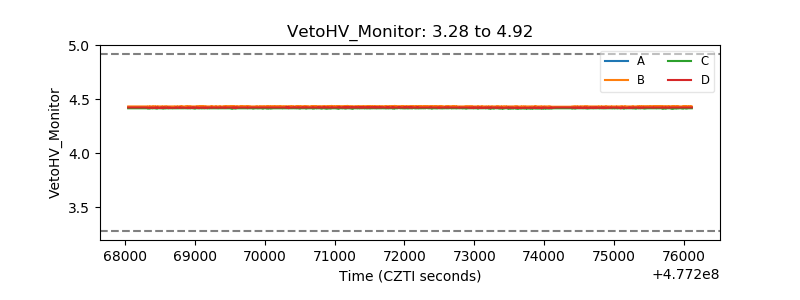 |
| Veto LLD | 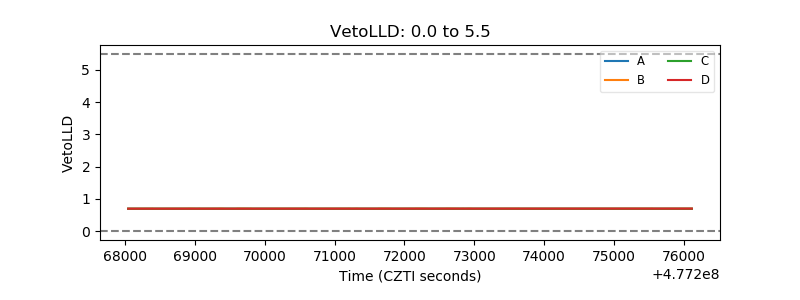 |
| Alpha Counter | 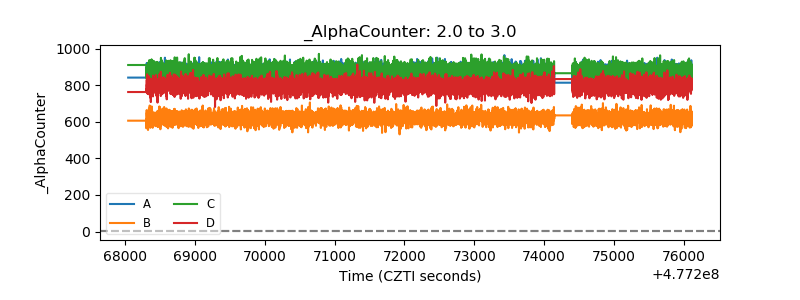 |
| _CPM_Rate | 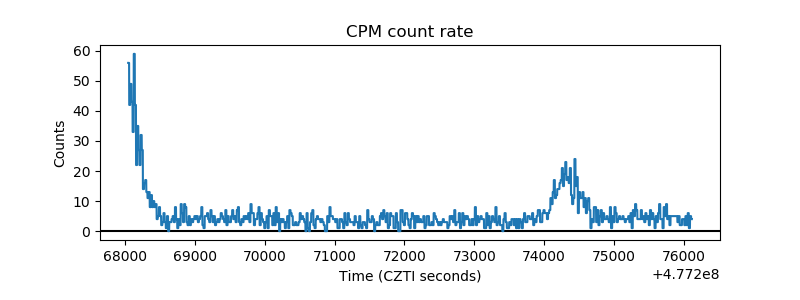 |
| CZT Counter | 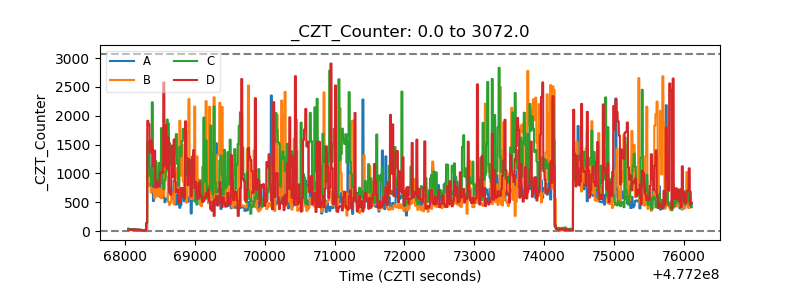 |
| +2.5 Volts monitor |  |
| +5 Volts monitor | 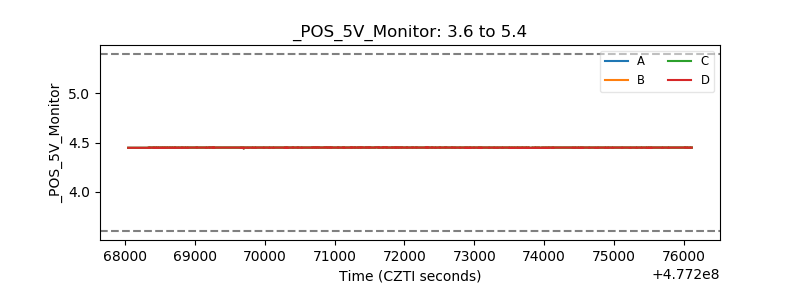 |
| _ROLL_ROT | 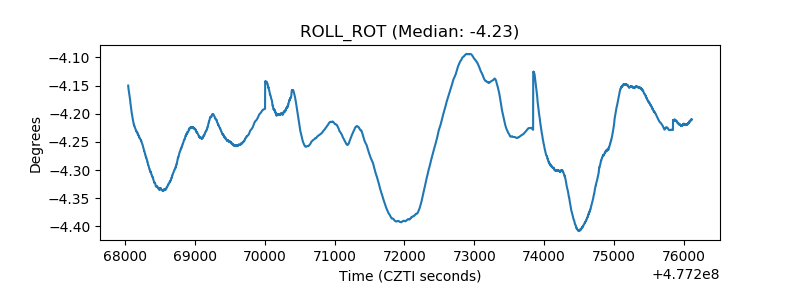 |
| _Roll_DEC | 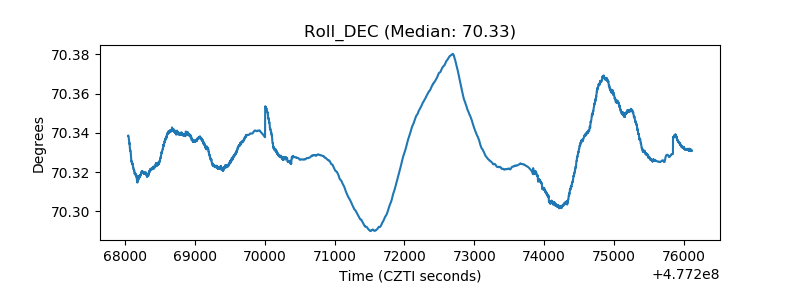 |
| _Roll_RA | 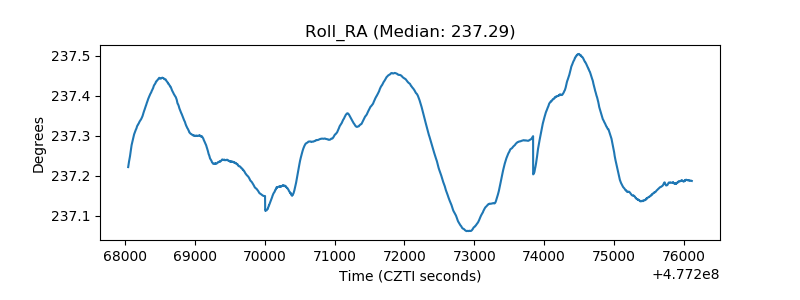 |
| Veto Counter | 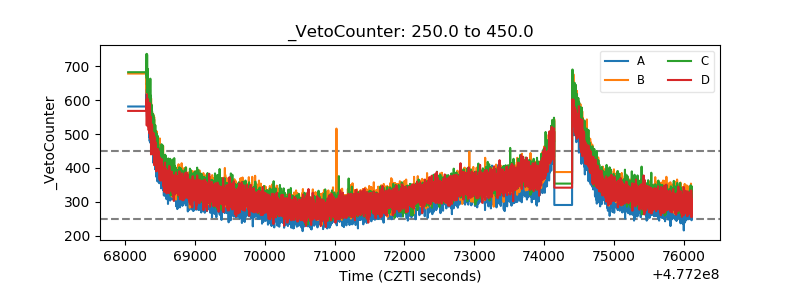 |