| Param | Original file | Final file |
|---|---|---|
| Filename | modeM0/AS1C07_001T01_9000006450_50759cztM0_level2.fits | modeM0/AS1C07_001T01_9000006450_50759cztM0_level2_quad_clean.evt |
| Size (bytes) | 804,378,240 | 117,639,360 |
| Size | 767.1 MB | 112.2 MB |
| Events in quadrant A | 5,298,389 | 795,933 |
| Events in quadrant B | 8,785,354 | 751,956 |
| Events in quadrant C | 7,639,853 | 742,951 |
| Events in quadrant D | 7,390,436 | 676,402 |
| Mode SS | |||
|---|---|---|---|
| Quadrant | BADHDUFLAG | Total packets | Discarded packets |
| A | 0 | 174 | 0 |
| B | 0 | 174 | 0 |
| C | 0 | 174 | 0 |
| D | 0 | 174 | 0 |
| Mode M0 | |||
|---|---|---|---|
| Quadrant | BADHDUFLAG | Total packets | Discarded packets |
| A | 0 | 21709 | 1 |
| B | 0 | 32187 | 1 |
| C | 0 | 28593 | 1 |
| D | 0 | 27991 | 1 |
| Mode M9 | |||
|---|---|---|---|
| Quadrant | BADHDUFLAG | Total packets | Discarded packets |
| A | 0 | 2 | 0 |
| B | 0 | 2 | 0 |
| C | 0 | 2 | 0 |
| D | 0 | 2 | 0 |
| Quadrant | Total seconds | Saturated seconds | Saturation percentage |
|---|---|---|---|
| A | 8556 | 192 | 2.244039% |
| B | 8556 | 1554 | 18.162693% |
| C | 8557 | 602 | 7.035176% |
| D | 8557 | 715 | 8.355732% |
Noise dominated data is calculated using 1-second bins in cleaned event files. If a bin has >2000 counts, and if more than 50% of those come from <1% of pixels, then it is considered to be noise-dominated and hence unusable.
| Quadrant | # 1 sec bins | Bins with >0 counts | Bins with >2000 counts | High rate bins dominated by noise | Noise dominated (total time) | Noise dominated (detector-on time) | Marked lightcurve |
|---|---|---|---|---|---|---|---|
| A | 8811 | 8557 | 88 | 88 | 1.00% | 1.03% | 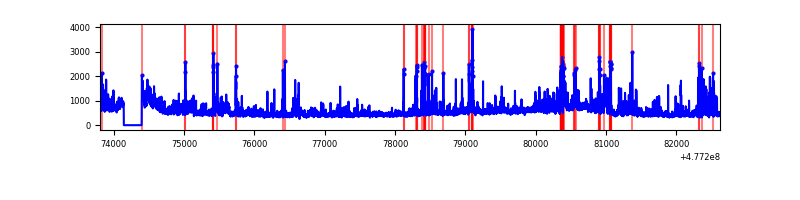 |
| B | 8811 | 8557 | 961 | 961 | 10.91% | 11.23% | 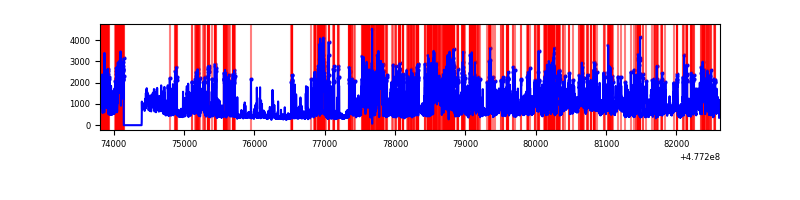 |
| C | 8812 | 8558 | 423 | 423 | 4.80% | 4.94% | 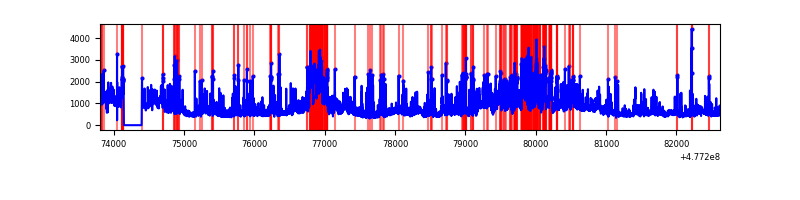 |
| D | 8812 | 8558 | 515 | 515 | 5.84% | 6.02% | 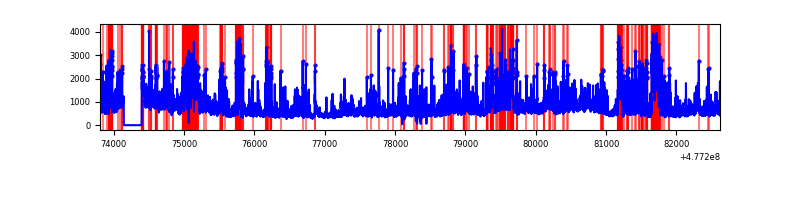 |
Top three noisy pixels from each quadrant. If the there are fewer than three noisy pixels in the level2.evt file, extra rows are filled as -1
| Pixel properties | Quadrant properties | ||||||
|---|---|---|---|---|---|---|---|
| Quadrant | DetID | PixID | Counts | Sigma | Mean | Median | Sigma |
| A | 4 | 4 | 392069 | 1705.0 | 915 | 894 | 229.4 |
| A | 4 | 3 | 233593 | 1014.26 | 915 | 894 | 229.4 |
| A | 3 | 63 | 124920 | 540.59 | 915 | 894 | 229.4 |
| B | 4 | 206 | 4236952 | 23158.51 | 859 | 829 | 182.9 |
| B | 7 | 0 | 419982 | 2291.47 | 859 | 829 | 182.9 |
| B | 10 | 247 | 136938 | 744.1 | 859 | 829 | 182.9 |
| C | 5 | 10 | 1581493 | 6573.97 | 881 | 873 | 240.4 |
| C | 10 | 69 | 726141 | 3016.47 | 881 | 873 | 240.4 |
| C | 13 | 3 | 544447 | 2260.78 | 881 | 873 | 240.4 |
| D | 15 | 93 | 799799 | 3372.64 | 857 | 828 | 236.9 |
| D | 2 | 216 | 544700 | 2295.81 | 857 | 828 | 236.9 |
| D | 15 | 108 | 327644 | 1379.56 | 857 | 828 | 236.9 |
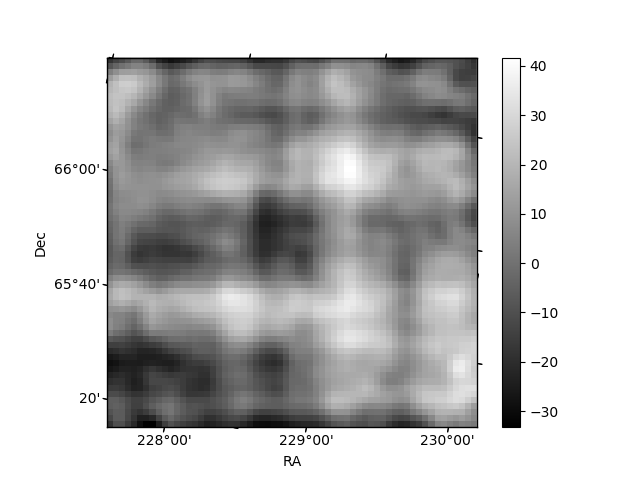
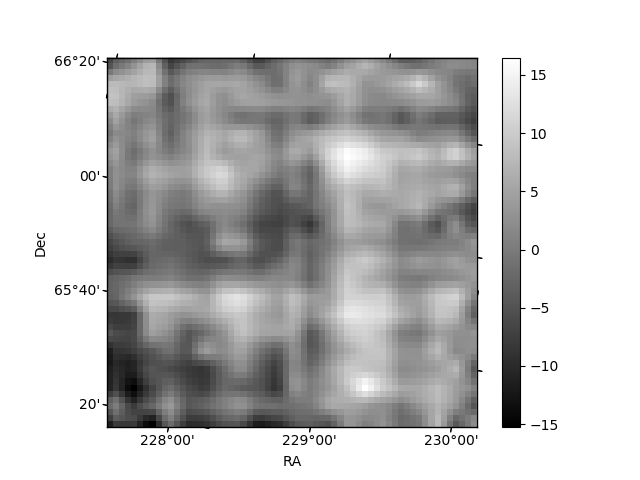
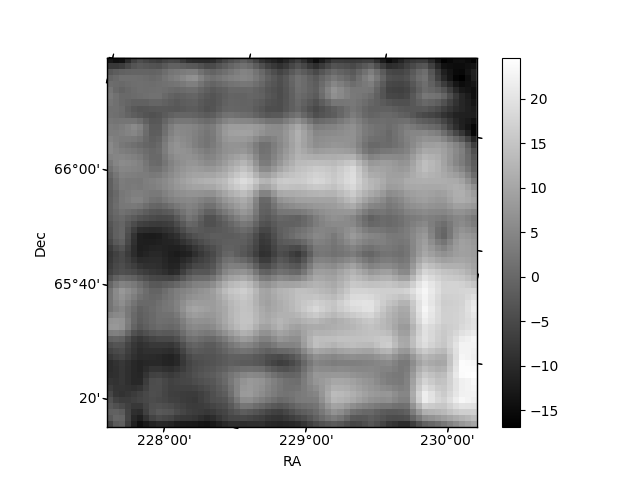
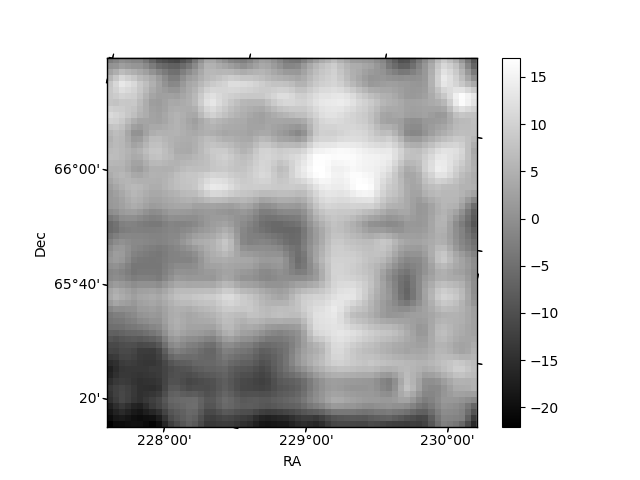
Histogram calculated using DETX and DETY for each event in the final _common_clean file
| Quadrant A | 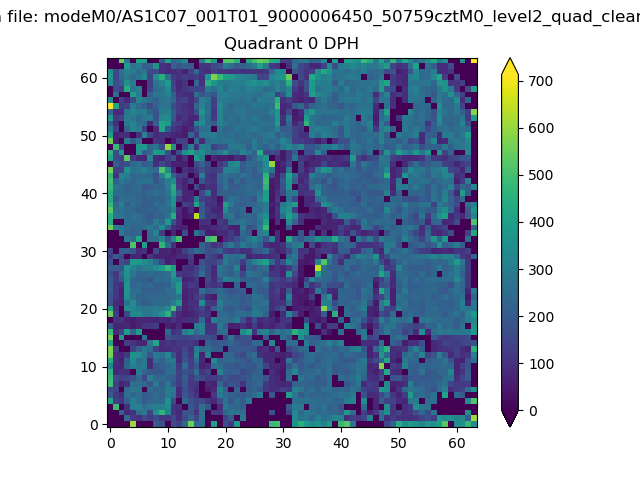 |
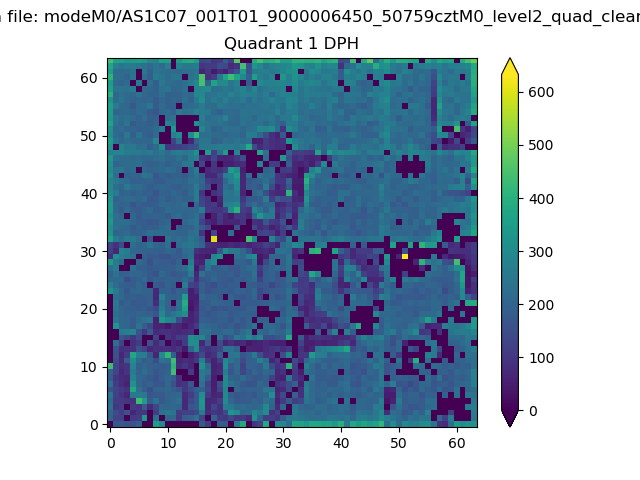 |
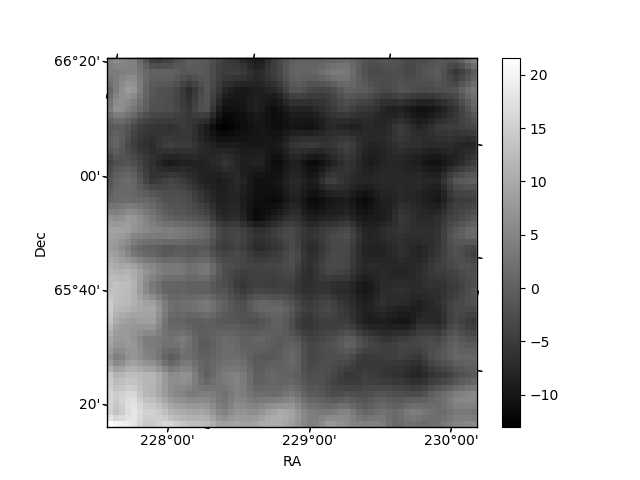
Quadrant B |
|---|---|---|---|
| Quadrant D | 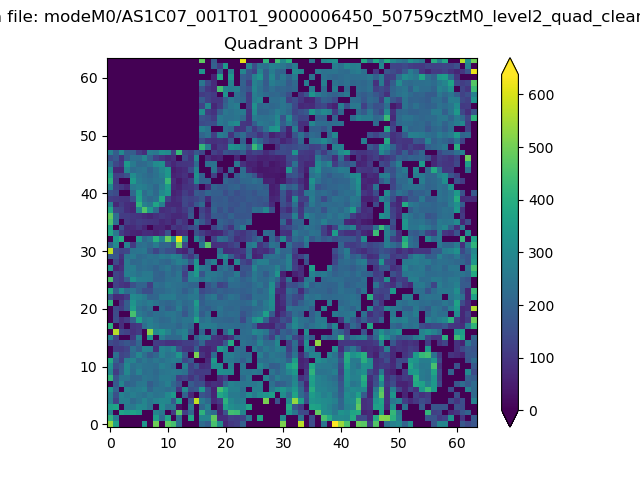 |
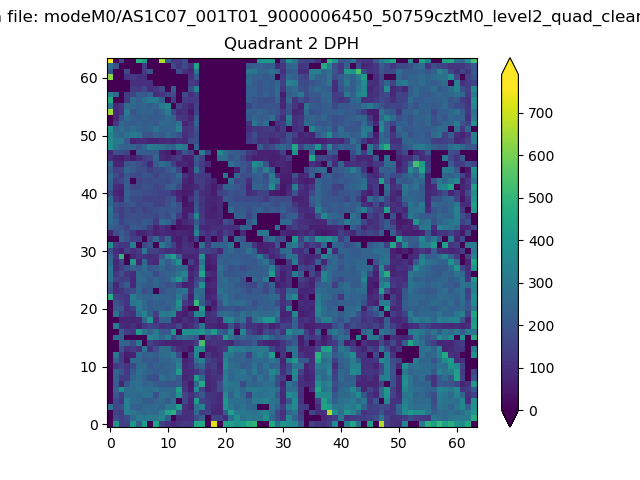 |
Quadrant C |
| Plot type | Count rate plots | Images |
|---|---|---|
| Comparison with Poisson distribution Blue bars denote a histogram of data divided into 1 sec bins. Red curve is a Poisson curve with rate = median count rate of data. |
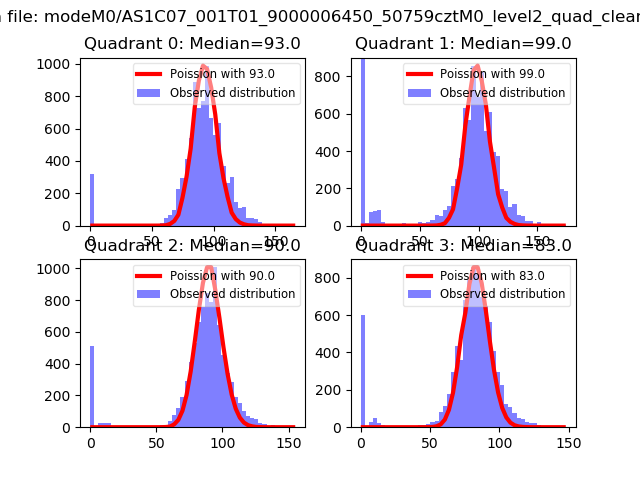 |
 |
| Quadrant-wise count rates Data is divided into 100 sec bins |
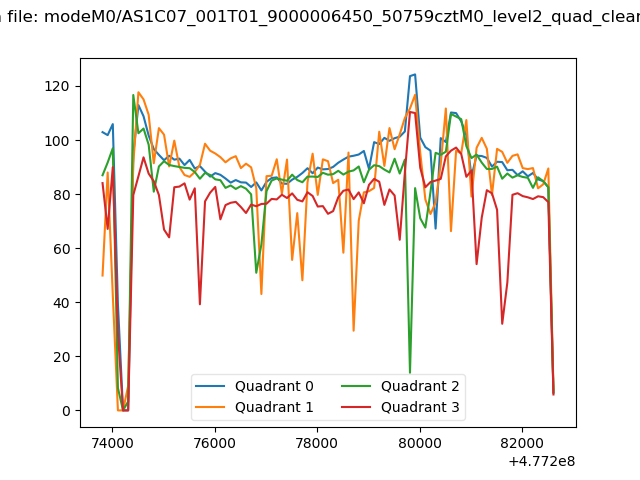 |
|
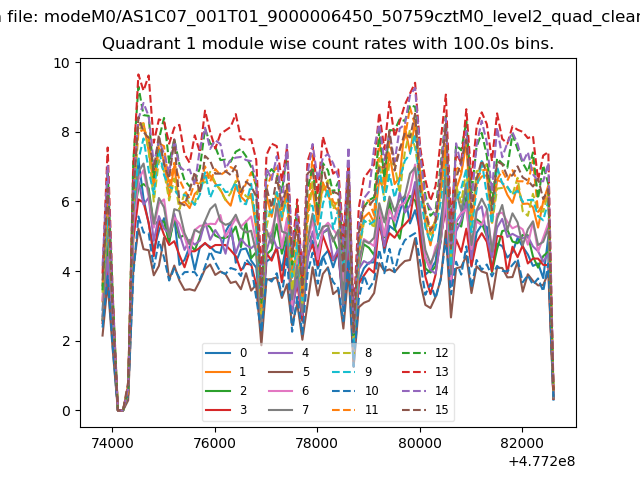
| Module-wise count rates for Quadrant A Data is divided into 100 sec bins |
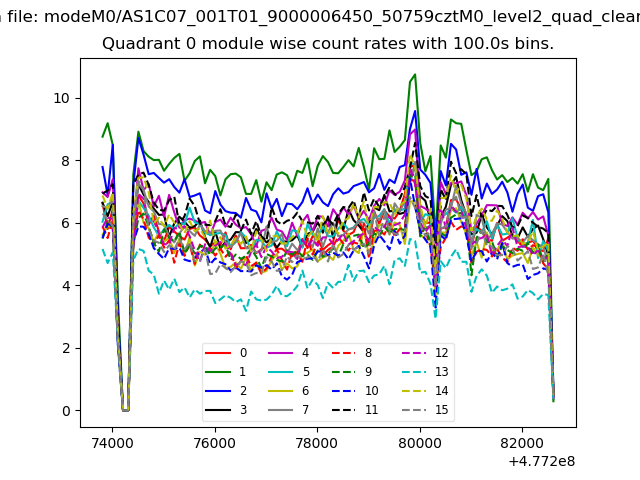 |
 |
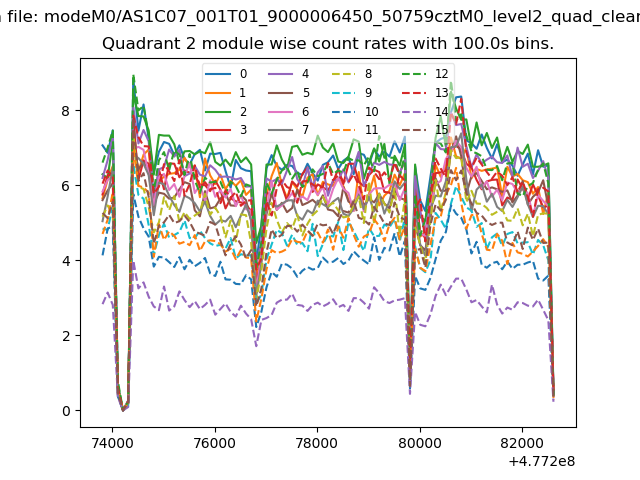
| Module-wise count rates for Quadrant B Data is divided into 100 sec bins |
 |
 |
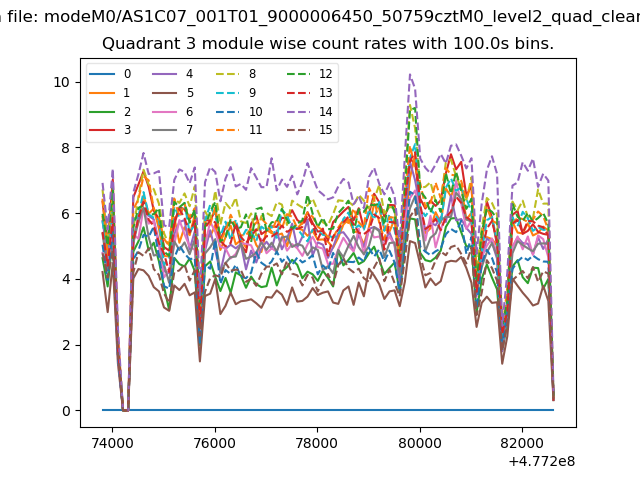
| Module-wise count rates for Quadrant C Data is divided into 100 sec bins |
 |
 |
| Module-wise count rates for Quadrant D Data is divided into 100 sec bins |
 |
 |
| Parameter | Plot |
|---|---|
| CZT HV Monitor | 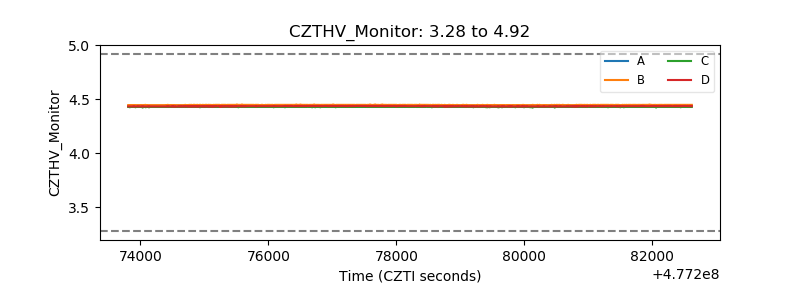 |
| D_VDD | 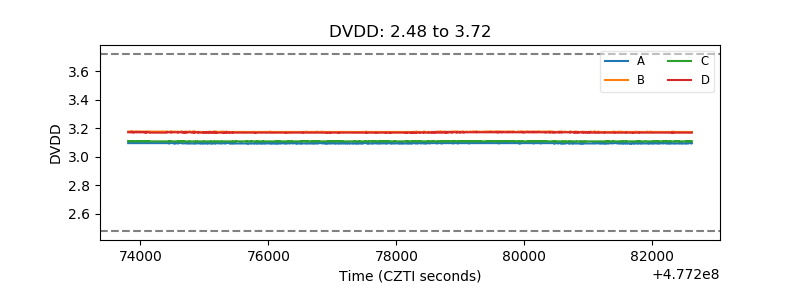 |
| Temperature 1 | 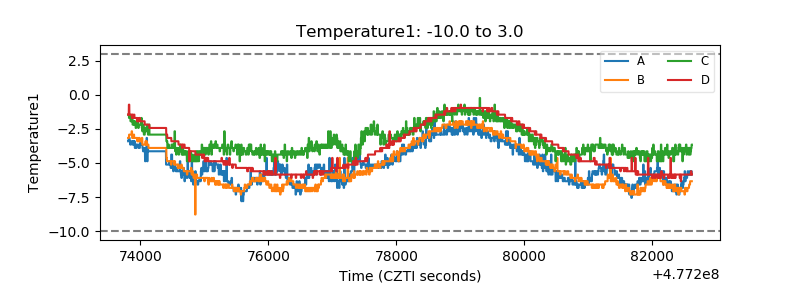 |
| Veto HV Monitor |  |
| Veto LLD | 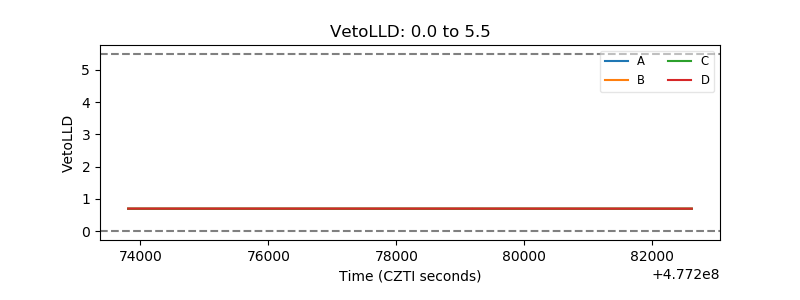 |
| Alpha Counter | 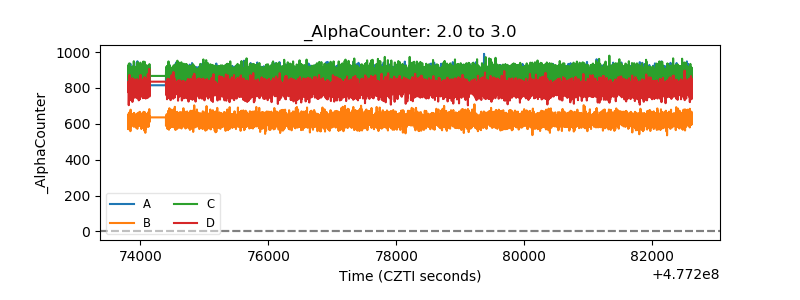 |
| _CPM_Rate | 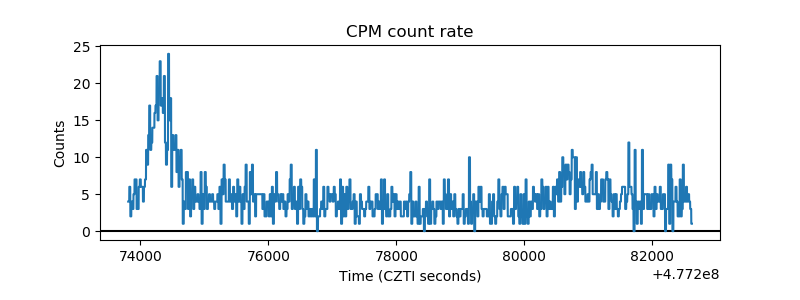 |
| CZT Counter | 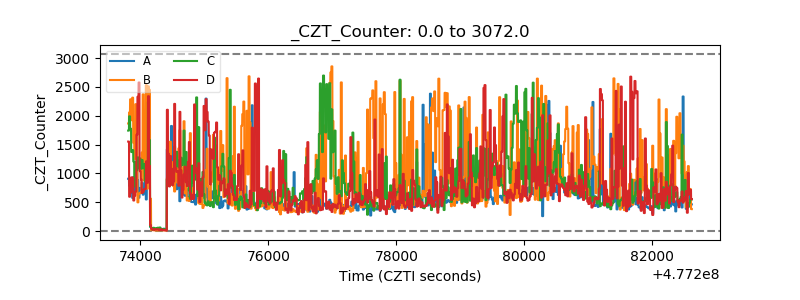 |
| +2.5 Volts monitor |  |
| +5 Volts monitor |  |
| _ROLL_ROT | 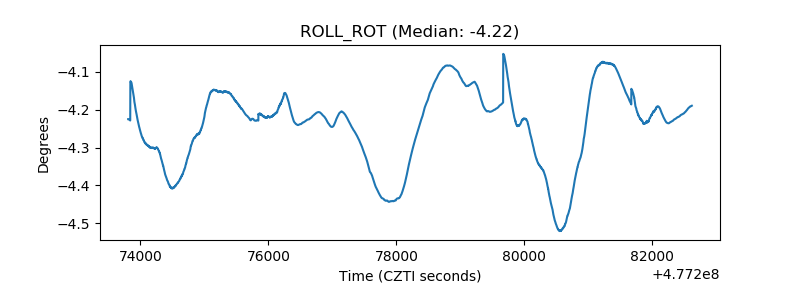 |
| _Roll_DEC | 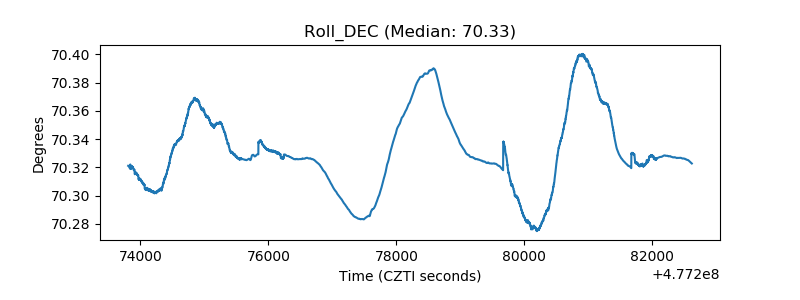 |
| _Roll_RA | 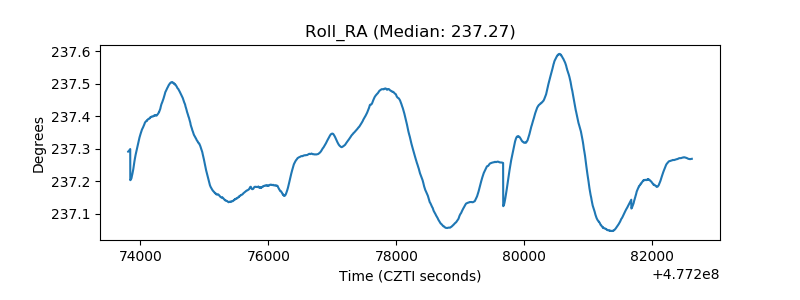 |
| Veto Counter | 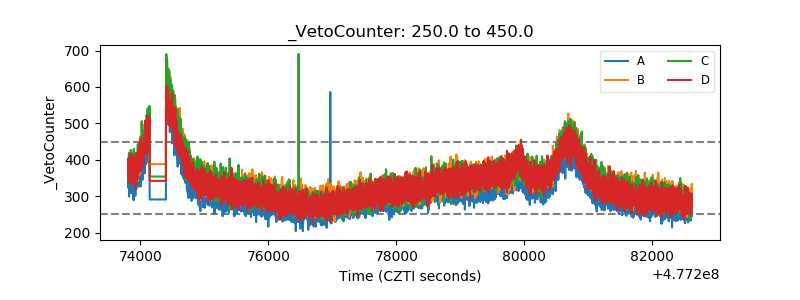 |