| Param | Original file | Final file |
|---|---|---|
| Filename | modeM0/AS1C07_001T01_9000006450_50760cztM0_level2.fits | modeM0/AS1C07_001T01_9000006450_50760cztM0_level2_quad_clean.evt |
| Size (bytes) | 722,324,160 | 107,455,680 |
| Size | 688.9 MB | 102.5 MB |
| Events in quadrant A | 5,202,887 | 719,130 |
| Events in quadrant B | 7,216,260 | 732,921 |
| Events in quadrant C | 6,888,069 | 631,231 |
| Events in quadrant D | 6,822,362 | 622,960 |
| Mode SS | |||
|---|---|---|---|
| Quadrant | BADHDUFLAG | Total packets | Discarded packets |
| A | 0 | 158 | 0 |
| B | 0 | 158 | 0 |
| C | 0 | 158 | 0 |
| D | 0 | 158 | 0 |
| Mode M0 | |||
|---|---|---|---|
| Quadrant | BADHDUFLAG | Total packets | Discarded packets |
| A | 0 | 20857 | 0 |
| B | 0 | 26982 | 0 |
| C | 0 | 25765 | 0 |
| D | 0 | 25777 | 0 |
| Quadrant | Total seconds | Saturated seconds | Saturation percentage |
|---|---|---|---|
| A | 7865 | 177 | 2.250477% |
| B | 7865 | 852 | 10.832804% |
| C | 7864 | 941 | 11.965921% |
| D | 7865 | 510 | 6.484425% |
Noise dominated data is calculated using 1-second bins in cleaned event files. If a bin has >2000 counts, and if more than 50% of those come from <1% of pixels, then it is considered to be noise-dominated and hence unusable.
| Quadrant | # 1 sec bins | Bins with >0 counts | Bins with >2000 counts | High rate bins dominated by noise | Noise dominated (total time) | Noise dominated (detector-on time) | Marked lightcurve |
|---|---|---|---|---|---|---|---|
| A | 7865 | 7865 | 138 | 138 | 1.75% | 1.75% | 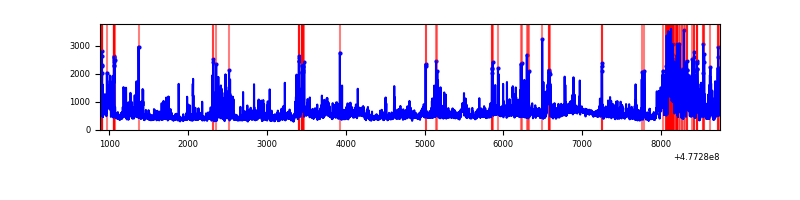 |
| B | 7865 | 7865 | 569 | 569 | 7.23% | 7.23% | 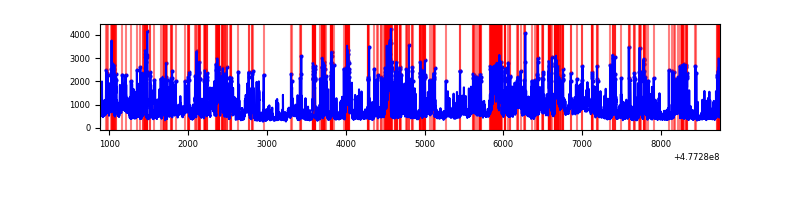 |
| C | 7864 | 7864 | 537 | 537 | 6.83% | 6.83% | 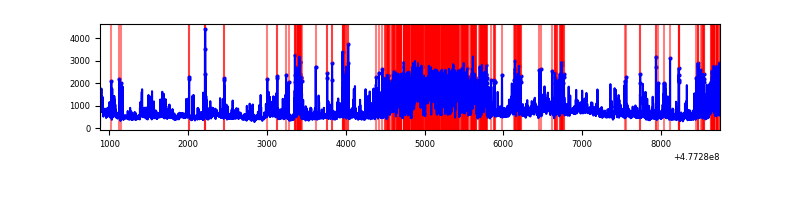 |
| D | 7865 | 7865 | 445 | 445 | 5.66% | 5.66% | 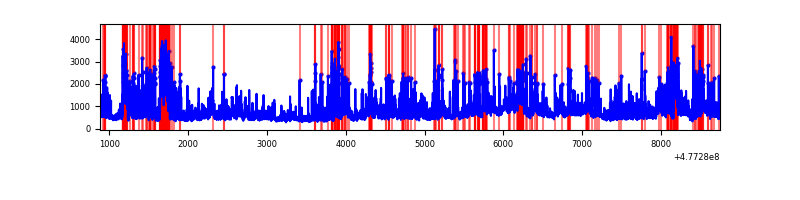 |
Top three noisy pixels from each quadrant. If the there are fewer than three noisy pixels in the level2.evt file, extra rows are filled as -1
| Pixel properties | Quadrant properties | ||||||
|---|---|---|---|---|---|---|---|
| Quadrant | DetID | PixID | Counts | Sigma | Mean | Median | Sigma |
| A | 4 | 4 | 620331 | 3072.01 | 815 | 796 | 201.7 |
| A | 14 | 254 | 390823 | 1933.97 | 815 | 796 | 201.7 |
| A | 4 | 3 | 120887 | 595.48 | 815 | 796 | 201.7 |
| B | 4 | 206 | 2634771 | 15427.11 | 796 | 767 | 170.7 |
| B | 7 | 0 | 646482 | 3781.89 | 796 | 767 | 170.7 |
| B | 10 | 247 | 203439 | 1187.03 | 796 | 767 | 170.7 |
| C | 4 | 210 | 1808581 | 8706.11 | 762 | 759 | 207.6 |
| C | 12 | 247 | 453883 | 2182.15 | 762 | 759 | 207.6 |
| C | 13 | 3 | 296607 | 1424.74 | 762 | 759 | 207.6 |
| D | 2 | 216 | 632526 | 2933.49 | 769 | 741 | 215.4 |
| D | 15 | 93 | 498276 | 2310.14 | 769 | 741 | 215.4 |
| D | 15 | 108 | 402044 | 1863.32 | 769 | 741 | 215.4 |
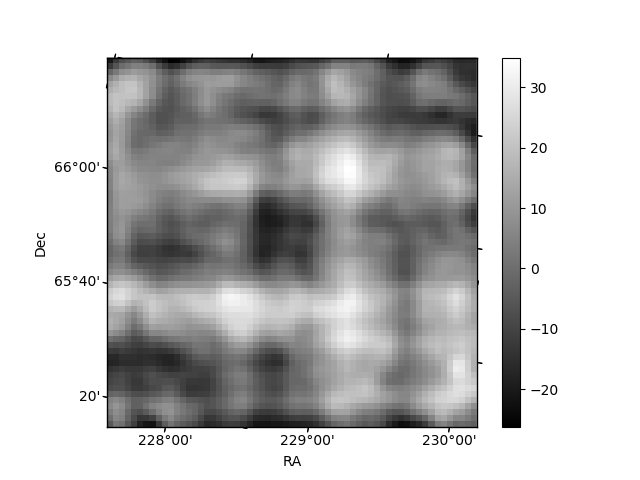
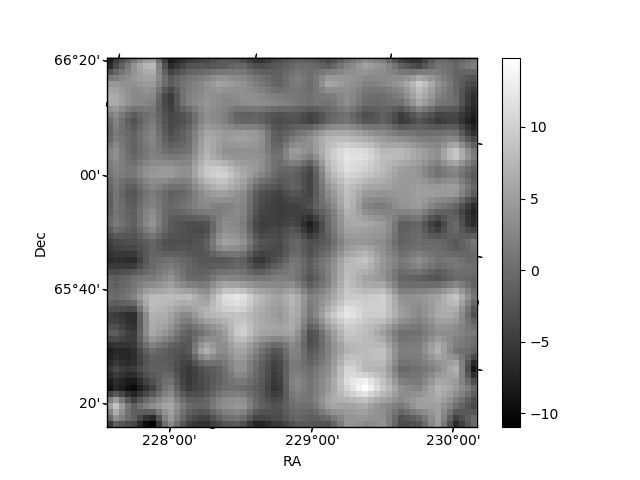
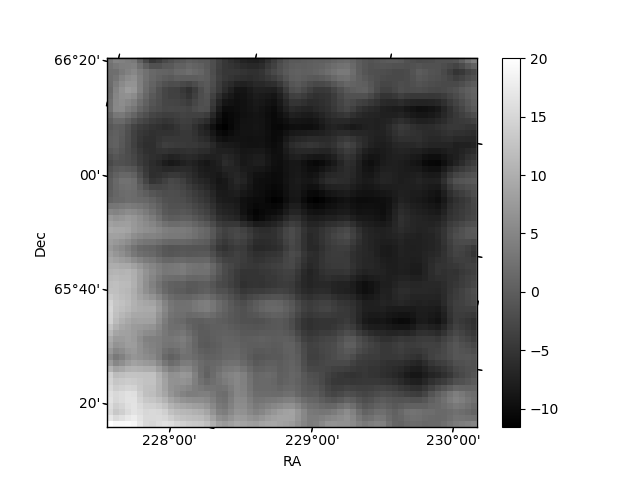
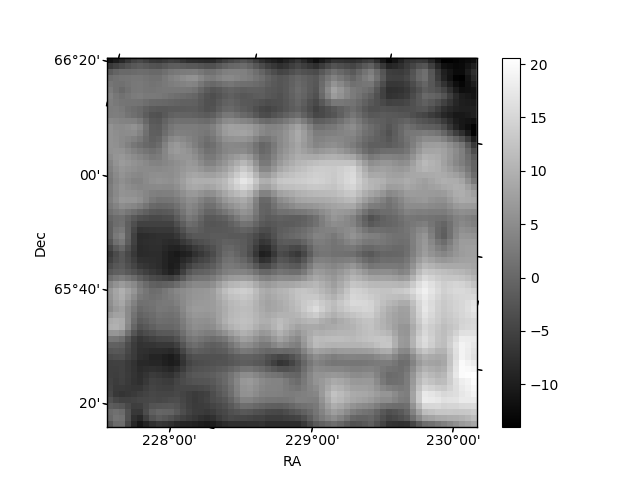
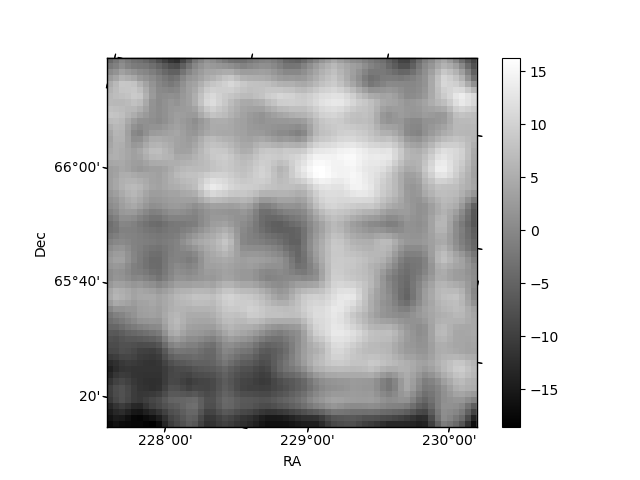
Histogram calculated using DETX and DETY for each event in the final _common_clean file
| Quadrant A | 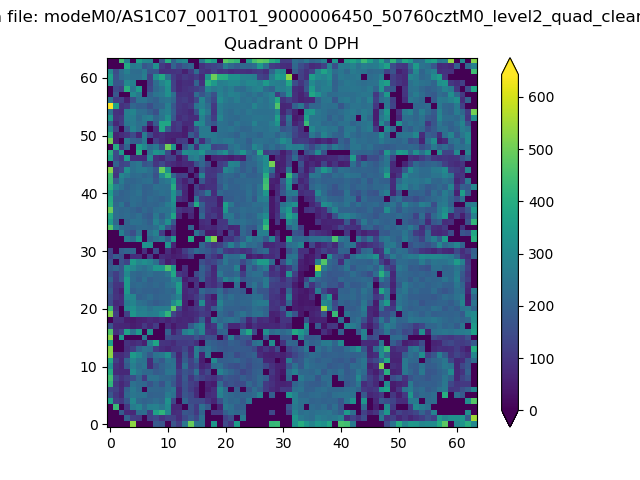 |
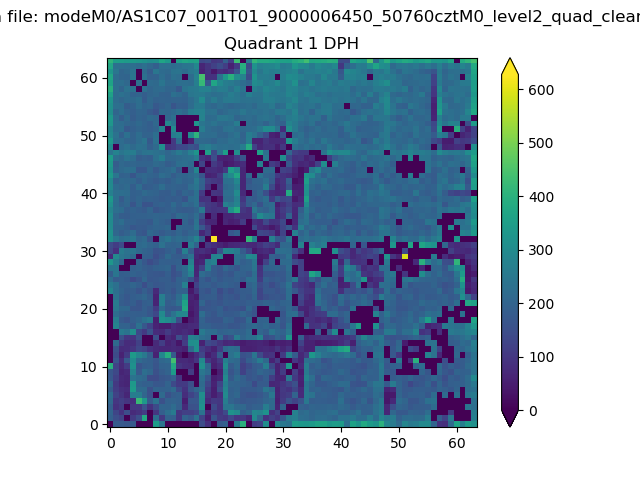 |
Quadrant B |
|---|---|---|---|
| Quadrant D | 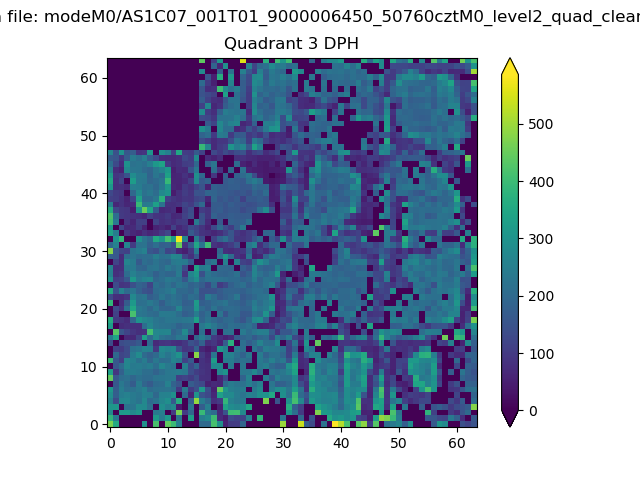 |
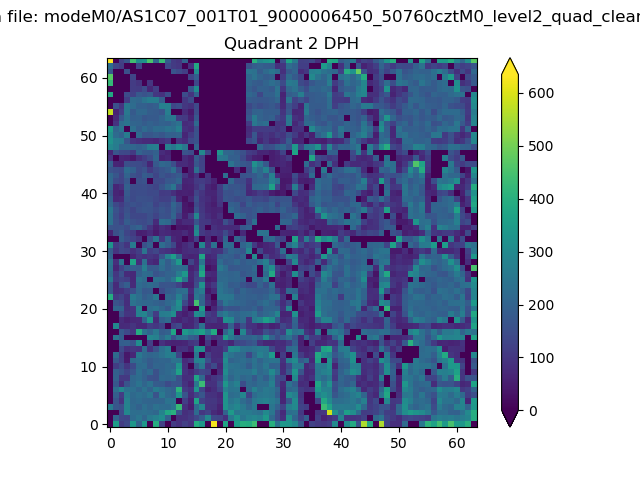 |
Quadrant C |
| Plot type | Count rate plots | Images |
|---|---|---|
| Comparison with Poisson distribution Blue bars denote a histogram of data divided into 1 sec bins. Red curve is a Poisson curve with rate = median count rate of data. |
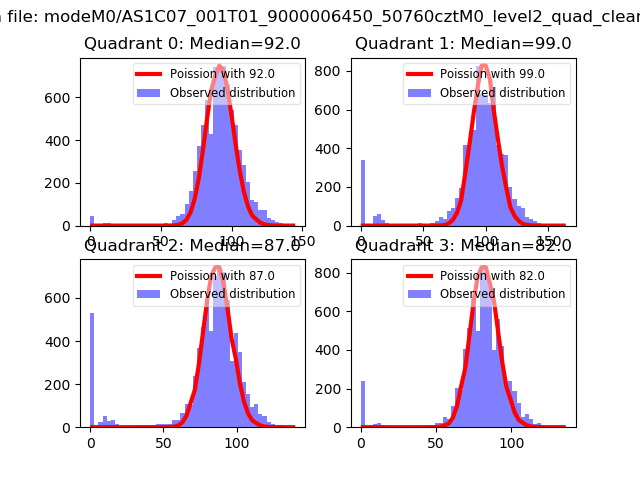 |
 |
| Quadrant-wise count rates Data is divided into 100 sec bins |
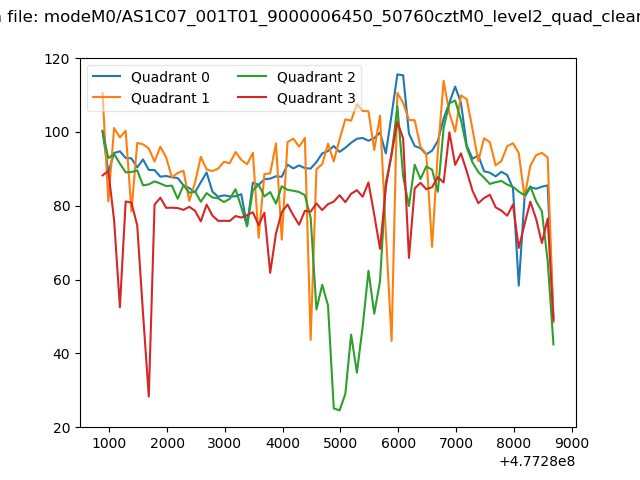 |
|
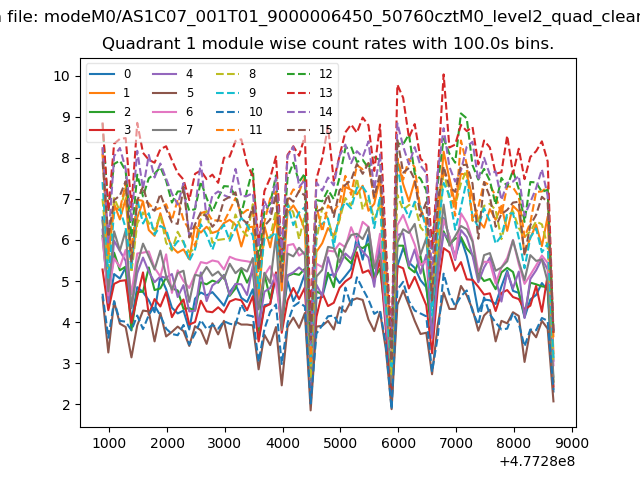
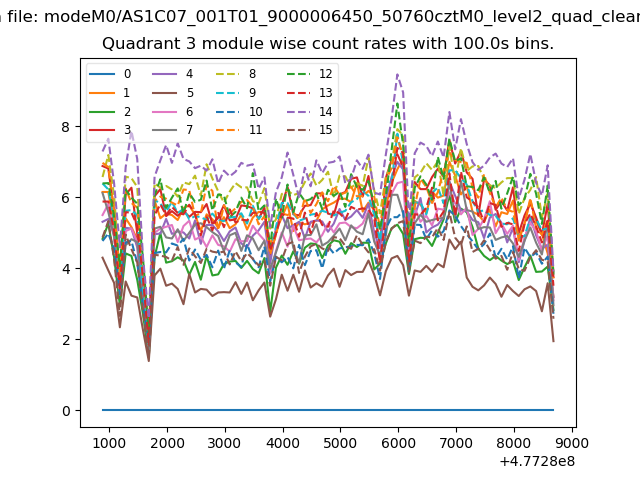
| Module-wise count rates for Quadrant A Data is divided into 100 sec bins |
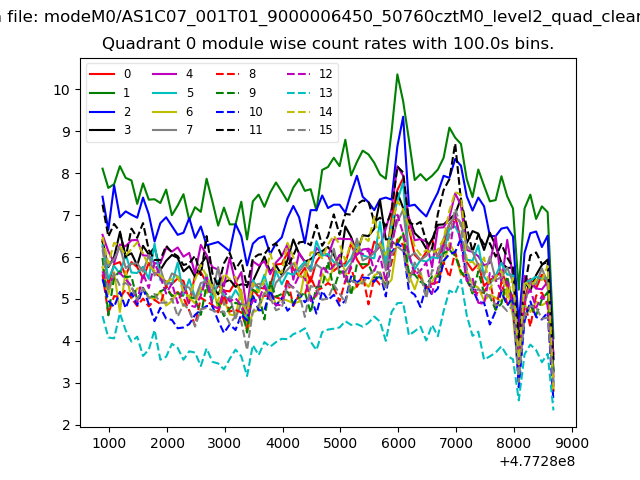 |
 |
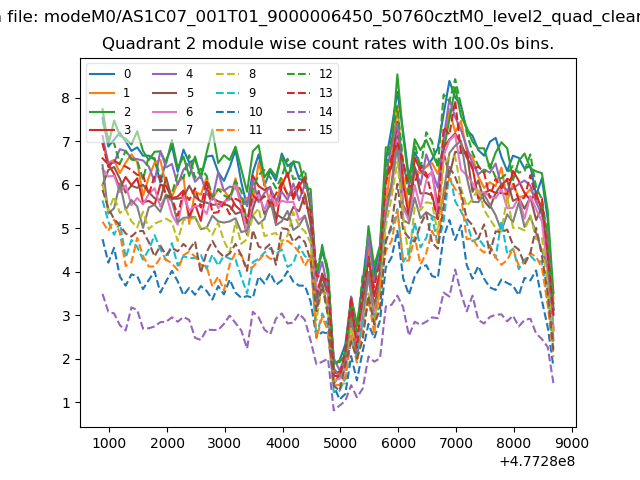
| Module-wise count rates for Quadrant B Data is divided into 100 sec bins |
 |
 |
| Module-wise count rates for Quadrant C Data is divided into 100 sec bins |
 |
 |
| Module-wise count rates for Quadrant D Data is divided into 100 sec bins |
 |
 |
| Parameter | Plot |
|---|---|
| CZT HV Monitor |  |
| D_VDD | 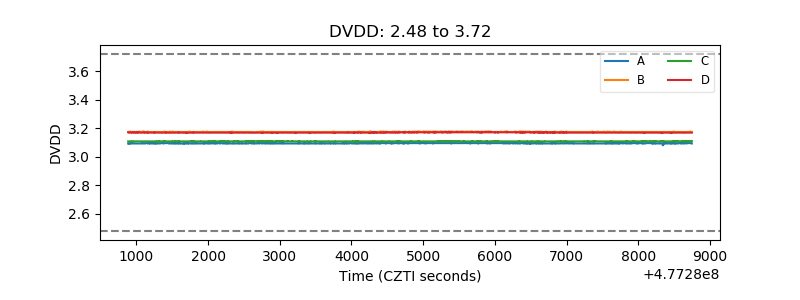 |
| Temperature 1 | 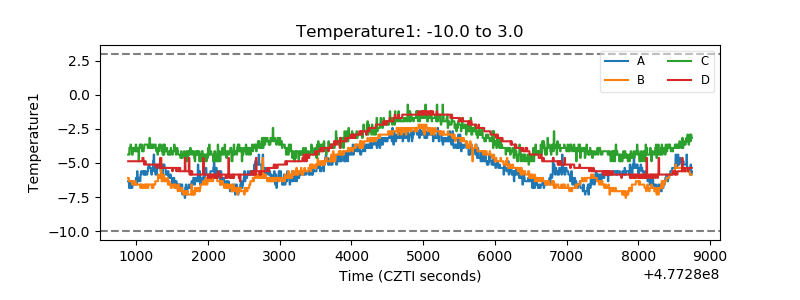 |
| Veto HV Monitor | 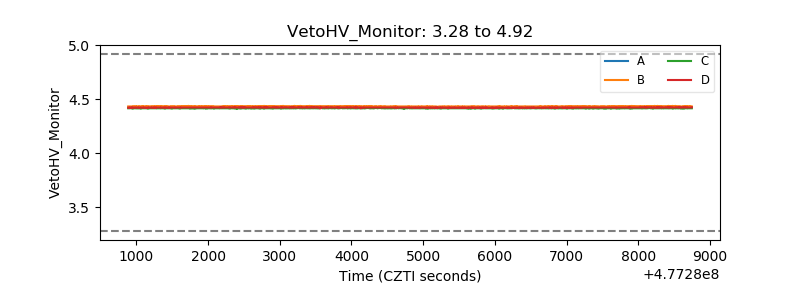 |
| Veto LLD | 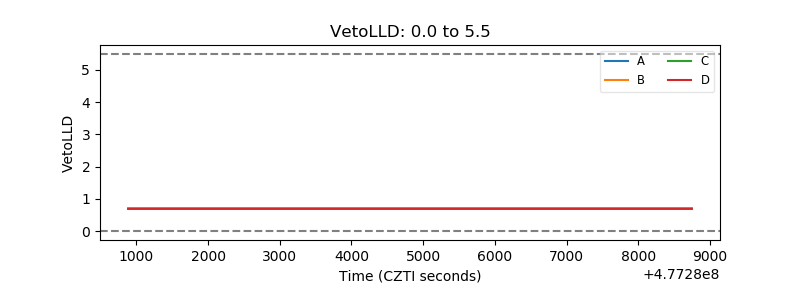 |
| Alpha Counter | 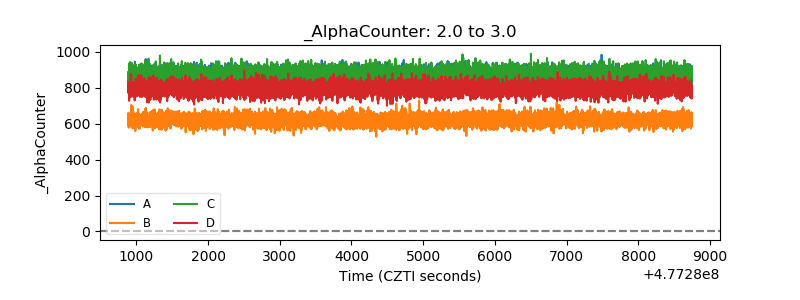 |
| _CPM_Rate | 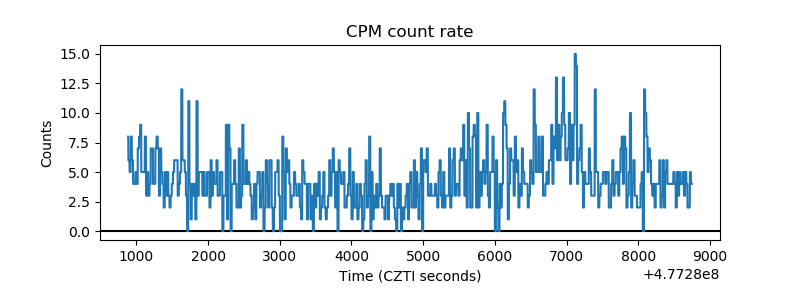 |
| CZT Counter | 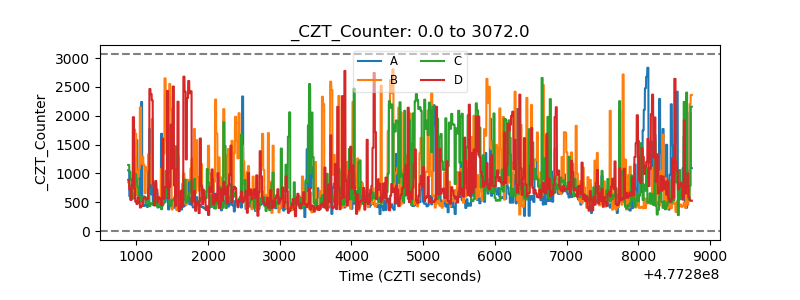 |
| +2.5 Volts monitor | 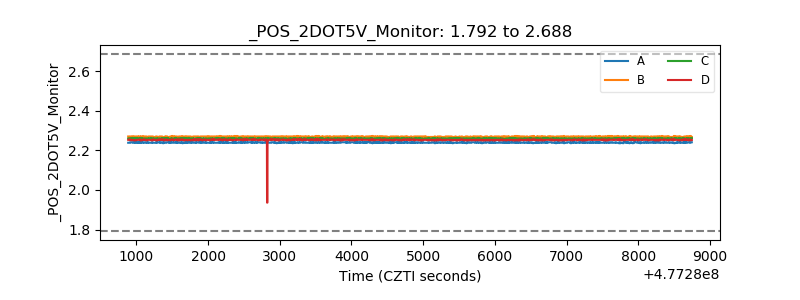 |
| +5 Volts monitor | 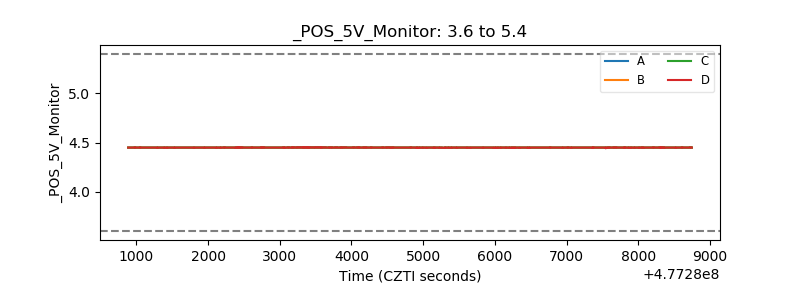 |
| _ROLL_ROT | 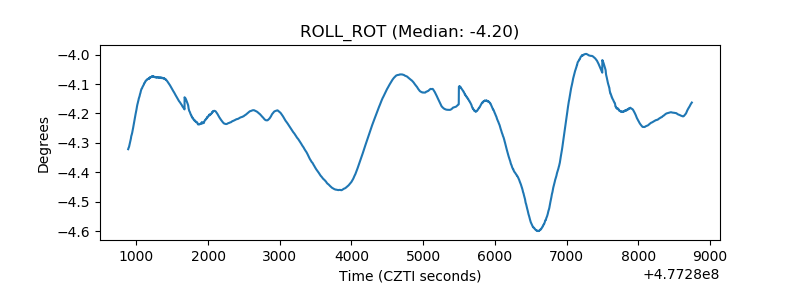 |
| _Roll_DEC | 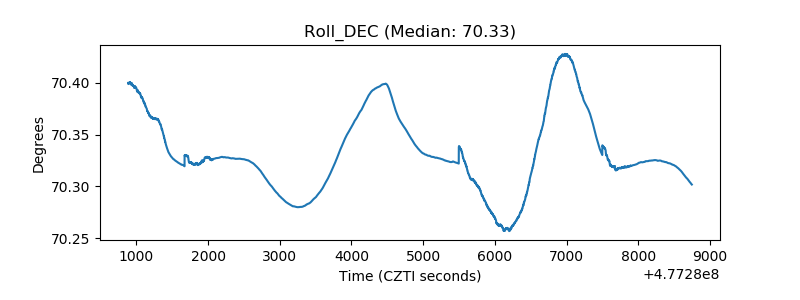 |
| _Roll_RA | 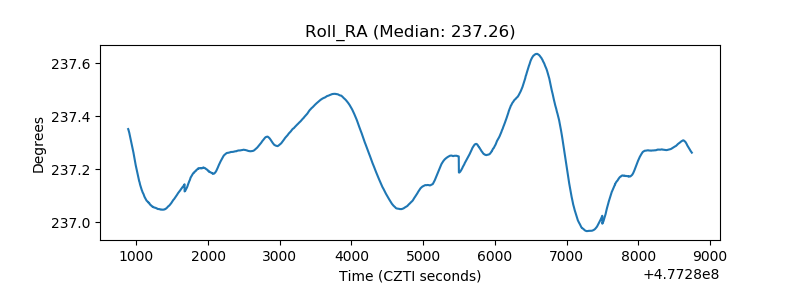 |
| Veto Counter | 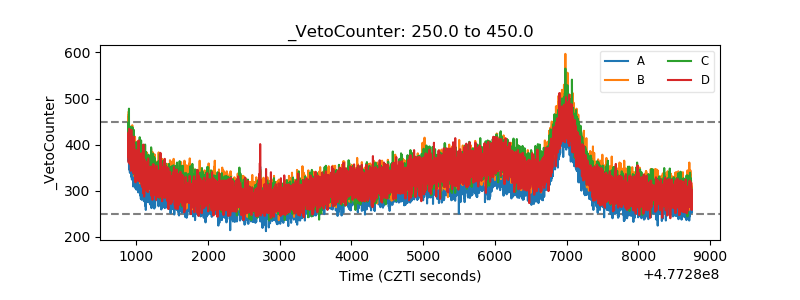 |