| Param | Original file | Final file |
|---|---|---|
| Filename | modeM0/AS1C07_001T01_9000006450_50764cztM0_level2.fits | modeM0/AS1C07_001T01_9000006450_50764cztM0_level2_quad_clean.evt |
| Size (bytes) | 633,464,640 | 96,690,240 |
| Size | 604.1 MB | 92.2 MB |
| Events in quadrant A | 6,140,752 | 648,364 |
| Events in quadrant B | 5,745,015 | 658,629 |
| Events in quadrant C | 4,996,170 | 590,439 |
| Events in quadrant D | 6,050,731 | 564,251 |
| Mode SS | |||
|---|---|---|---|
| Quadrant | BADHDUFLAG | Total packets | Discarded packets |
| A | 0 | 138 | 0 |
| B | 0 | 138 | 0 |
| C | 0 | 138 | 0 |
| D | 0 | 138 | 0 |
| Mode M0 | |||
|---|---|---|---|
| Quadrant | BADHDUFLAG | Total packets | Discarded packets |
| A | 0 | 22886 | 1 |
| B | 0 | 21656 | 1 |
| C | 0 | 19222 | 1 |
| D | 0 | 22567 | 1 |
| Mode M9 | |||
|---|---|---|---|
| Quadrant | BADHDUFLAG | Total packets | Discarded packets |
| A | 0 | 7 | 0 |
| B | 0 | 7 | 0 |
| C | 0 | 7 | 0 |
| D | 0 | 7 | 0 |
| Quadrant | Total seconds | Saturated seconds | Saturation percentage |
|---|---|---|---|
| A | 6673 | 376 | 5.634647% |
| B | 6673 | 627 | 9.396074% |
| C | 6673 | 443 | 6.638693% |
| D | 6674 | 562 | 8.420737% |
Noise dominated data is calculated using 1-second bins in cleaned event files. If a bin has >2000 counts, and if more than 50% of those come from <1% of pixels, then it is considered to be noise-dominated and hence unusable.
| Quadrant | # 1 sec bins | Bins with >0 counts | Bins with >2000 counts | High rate bins dominated by noise | Noise dominated (total time) | Noise dominated (detector-on time) | Marked lightcurve |
|---|---|---|---|---|---|---|---|
| A | 7463 | 6674 | 204 | 204 | 2.73% | 3.06% | 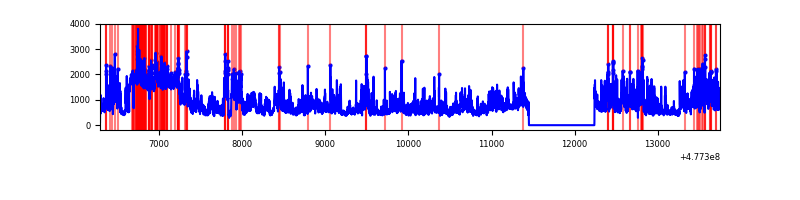 |
| B | 7463 | 6674 | 361 | 361 | 4.84% | 5.41% | 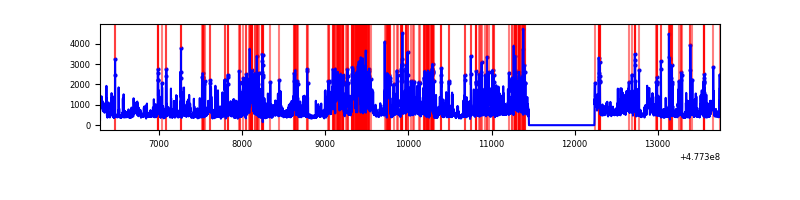 |
| C | 7463 | 6674 | 325 | 325 | 4.35% | 4.87% | 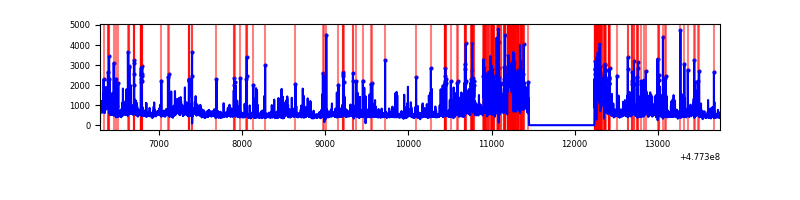 |
| D | 7464 | 6675 | 425 | 425 | 5.69% | 6.37% | 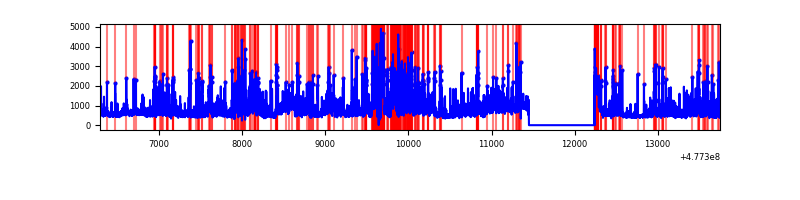 |
Top three noisy pixels from each quadrant. If the there are fewer than three noisy pixels in the level2.evt file, extra rows are filled as -1
| Pixel properties | Quadrant properties | ||||||
|---|---|---|---|---|---|---|---|
| Quadrant | DetID | PixID | Counts | Sigma | Mean | Median | Sigma |
| A | 4 | 4 | 1287199 | 7127.48 | 717 | 699 | 180.5 |
| A | 12 | 80 | 1011880 | 5602.15 | 717 | 699 | 180.5 |
| A | 6 | 195 | 206044 | 1137.65 | 717 | 699 | 180.5 |
| B | 4 | 206 | 2141299 | 14390.9 | 690 | 665 | 148.7 |
| B | 7 | 0 | 363470 | 2439.04 | 690 | 665 | 148.7 |
| B | 10 | 247 | 151327 | 1012.86 | 690 | 665 | 148.7 |
| C | 12 | 250 | 605600 | 3197.63 | 679 | 672 | 189.2 |
| C | 9 | 38 | 580031 | 3062.48 | 679 | 672 | 189.2 |
| C | 5 | 10 | 260402 | 1372.93 | 679 | 672 | 189.2 |
| D | 2 | 216 | 958259 | 4964.59 | 681 | 656 | 192.9 |
| D | 7 | 126 | 476584 | 2467.4 | 681 | 656 | 192.9 |
| D | 15 | 174 | 328106 | 1697.63 | 681 | 656 | 192.9 |
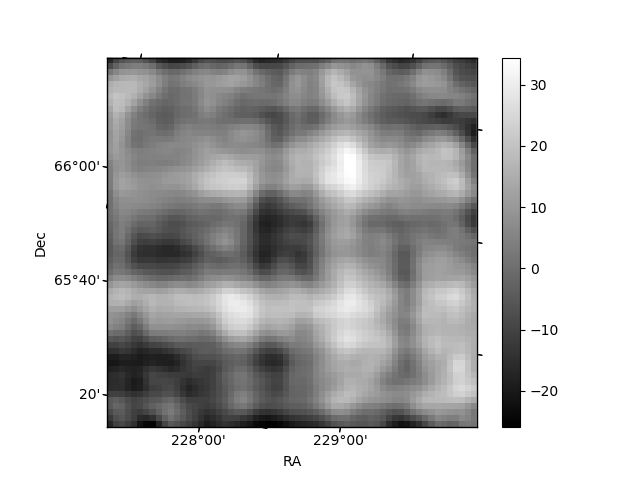
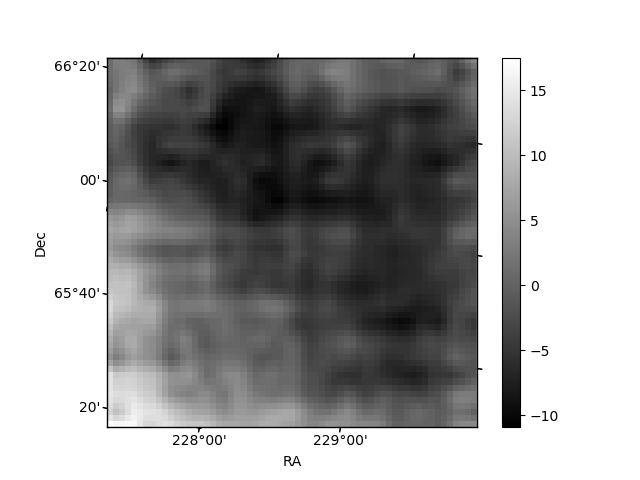
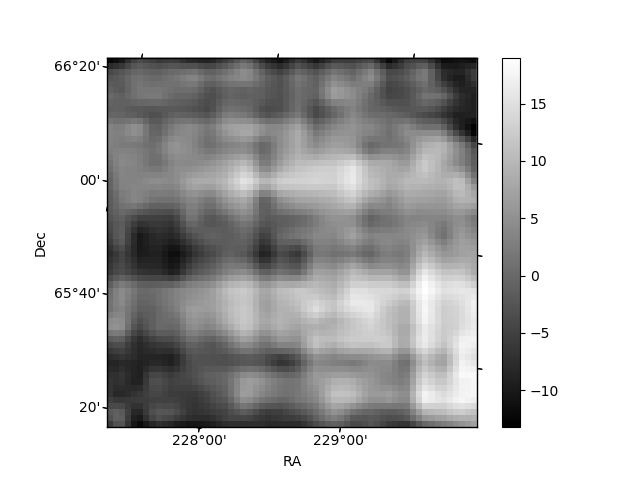
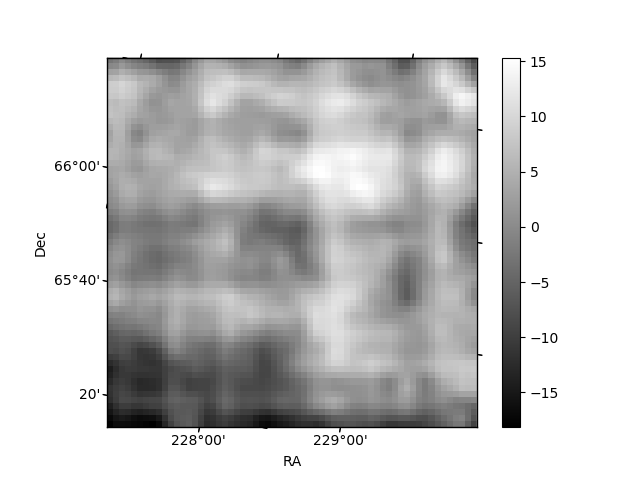
Histogram calculated using DETX and DETY for each event in the final _common_clean file
| Quadrant A | 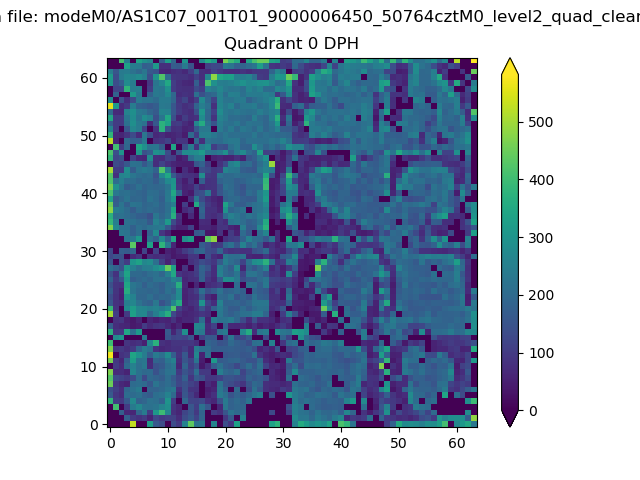 |
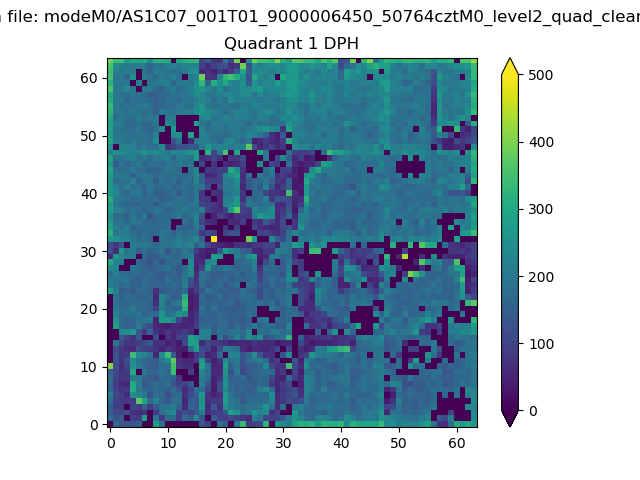 |
Quadrant B |
|---|---|---|---|
| Quadrant D | 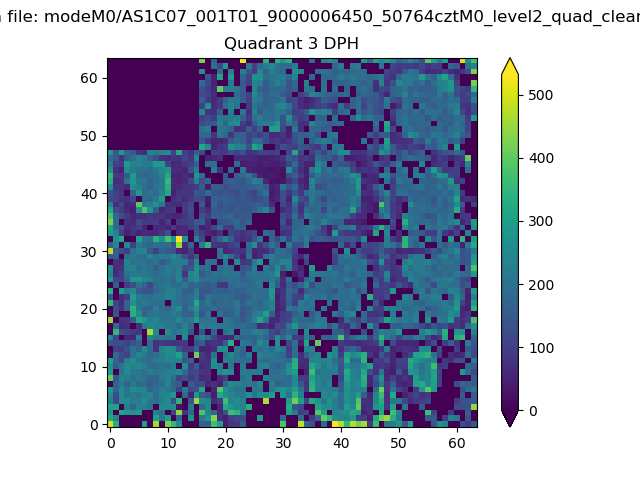 |
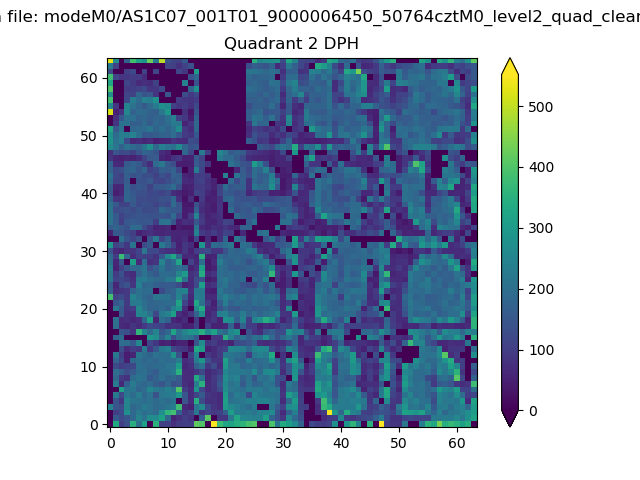 |
Quadrant C |
| Plot type | Count rate plots | Images |
|---|---|---|
| Comparison with Poisson distribution Blue bars denote a histogram of data divided into 1 sec bins. Red curve is a Poisson curve with rate = median count rate of data. |
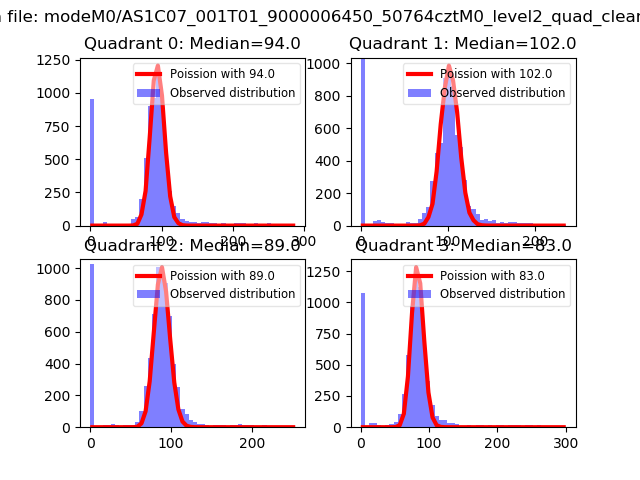 |
 |
| Quadrant-wise count rates Data is divided into 100 sec bins |
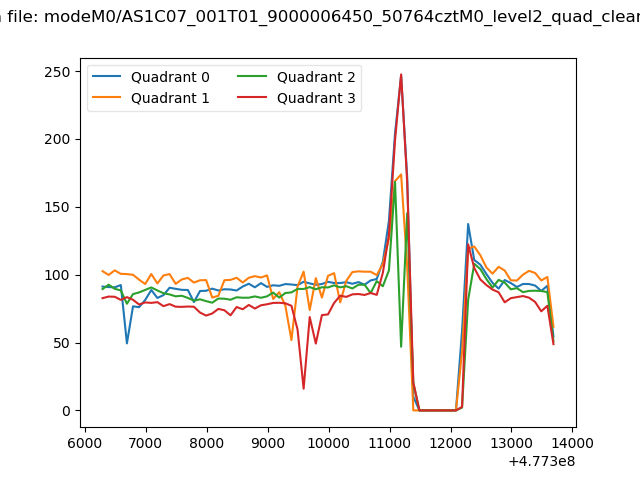 |
|
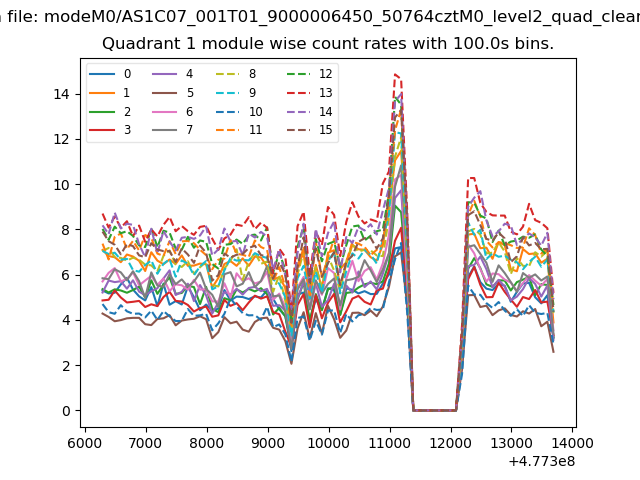
| Module-wise count rates for Quadrant A Data is divided into 100 sec bins |
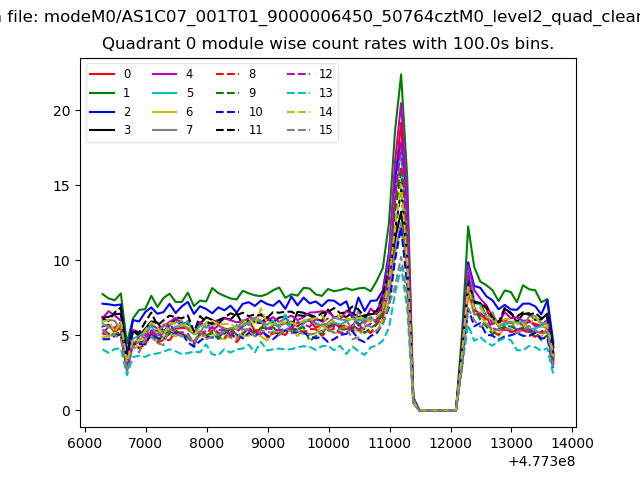 |
 |
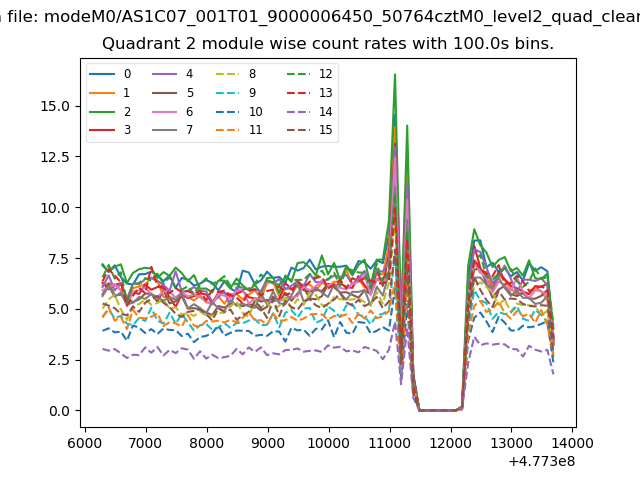
| Module-wise count rates for Quadrant B Data is divided into 100 sec bins |
 |
 |
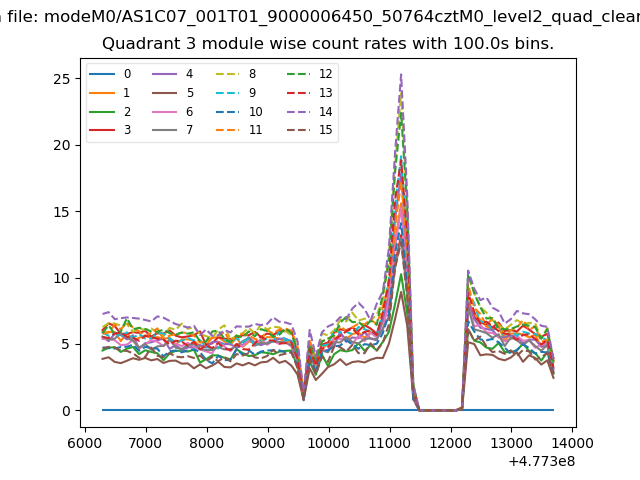
| Module-wise count rates for Quadrant C Data is divided into 100 sec bins |
 |
 |
| Module-wise count rates for Quadrant D Data is divided into 100 sec bins |
 |
 |
| Parameter | Plot |
|---|---|
| CZT HV Monitor |  |
| D_VDD | 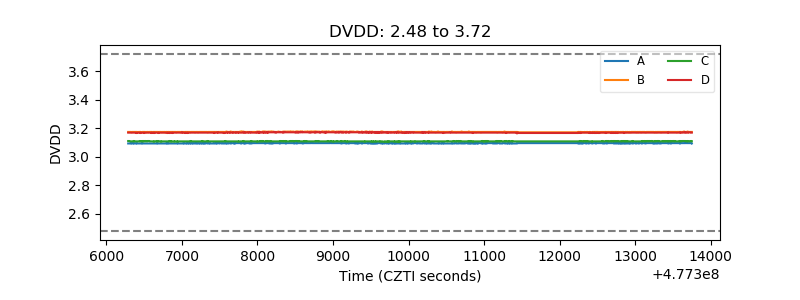 |
| Temperature 1 | 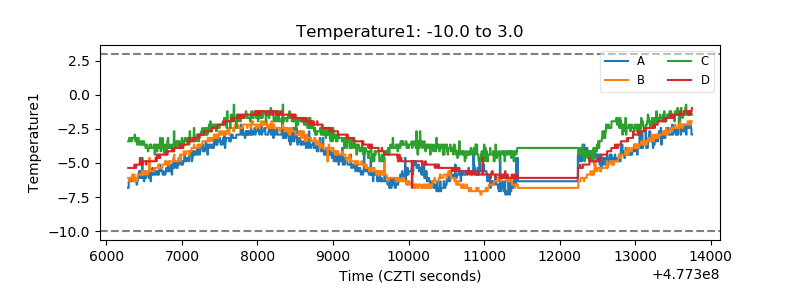 |
| Veto HV Monitor | 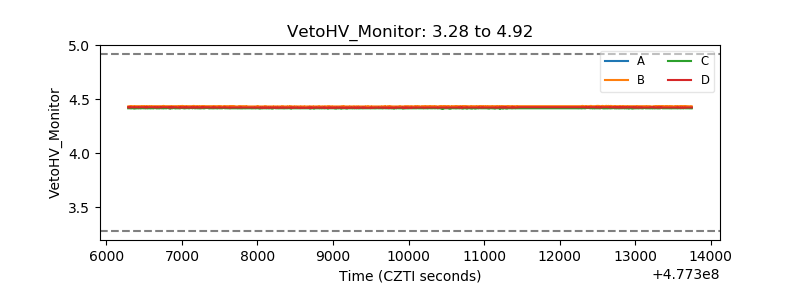 |
| Veto LLD | 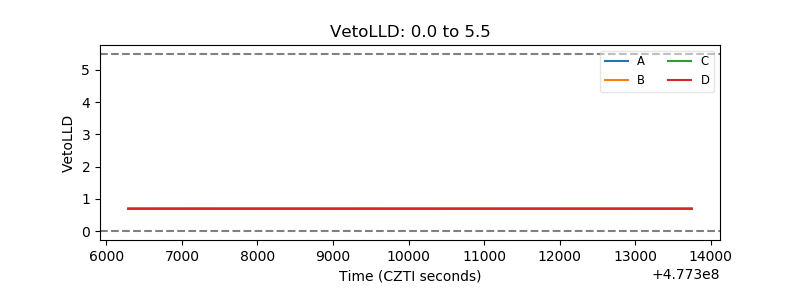 |
| Alpha Counter | 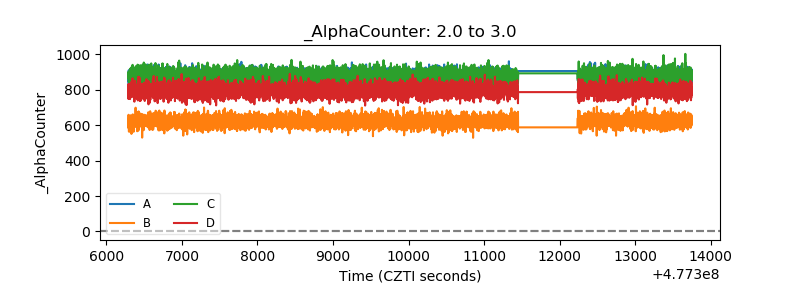 |
| _CPM_Rate | 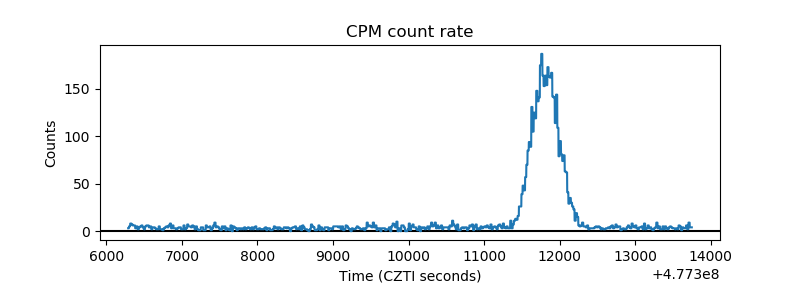 |
| CZT Counter | 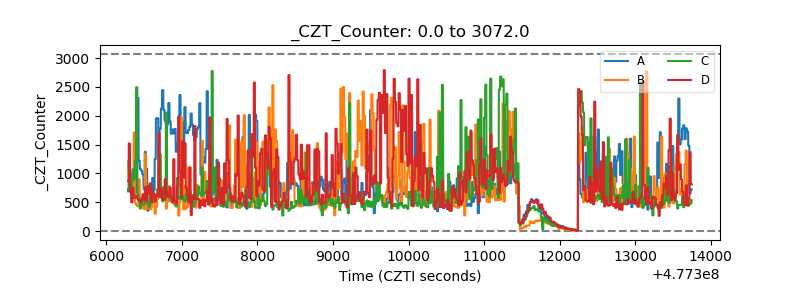 |
| +2.5 Volts monitor | 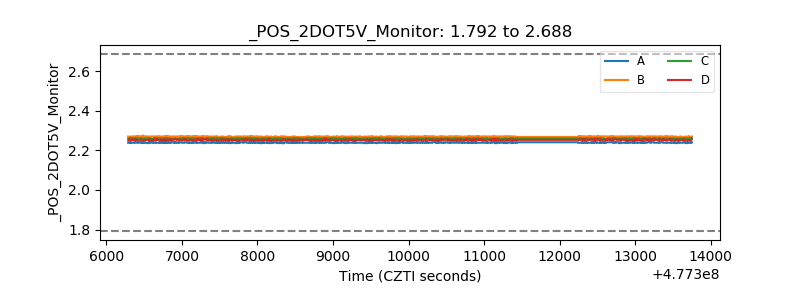 |
| +5 Volts monitor | 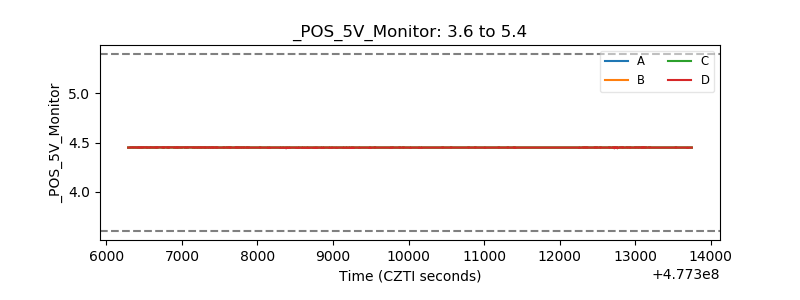 |
| _ROLL_ROT | 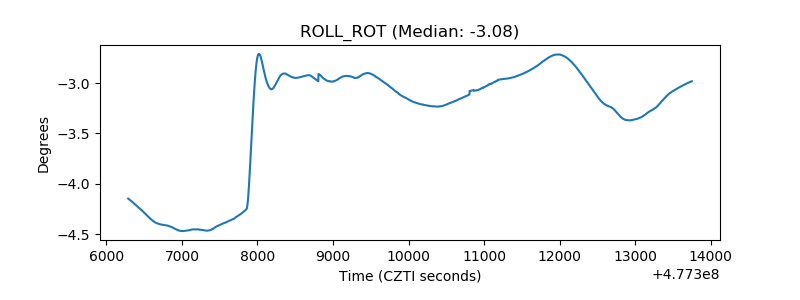 |
| _Roll_DEC | 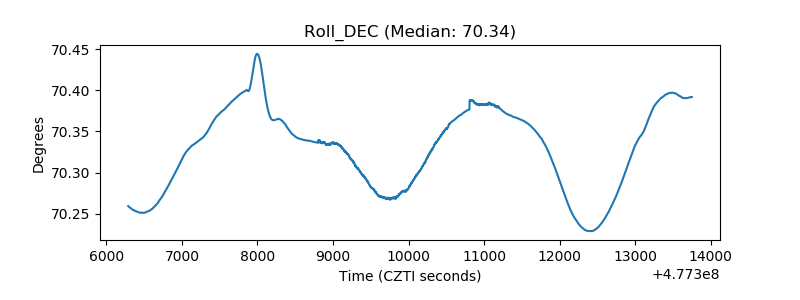 |
| _Roll_RA | 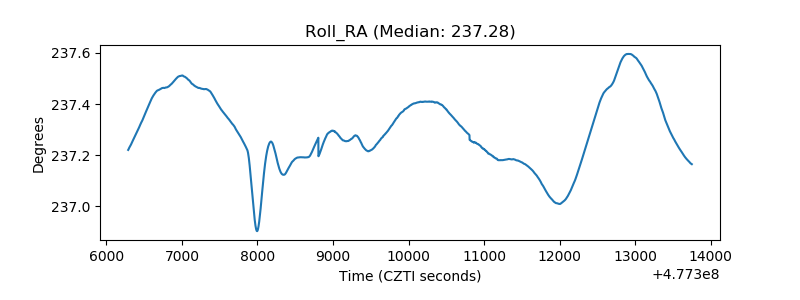 |
| Veto Counter | 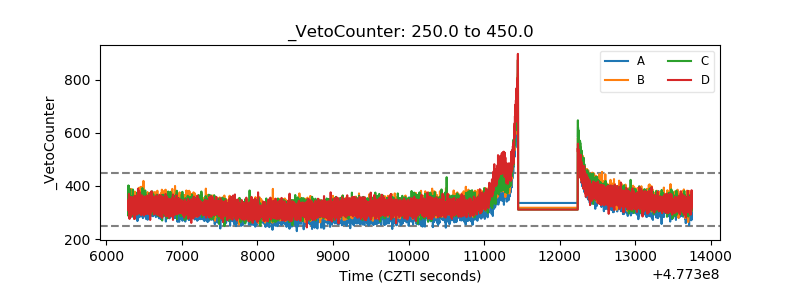 |