| Param | Original file | Final file |
|---|---|---|
| Filename | modeM0/AS1C07_001T01_9000006450_50766cztM0_level2.fits | modeM0/AS1C07_001T01_9000006450_50766cztM0_level2_quad_clean.evt |
| Size (bytes) | 592,666,560 | 88,208,640 |
| Size | 565.2 MB | 84.1 MB |
| Events in quadrant A | 5,453,052 | 579,931 |
| Events in quadrant B | 5,948,325 | 589,273 |
| Events in quadrant C | 4,984,402 | 547,065 |
| Events in quadrant D | 5,061,438 | 511,162 |
| Mode SS | |||
|---|---|---|---|
| Quadrant | BADHDUFLAG | Total packets | Discarded packets |
| A | 0 | 130 | 0 |
| B | 0 | 130 | 0 |
| C | 0 | 130 | 0 |
| D | 0 | 130 | 0 |
| Mode M0 | |||
|---|---|---|---|
| Quadrant | BADHDUFLAG | Total packets | Discarded packets |
| A | 0 | 20558 | 1 |
| B | 0 | 22022 | 1 |
| C | 0 | 19130 | 1 |
| D | 0 | 19385 | 1 |
| Mode M9 | |||
|---|---|---|---|
| Quadrant | BADHDUFLAG | Total packets | Discarded packets |
| A | 0 | 9 | 0 |
| B | 0 | 9 | 0 |
| C | 0 | 9 | 0 |
| D | 0 | 9 | 0 |
| Quadrant | Total seconds | Saturated seconds | Saturation percentage |
|---|---|---|---|
| A | 6345 | 310 | 4.885737% |
| B | 6345 | 862 | 13.585500% |
| C | 6346 | 425 | 6.697132% |
| D | 6346 | 368 | 5.798928% |
Noise dominated data is calculated using 1-second bins in cleaned event files. If a bin has >2000 counts, and if more than 50% of those come from <1% of pixels, then it is considered to be noise-dominated and hence unusable.
| Quadrant | # 1 sec bins | Bins with >0 counts | Bins with >2000 counts | High rate bins dominated by noise | Noise dominated (total time) | Noise dominated (detector-on time) | Marked lightcurve |
|---|---|---|---|---|---|---|---|
| A | 7275 | 6347 | 202 | 202 | 2.78% | 3.18% | 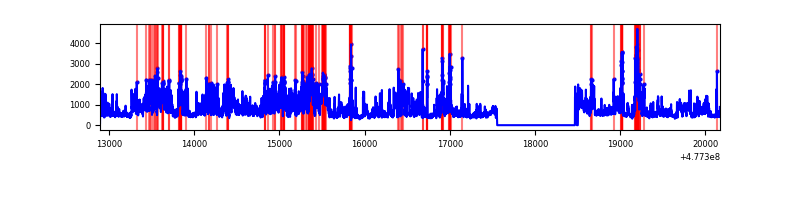 |
| B | 7275 | 6347 | 538 | 538 | 7.40% | 8.48% | 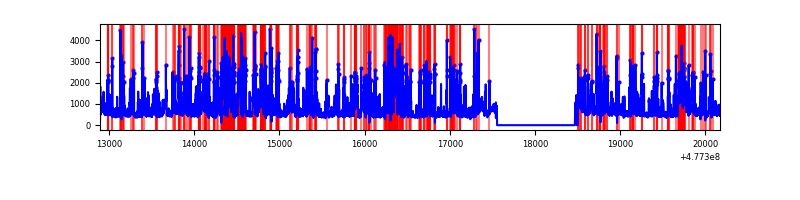 |
| C | 7276 | 6348 | 304 | 304 | 4.18% | 4.79% | 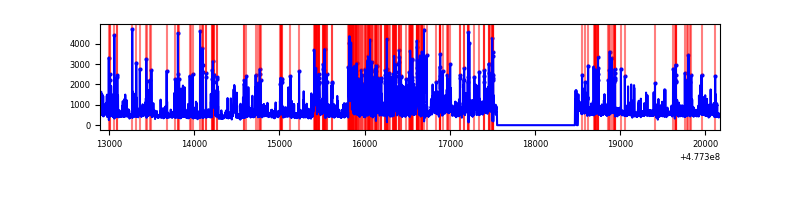 |
| D | 7276 | 6348 | 277 | 277 | 3.81% | 4.36% | 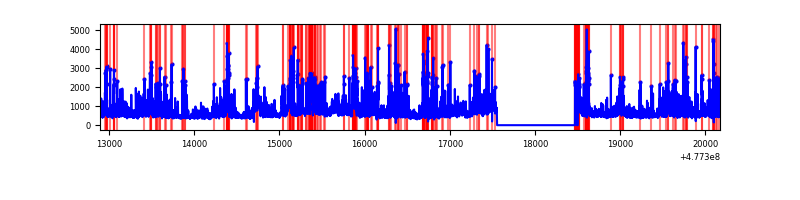 |
Top three noisy pixels from each quadrant. If the there are fewer than three noisy pixels in the level2.evt file, extra rows are filled as -1
| Pixel properties | Quadrant properties | ||||||
|---|---|---|---|---|---|---|---|
| Quadrant | DetID | PixID | Counts | Sigma | Mean | Median | Sigma |
| A | 4 | 4 | 1517070 | 9012.78 | 668 | 650 | 168.3 |
| A | 6 | 195 | 525847 | 3121.49 | 668 | 650 | 168.3 |
| A | 11 | 3 | 190585 | 1128.87 | 668 | 650 | 168.3 |
| B | 4 | 206 | 2901144 | 21068.42 | 640 | 618 | 137.7 |
| B | 7 | 0 | 83034 | 598.64 | 640 | 618 | 137.7 |
| B | 10 | 247 | 58504 | 420.46 | 640 | 618 | 137.7 |
| C | 1 | 44 | 655352 | 3690.77 | 641 | 632 | 177.4 |
| C | 9 | 38 | 463585 | 2609.74 | 641 | 632 | 177.4 |
| C | 5 | 10 | 437621 | 2463.38 | 641 | 632 | 177.4 |
| D | 2 | 216 | 621439 | 3484.63 | 636 | 616 | 178.2 |
| D | 15 | 174 | 228040 | 1276.51 | 636 | 616 | 178.2 |
| D | 2 | 249 | 224797 | 1258.31 | 636 | 616 | 178.2 |
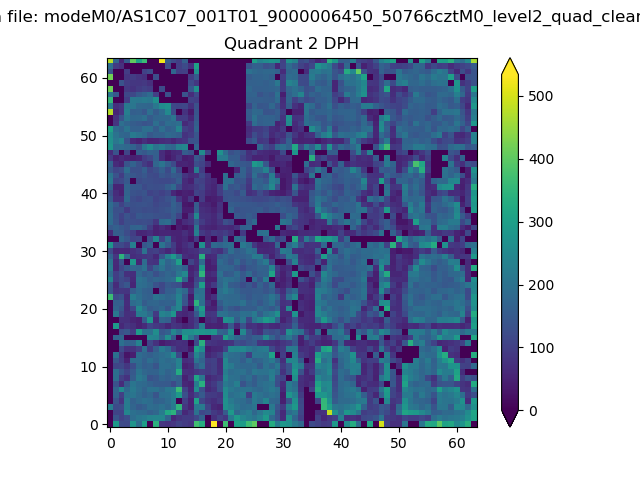
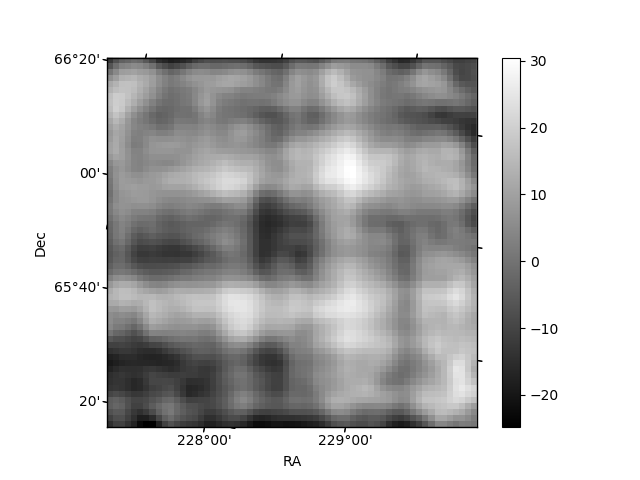
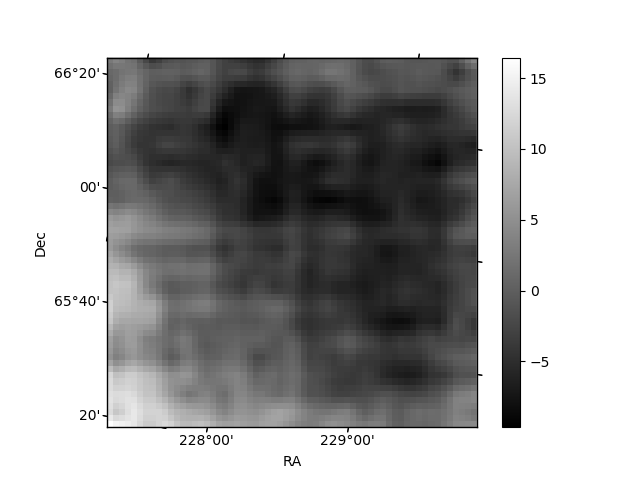
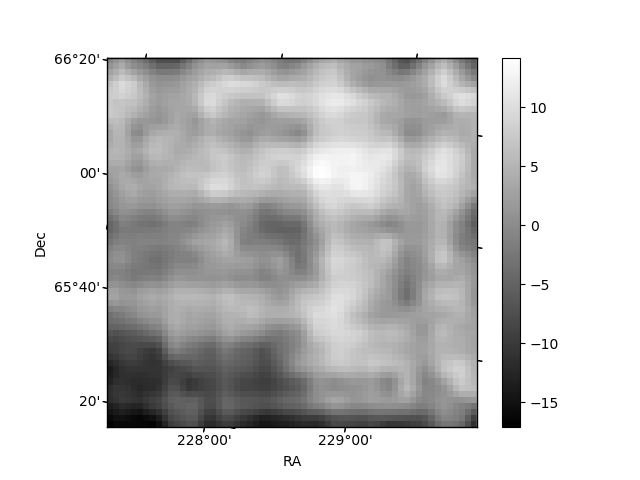
Histogram calculated using DETX and DETY for each event in the final _common_clean file
| Quadrant A | 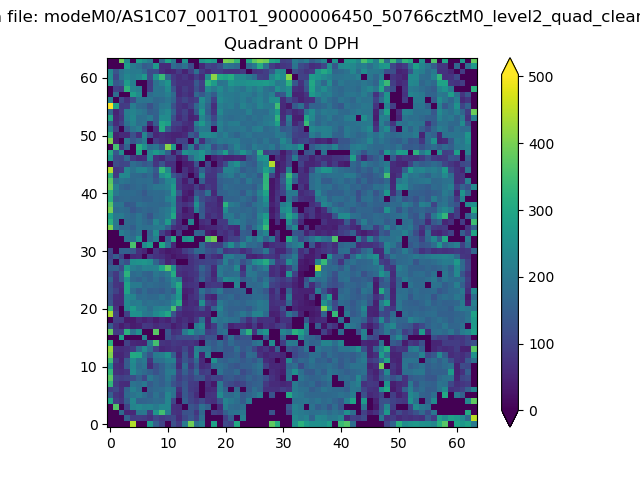 |
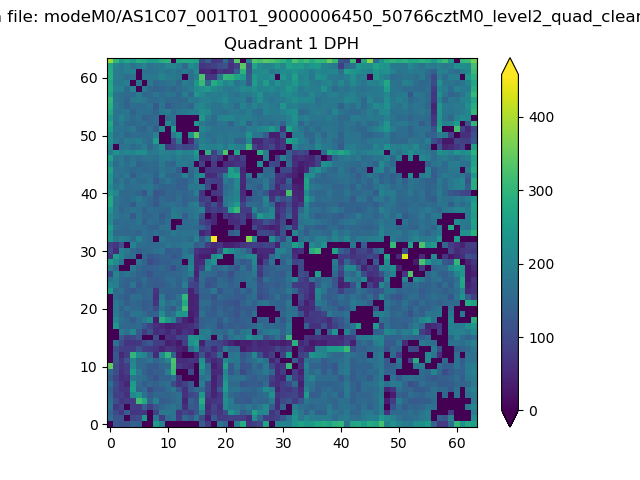 |
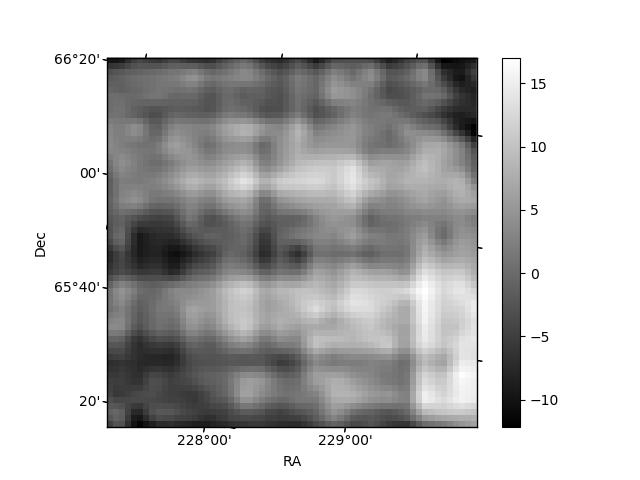
Quadrant B |
|---|---|---|---|
| Quadrant D | 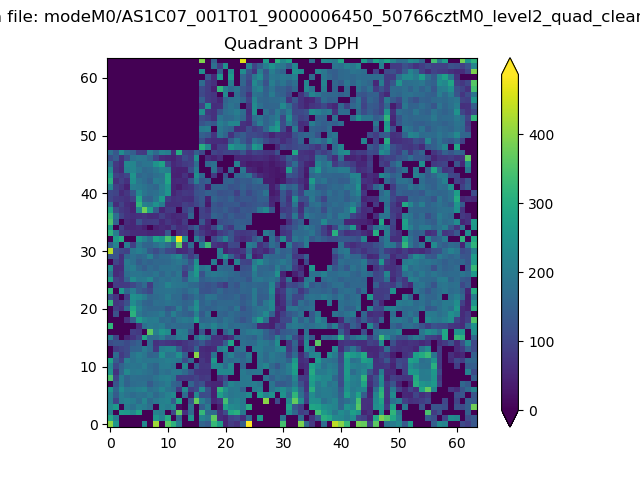 |
 |
Quadrant C |
| Plot type | Count rate plots | Images |
|---|---|---|
| Comparison with Poisson distribution Blue bars denote a histogram of data divided into 1 sec bins. Red curve is a Poisson curve with rate = median count rate of data. |
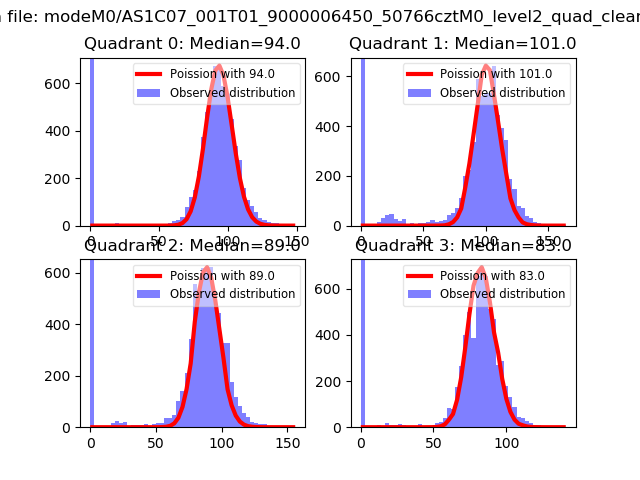 |
 |
| Quadrant-wise count rates Data is divided into 100 sec bins |
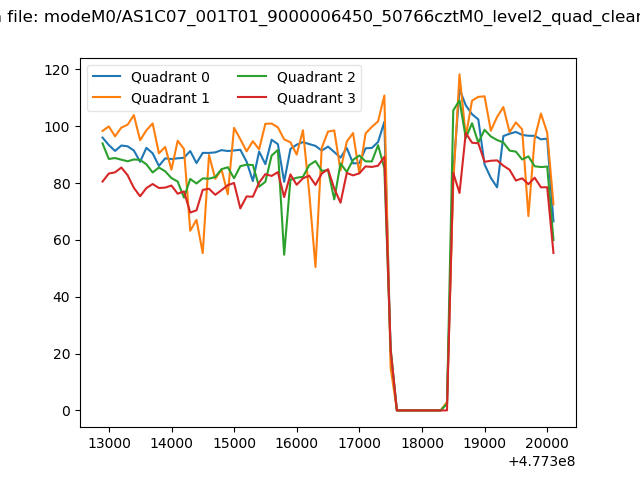 |
|
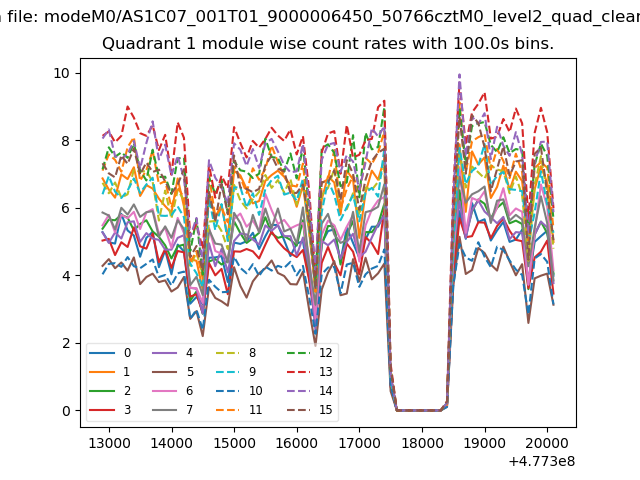
| Module-wise count rates for Quadrant A Data is divided into 100 sec bins |
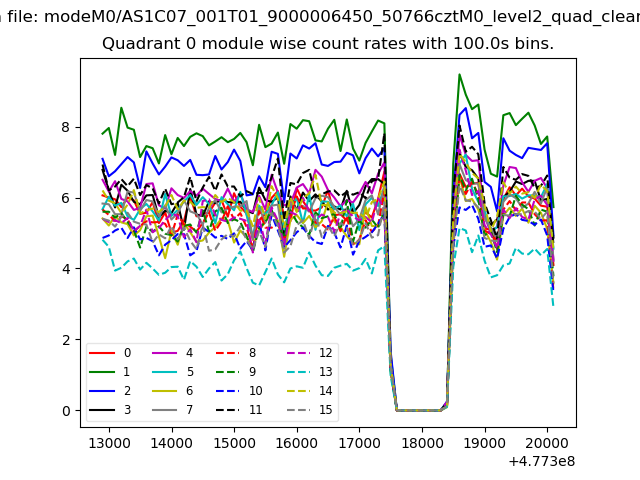 |
 |
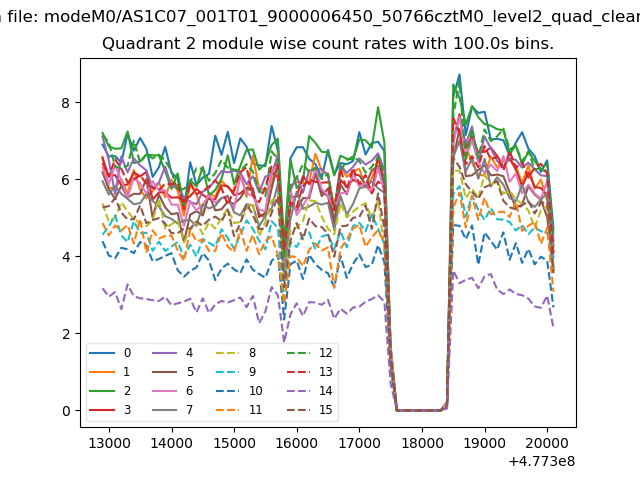
| Module-wise count rates for Quadrant B Data is divided into 100 sec bins |
 |
 |
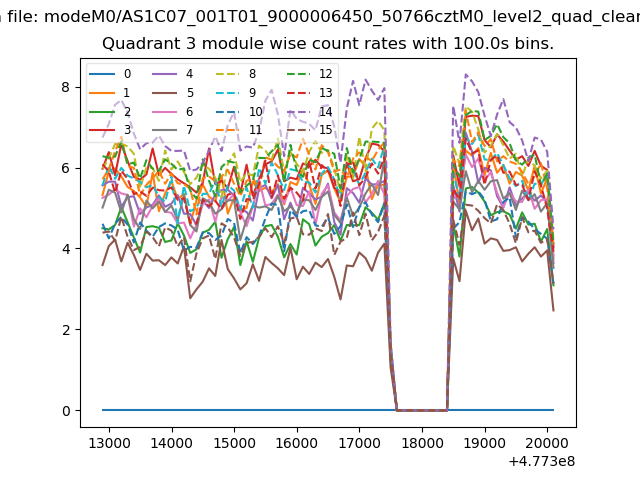
| Module-wise count rates for Quadrant C Data is divided into 100 sec bins |
 |
 |
| Module-wise count rates for Quadrant D Data is divided into 100 sec bins |
 |
 |
| Parameter | Plot |
|---|---|
| CZT HV Monitor | 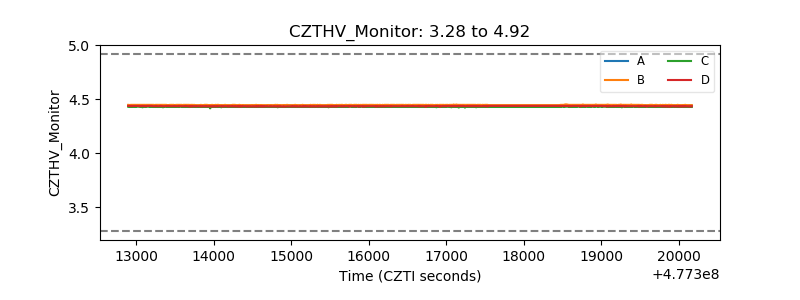 |
| D_VDD | 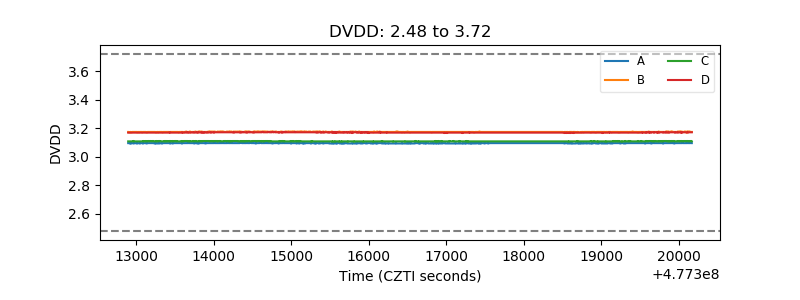 |
| Temperature 1 | 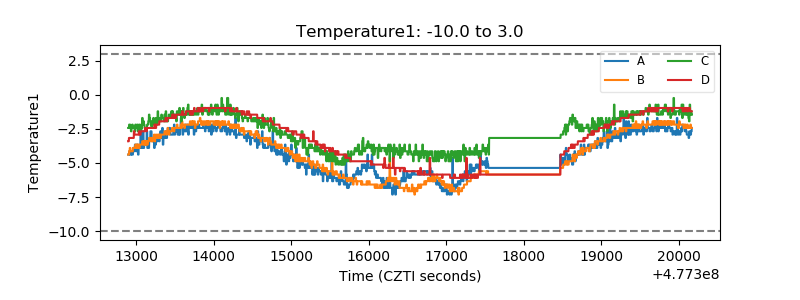 |
| Veto HV Monitor | 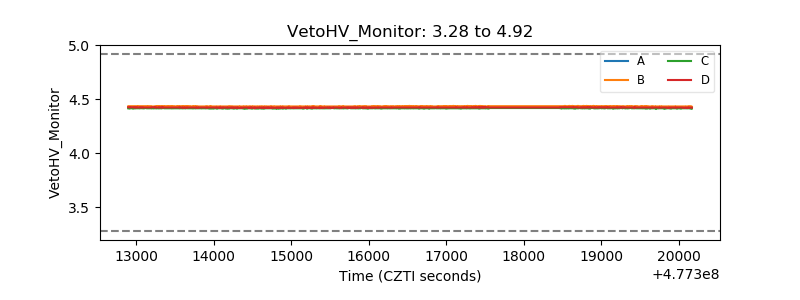 |
| Veto LLD | 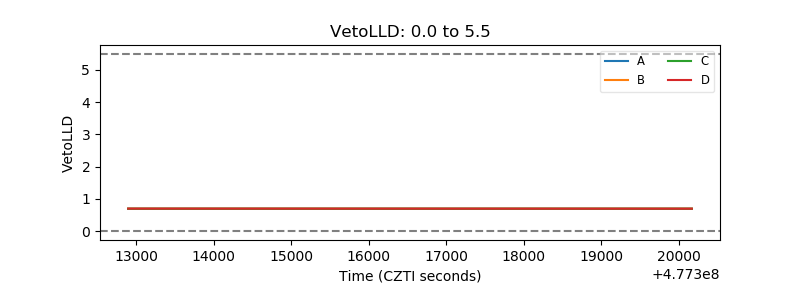 |
| Alpha Counter | 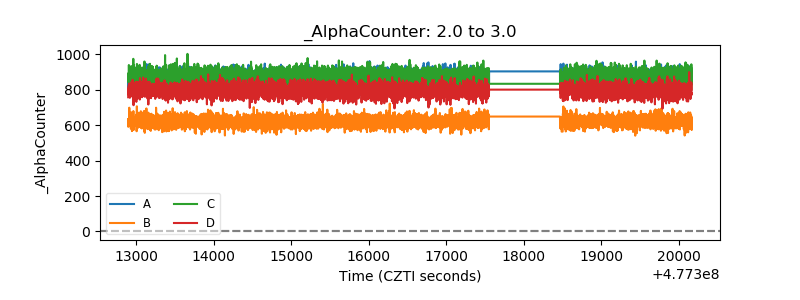 |
| _CPM_Rate | 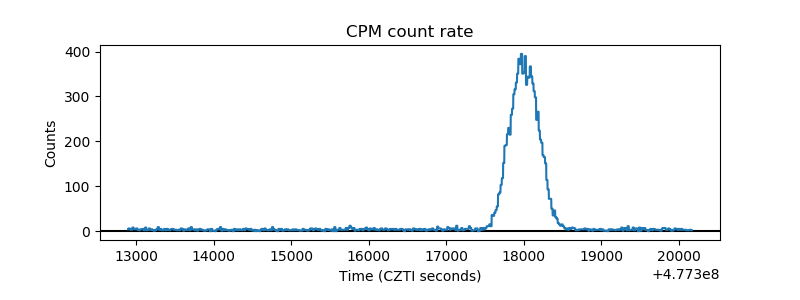 |
| CZT Counter | 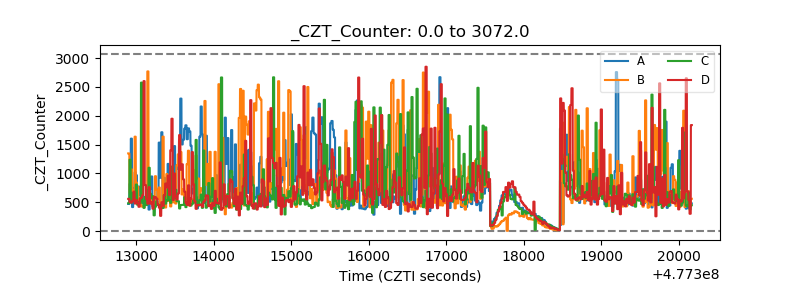 |
| +2.5 Volts monitor | 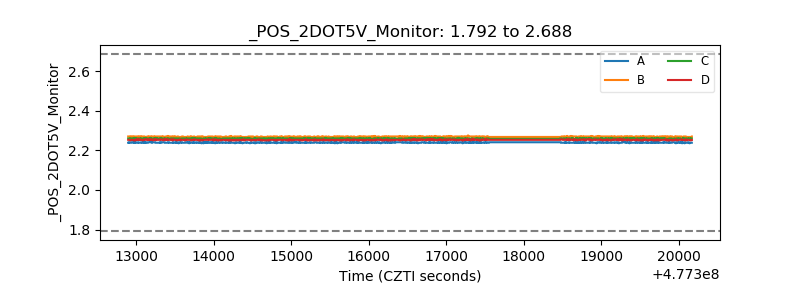 |
| +5 Volts monitor |  |
| _ROLL_ROT | 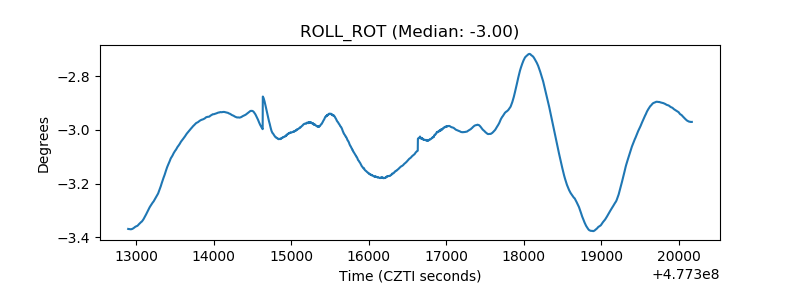 |
| _Roll_DEC | 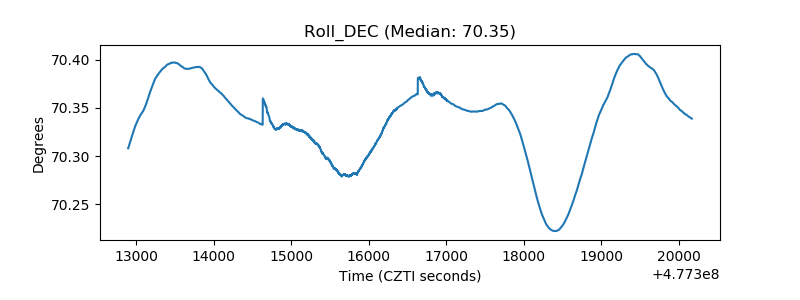 |
| _Roll_RA | 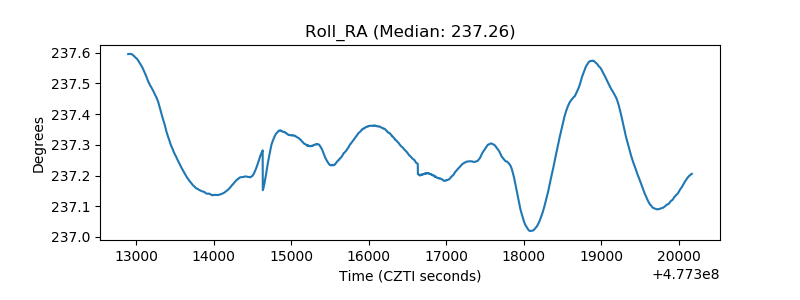 |
| Veto Counter | 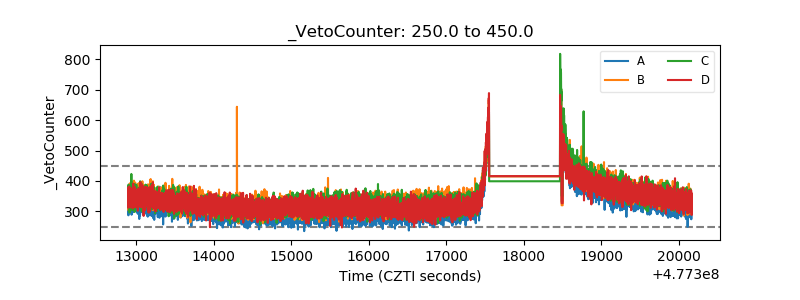 |