| Param | Original file | Final file |
|---|---|---|
| Filename | modeM0/AS1C07_001T01_9000006450_50767cztM0_level2.fits | modeM0/AS1C07_001T01_9000006450_50767cztM0_level2_quad_clean.evt |
| Size (bytes) | 586,765,440 | 92,191,680 |
| Size | 559.6 MB | 87.9 MB |
| Events in quadrant A | 5,651,573 | 605,266 |
| Events in quadrant B | 5,257,963 | 643,736 |
| Events in quadrant C | 4,802,021 | 572,822 |
| Events in quadrant D | 5,508,955 | 519,349 |
| Mode SS | |||
|---|---|---|---|
| Quadrant | BADHDUFLAG | Total packets | Discarded packets |
| A | 0 | 130 | 0 |
| B | 0 | 130 | 0 |
| C | 0 | 132 | 0 |
| D | 0 | 132 | 0 |
| Mode M0 | |||
|---|---|---|---|
| Quadrant | BADHDUFLAG | Total packets | Discarded packets |
| A | 0 | 21240 | 1 |
| B | 0 | 20064 | 1 |
| C | 0 | 18616 | 1 |
| D | 0 | 20740 | 1 |
| Mode M9 | |||
|---|---|---|---|
| Quadrant | BADHDUFLAG | Total packets | Discarded packets |
| A | 0 | 10 | 0 |
| B | 0 | 10 | 0 |
| C | 0 | 10 | 0 |
| D | 0 | 10 | 0 |
| Quadrant | Total seconds | Saturated seconds | Saturation percentage |
|---|---|---|---|
| A | 6451 | 337 | 5.223996% |
| B | 6451 | 561 | 8.696326% |
| C | 6452 | 379 | 5.874148% |
| D | 6452 | 570 | 8.834470% |
Noise dominated data is calculated using 1-second bins in cleaned event files. If a bin has >2000 counts, and if more than 50% of those come from <1% of pixels, then it is considered to be noise-dominated and hence unusable.
| Quadrant | # 1 sec bins | Bins with >0 counts | Bins with >2000 counts | High rate bins dominated by noise | Noise dominated (total time) | Noise dominated (detector-on time) | Marked lightcurve |
|---|---|---|---|---|---|---|---|
| A | 7487 | 6452 | 180 | 180 | 2.40% | 2.79% | 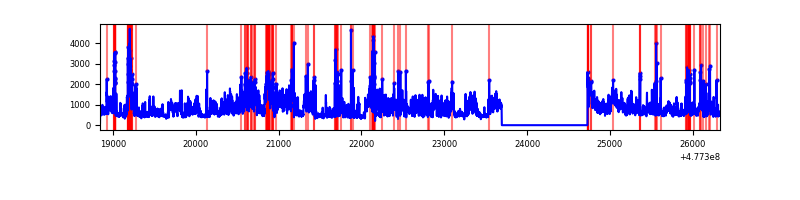 |
| B | 7487 | 6452 | 319 | 319 | 4.26% | 4.94% | 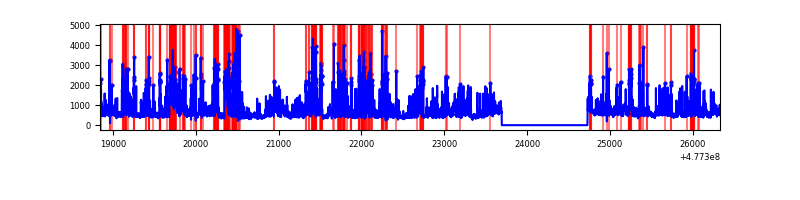 |
| C | 7488 | 6453 | 266 | 266 | 3.55% | 4.12% |  |
| D | 7487 | 6452 | 409 | 409 | 5.46% | 6.34% | 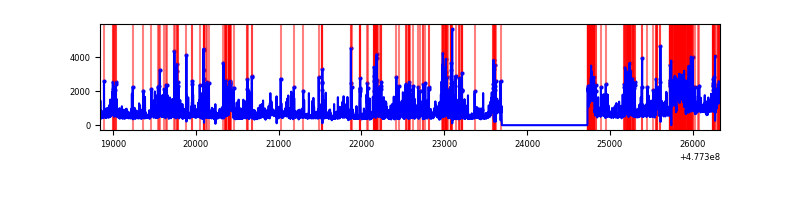 |
Top three noisy pixels from each quadrant. If the there are fewer than three noisy pixels in the level2.evt file, extra rows are filled as -1
| Pixel properties | Quadrant properties | ||||||
|---|---|---|---|---|---|---|---|
| Quadrant | DetID | PixID | Counts | Sigma | Mean | Median | Sigma |
| A | 4 | 4 | 1513978 | 8810.29 | 688 | 669 | 171.8 |
| A | 6 | 195 | 420092 | 2441.83 | 688 | 669 | 171.8 |
| A | 3 | 114 | 226028 | 1312.01 | 688 | 669 | 171.8 |
| B | 4 | 206 | 2021601 | 14156.58 | 676 | 653 | 142.8 |
| B | 10 | 247 | 99957 | 695.62 | 676 | 653 | 142.8 |
| B | 7 | 0 | 94708 | 658.85 | 676 | 653 | 142.8 |
| C | 3 | 233 | 319496 | 1750.07 | 665 | 655 | 182.2 |
| C | 0 | 145 | 268718 | 1471.36 | 665 | 655 | 182.2 |
| C | 5 | 10 | 253756 | 1389.23 | 665 | 655 | 182.2 |
| D | 2 | 216 | 587479 | 3230.44 | 654 | 633 | 181.7 |
| D | 7 | 125 | 474277 | 2607.29 | 654 | 633 | 181.7 |
| D | 2 | 249 | 260277 | 1429.27 | 654 | 633 | 181.7 |
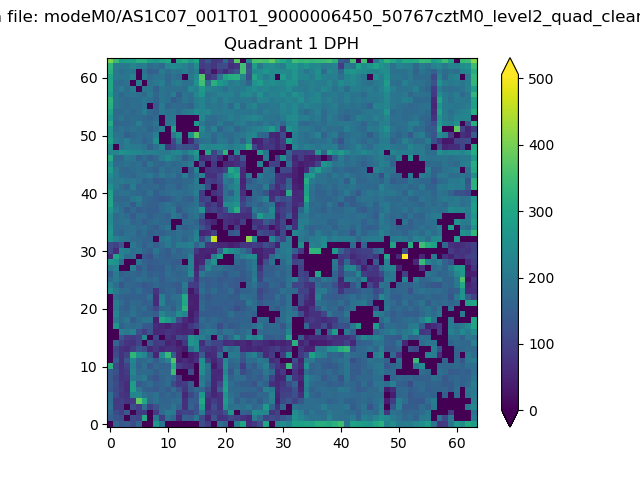
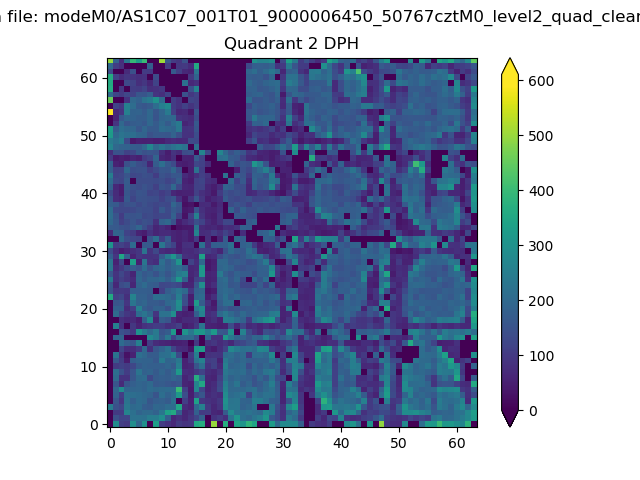
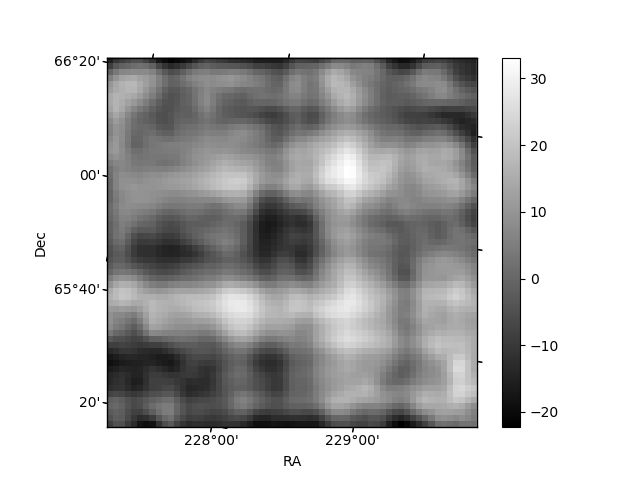
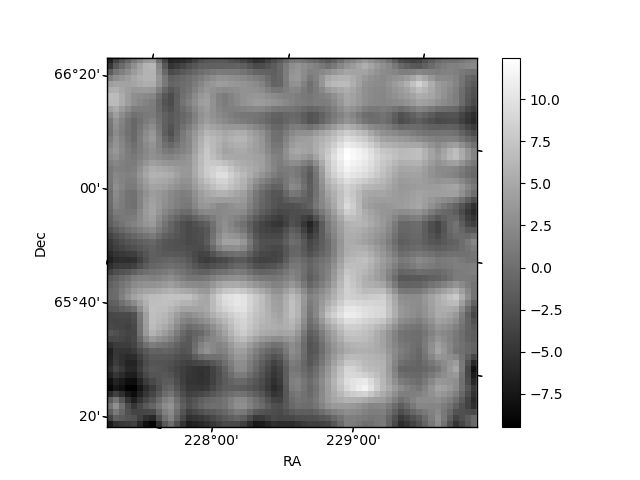
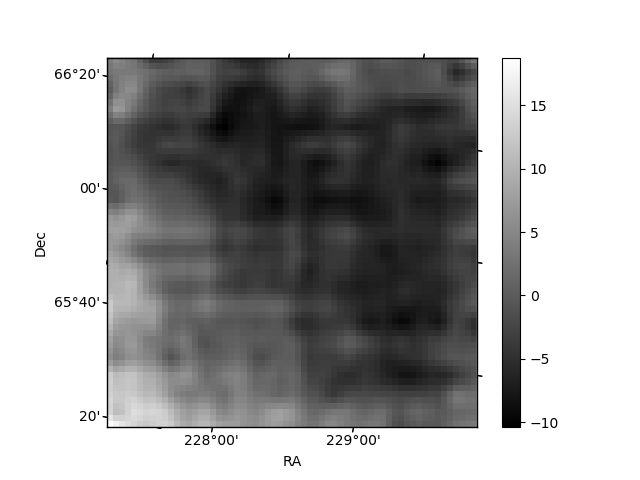
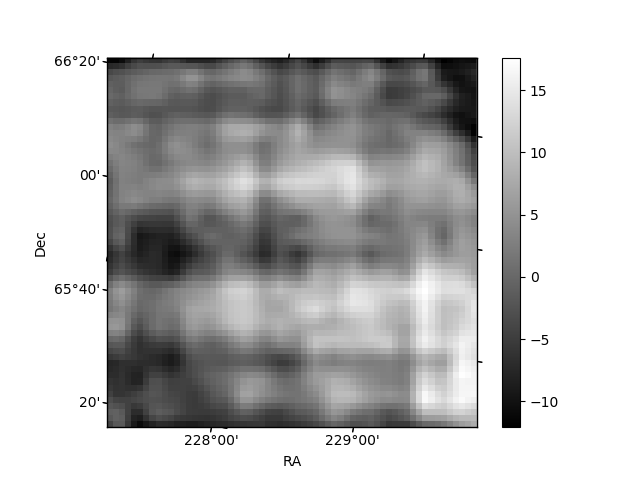
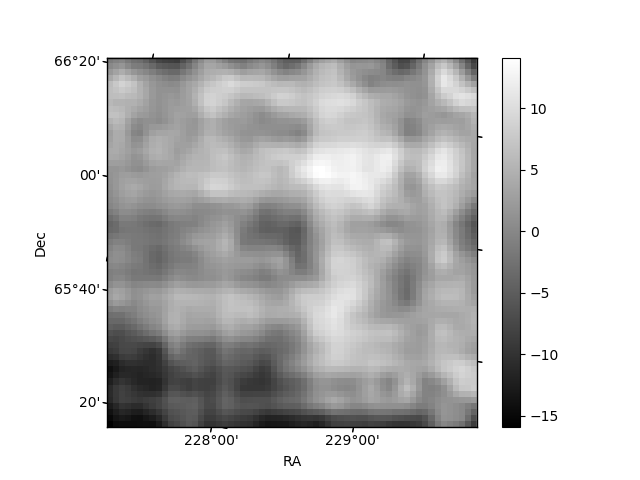
Histogram calculated using DETX and DETY for each event in the final _common_clean file
| Quadrant A | 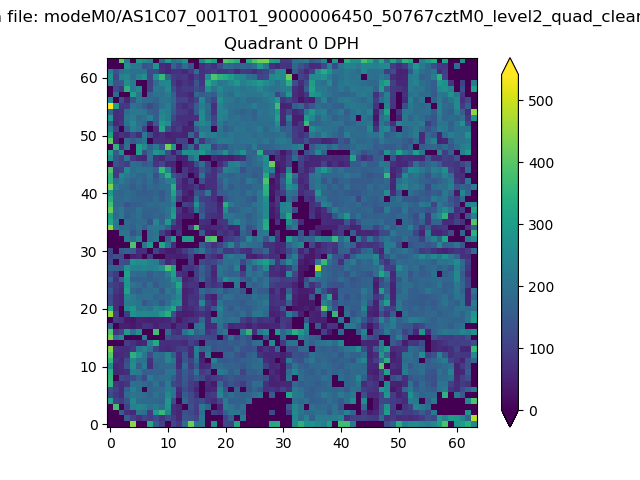 |
 |
Quadrant B |
|---|---|---|---|
| Quadrant D | 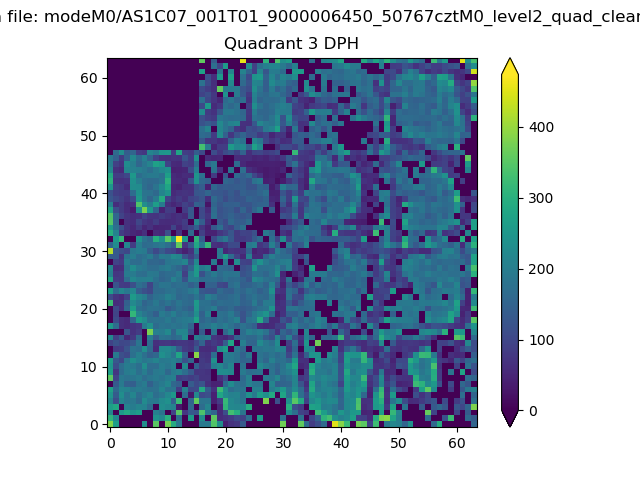 |
 |
Quadrant C |
| Plot type | Count rate plots | Images |
|---|---|---|
| Comparison with Poisson distribution Blue bars denote a histogram of data divided into 1 sec bins. Red curve is a Poisson curve with rate = median count rate of data. |
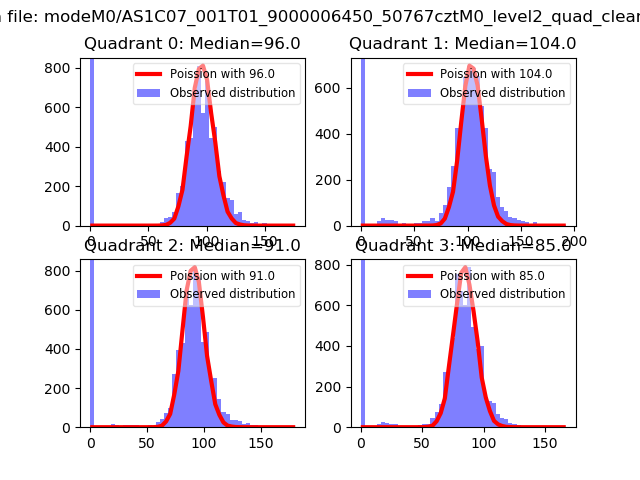 |
 |
| Quadrant-wise count rates Data is divided into 100 sec bins |
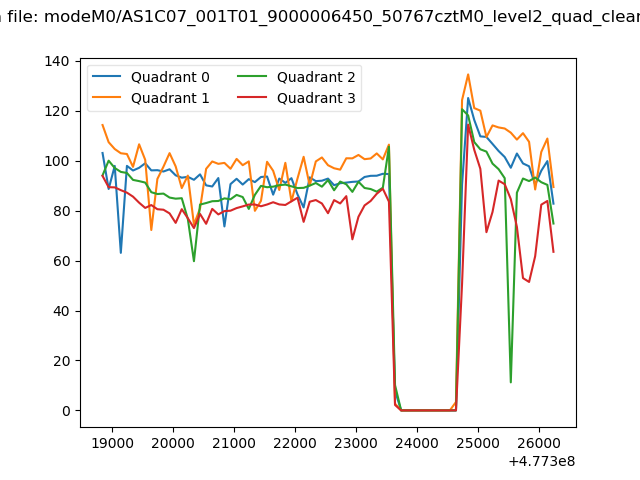 |
|
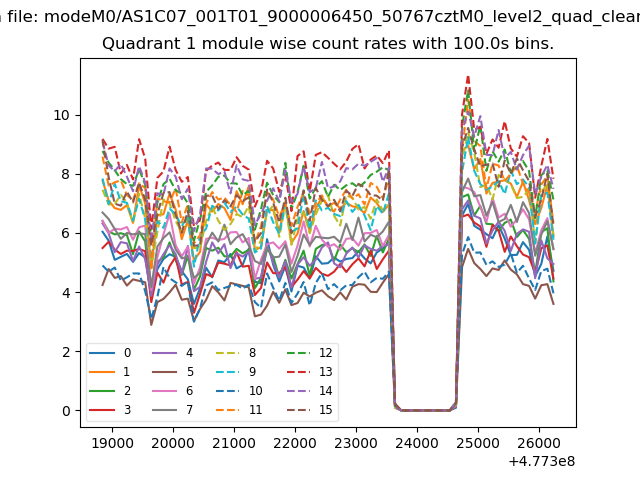
| Module-wise count rates for Quadrant A Data is divided into 100 sec bins |
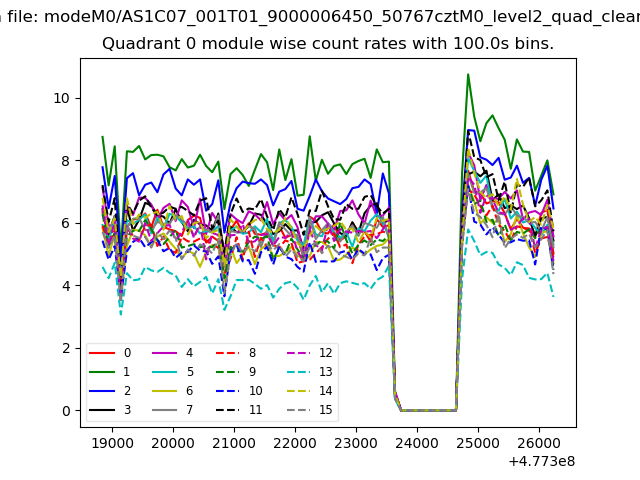 |
 |
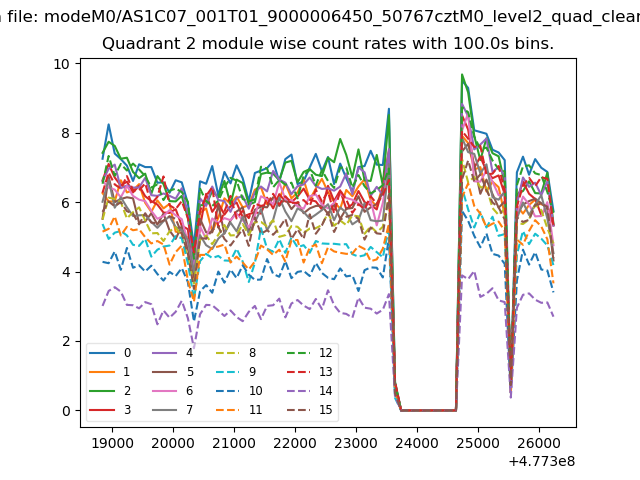
| Module-wise count rates for Quadrant B Data is divided into 100 sec bins |
 |
 |
| Module-wise count rates for Quadrant C Data is divided into 100 sec bins |
 |
 |
| Module-wise count rates for Quadrant D Data is divided into 100 sec bins |
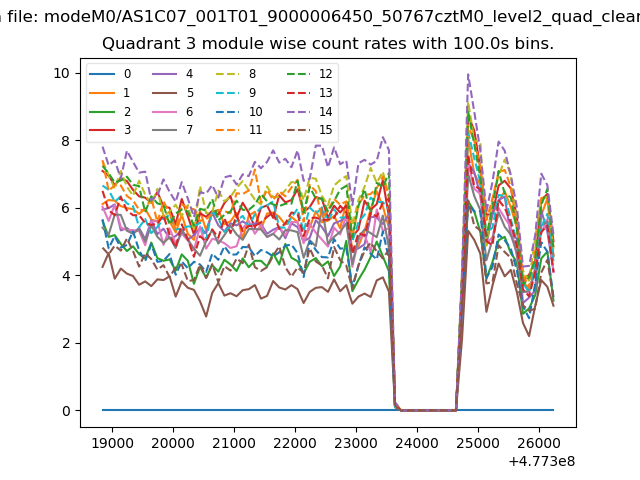 |
 |
| Parameter | Plot |
|---|---|
| CZT HV Monitor | 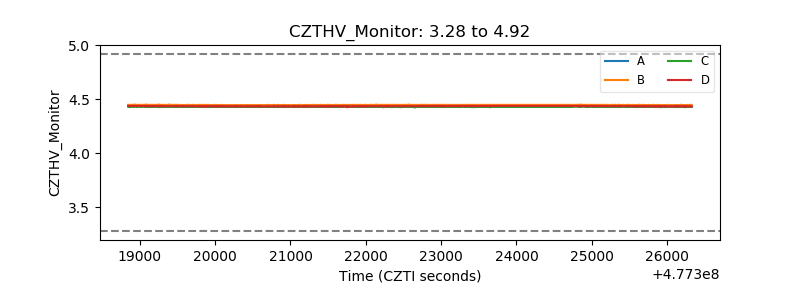 |
| D_VDD | 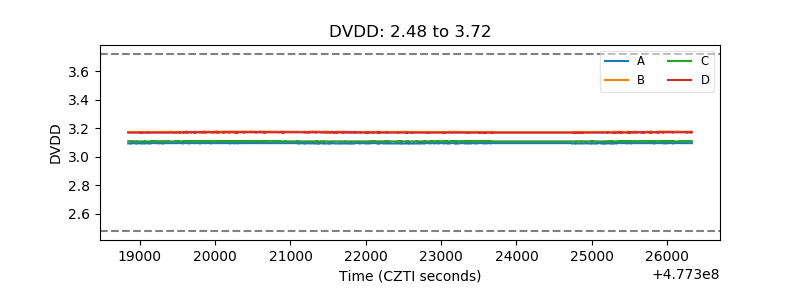 |
| Temperature 1 | 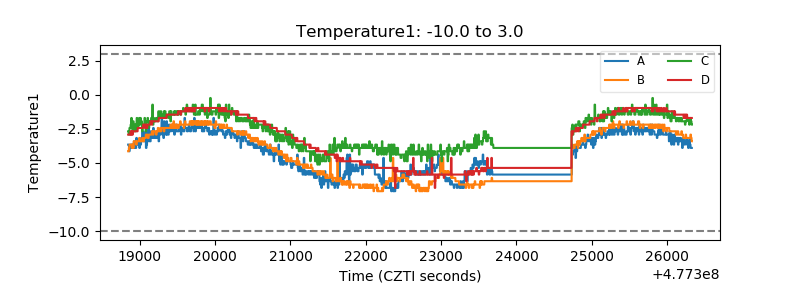 |
| Veto HV Monitor | 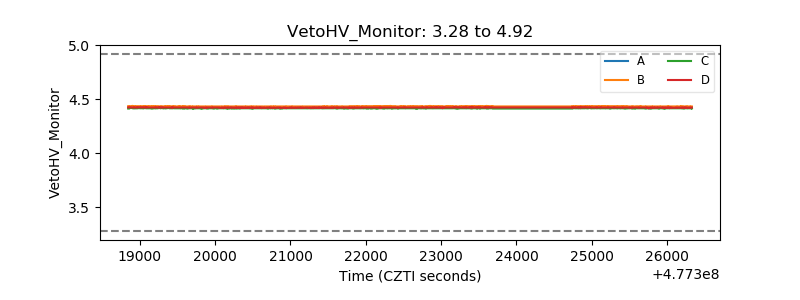 |
| Veto LLD | 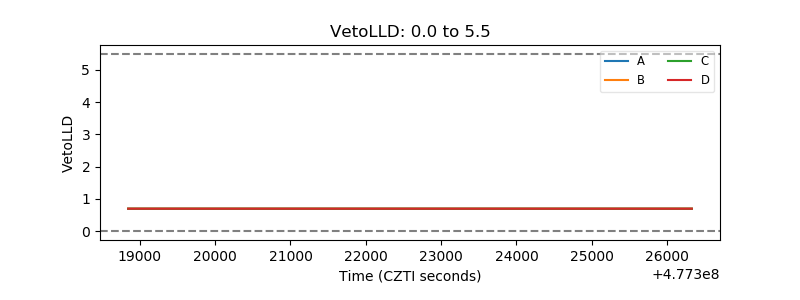 |
| Alpha Counter | 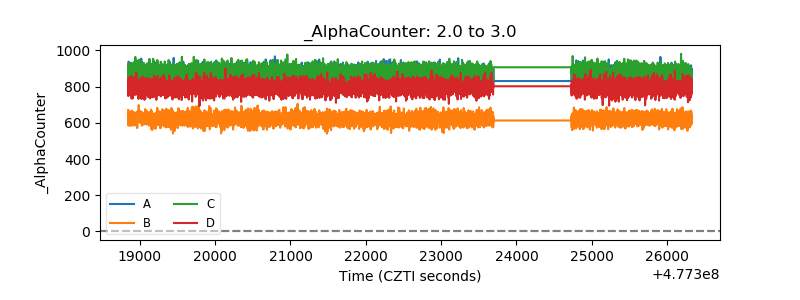 |
| _CPM_Rate | 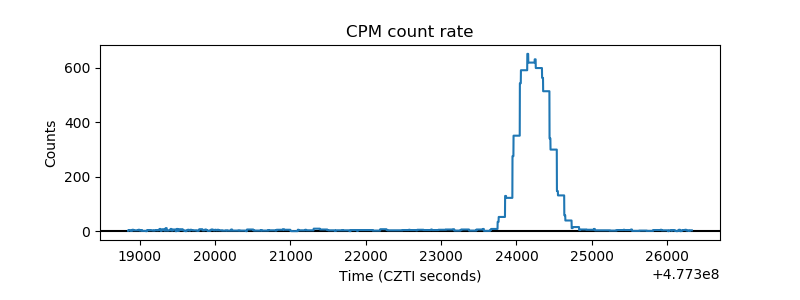 |
| CZT Counter | 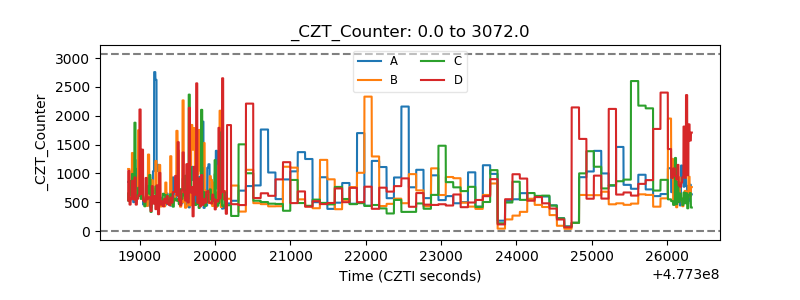 |
| +2.5 Volts monitor | 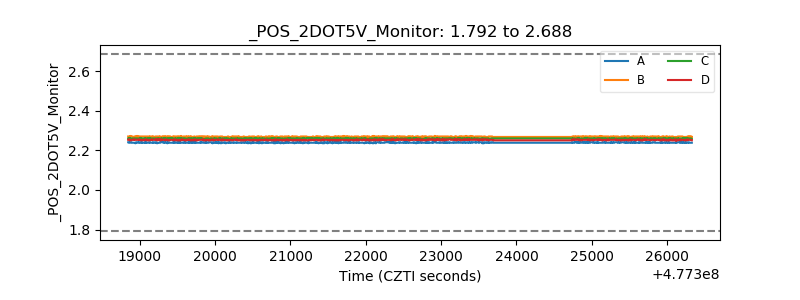 |
| +5 Volts monitor | 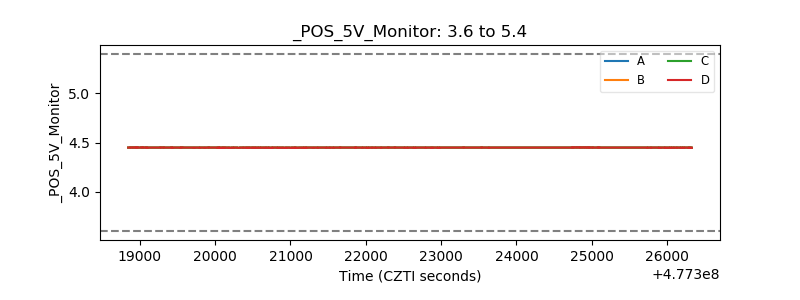 |
| _ROLL_ROT | 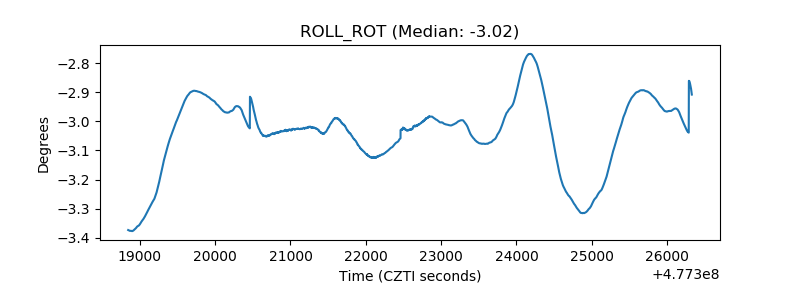 |
| _Roll_DEC | 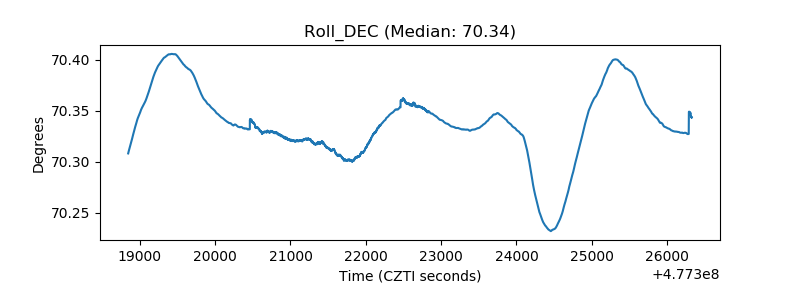 |
| _Roll_RA | 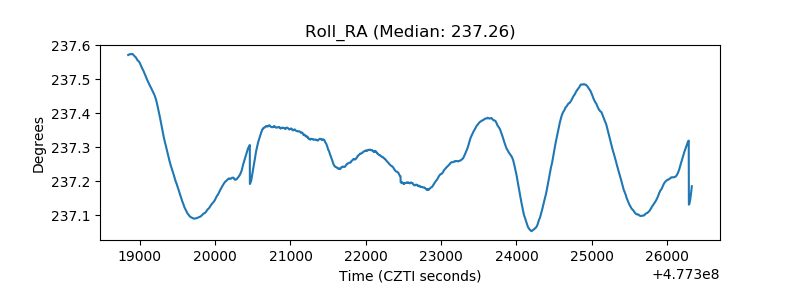 |
| Veto Counter | 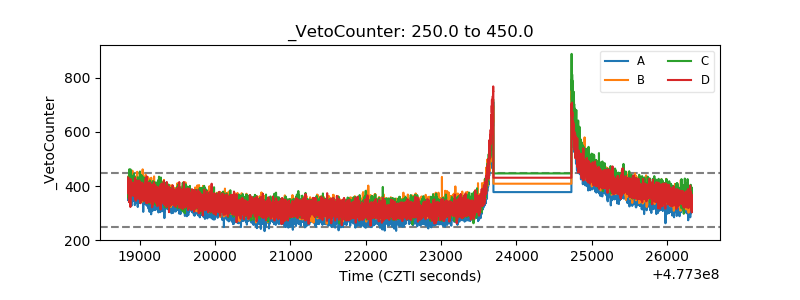 |