| Param | Original file | Final file |
|---|---|---|
| Filename | modeM0/AS1C07_001T01_9000006450_50768cztM0_level2.fits | modeM0/AS1C07_001T01_9000006450_50768cztM0_level2_quad_clean.evt |
| Size (bytes) | 597,919,680 | 93,214,080 |
| Size | 570.2 MB | 88.9 MB |
| Events in quadrant A | 4,816,968 | 621,673 |
| Events in quadrant B | 4,862,116 | 665,769 |
| Events in quadrant C | 4,889,514 | 581,322 |
| Events in quadrant D | 7,067,035 | 505,536 |
| Mode SS | |||
|---|---|---|---|
| Quadrant | BADHDUFLAG | Total packets | Discarded packets |
| A | 0 | 130 | 0 |
| B | 0 | 130 | 0 |
| C | 0 | 130 | 0 |
| D | 0 | 130 | 0 |
| Mode M0 | |||
|---|---|---|---|
| Quadrant | BADHDUFLAG | Total packets | Discarded packets |
| A | 0 | 18701 | 2 |
| B | 0 | 18929 | 1 |
| C | 0 | 18847 | 1 |
| D | 0 | 25447 | 1 |
| Mode M9 | |||
|---|---|---|---|
| Quadrant | BADHDUFLAG | Total packets | Discarded packets |
| A | 0 | 12 | 0 |
| B | 0 | 12 | 0 |
| C | 0 | 12 | 0 |
| D | 0 | 12 | 0 |
| Quadrant | Total seconds | Saturated seconds | Saturation percentage |
|---|---|---|---|
| A | 6423 | 293 | 4.561731% |
| B | 6423 | 459 | 7.146193% |
| C | 6424 | 377 | 5.868618% |
| D | 6424 | 983 | 15.301993% |
Noise dominated data is calculated using 1-second bins in cleaned event files. If a bin has >2000 counts, and if more than 50% of those come from <1% of pixels, then it is considered to be noise-dominated and hence unusable.
| Quadrant | # 1 sec bins | Bins with >0 counts | Bins with >2000 counts | High rate bins dominated by noise | Noise dominated (total time) | Noise dominated (detector-on time) | Marked lightcurve |
|---|---|---|---|---|---|---|---|
| A | 7558 | 6424 | 146 | 146 | 1.93% | 2.27% | 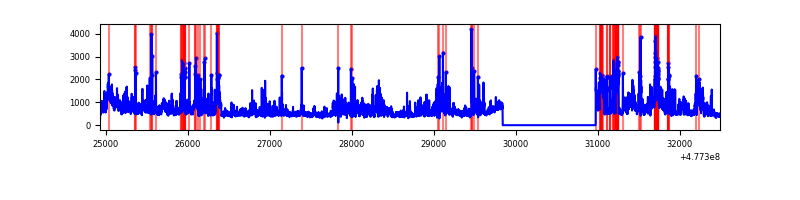 |
| B | 7558 | 6424 | 252 | 252 | 3.33% | 3.92% | 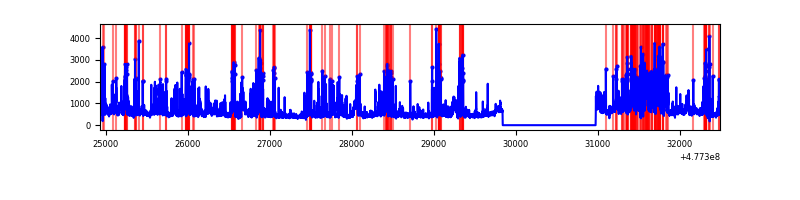 |
| C | 7559 | 6425 | 270 | 270 | 3.57% | 4.20% | 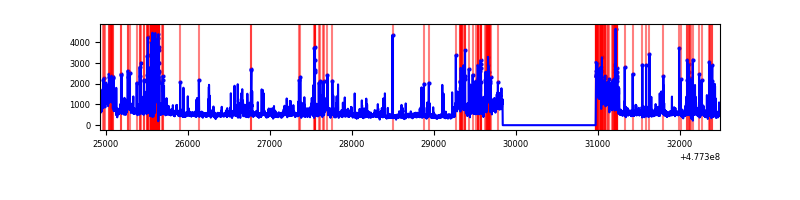 |
| D | 7559 | 6425 | 802 | 802 | 10.61% | 12.48% | 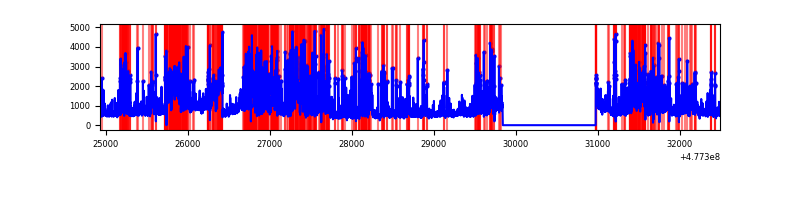 |
Top three noisy pixels from each quadrant. If the there are fewer than three noisy pixels in the level2.evt file, extra rows are filled as -1
| Pixel properties | Quadrant properties | ||||||
|---|---|---|---|---|---|---|---|
| Quadrant | DetID | PixID | Counts | Sigma | Mean | Median | Sigma |
| A | 4 | 4 | 1175410 | 6815.03 | 697 | 680 | 172.4 |
| A | 3 | 114 | 165280 | 954.9 | 697 | 680 | 172.4 |
| A | 4 | 3 | 123512 | 712.59 | 697 | 680 | 172.4 |
| B | 4 | 206 | 1559219 | 10602.32 | 689 | 664 | 147.0 |
| B | 7 | 0 | 136840 | 926.36 | 689 | 664 | 147.0 |
| B | 10 | 247 | 96761 | 653.71 | 689 | 664 | 147.0 |
| C | 10 | 171 | 391908 | 2149.45 | 673 | 668 | 182.0 |
| C | 0 | 145 | 299535 | 1641.96 | 673 | 668 | 182.0 |
| C | 15 | 231 | 292092 | 1601.06 | 673 | 668 | 182.0 |
| D | 2 | 216 | 1571192 | 8712.48 | 643 | 621 | 180.3 |
| D | 7 | 125 | 729232 | 4041.85 | 643 | 621 | 180.3 |
| D | 15 | 174 | 292284 | 1617.95 | 643 | 621 | 180.3 |
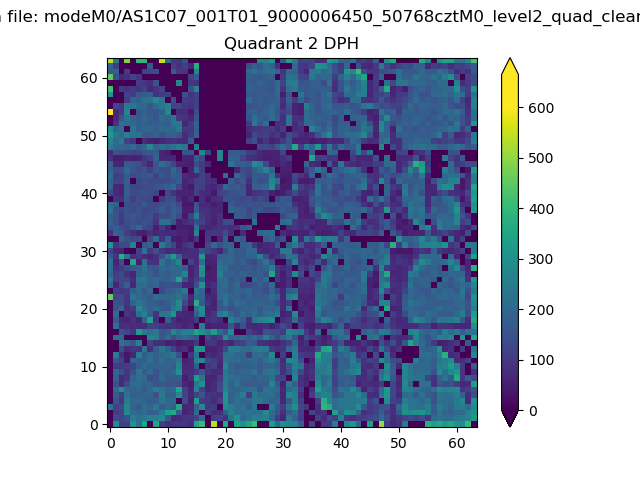
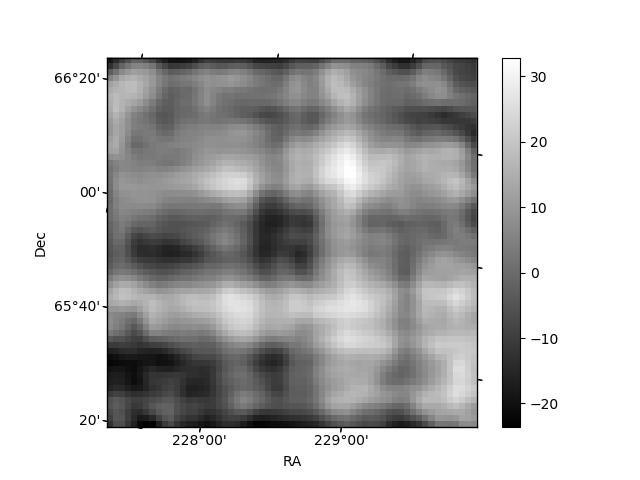
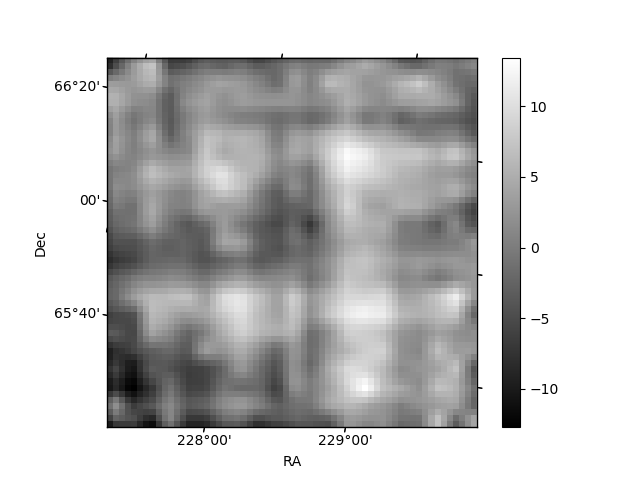
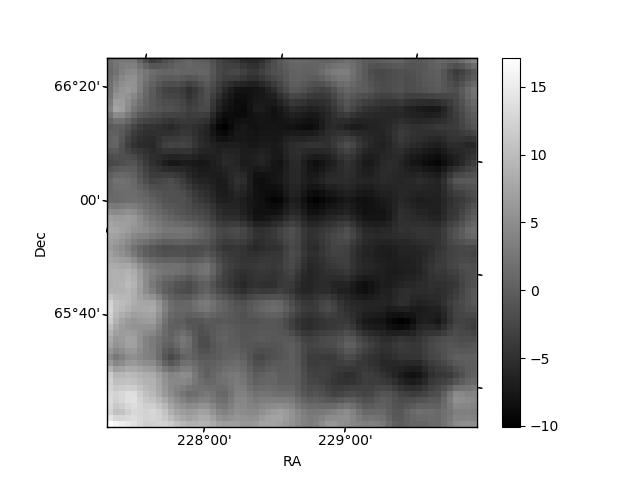
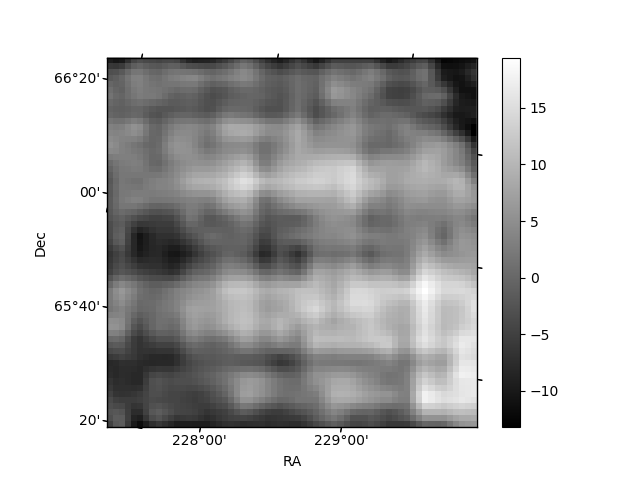
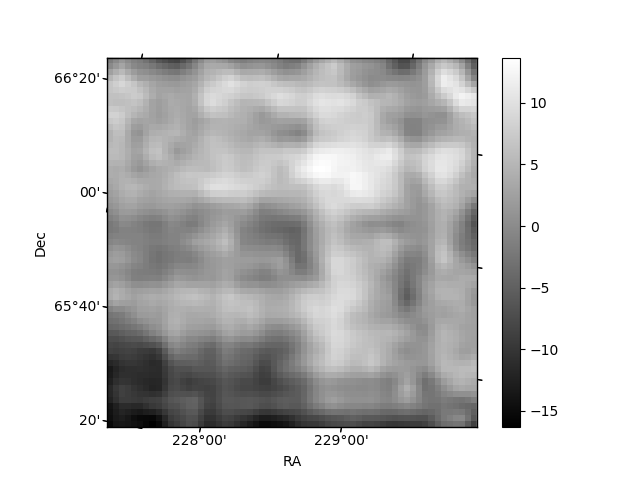
Histogram calculated using DETX and DETY for each event in the final _common_clean file
| Quadrant A | 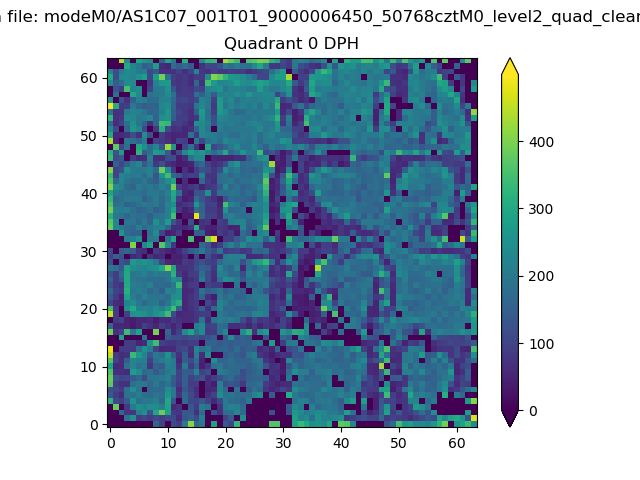 |
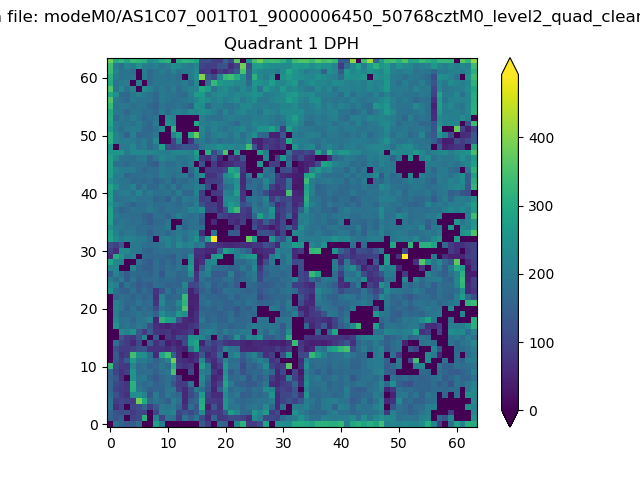 |
Quadrant B |
|---|---|---|---|
| Quadrant D | 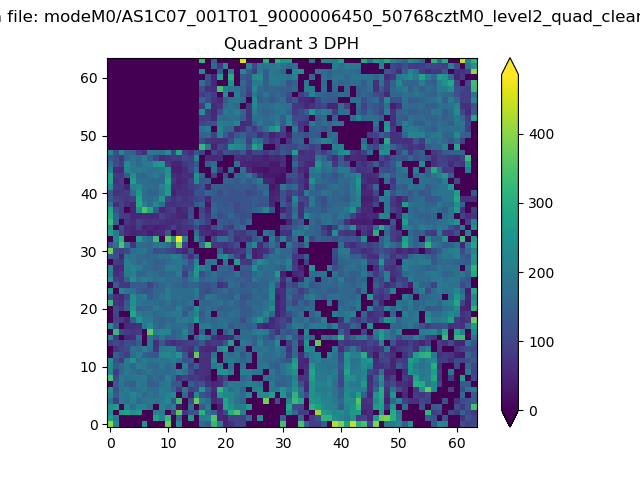 |
 |
Quadrant C |
| Plot type | Count rate plots | Images |
|---|---|---|
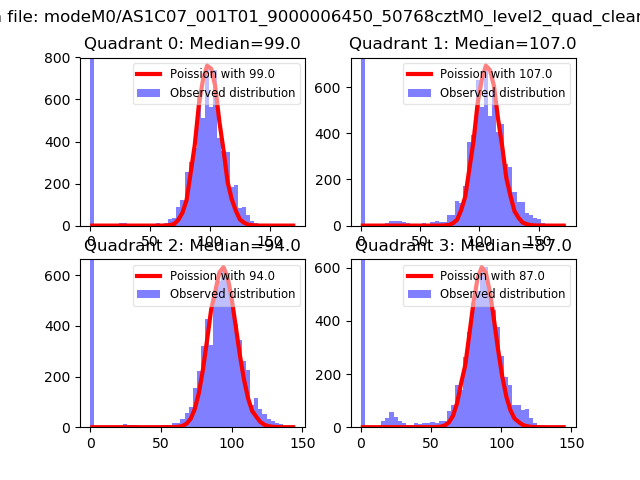
| Comparison with Poisson distribution Blue bars denote a histogram of data divided into 1 sec bins. Red curve is a Poisson curve with rate = median count rate of data. |
 |
 |
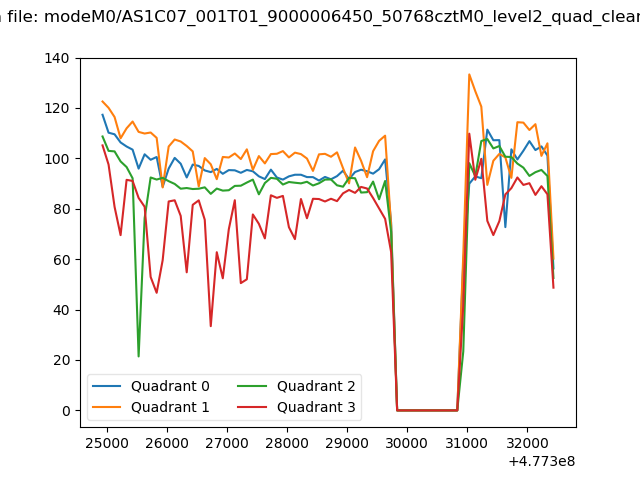
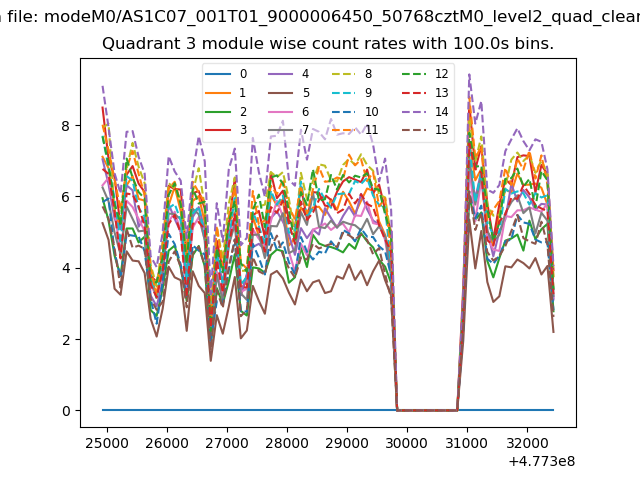
| Quadrant-wise count rates Data is divided into 100 sec bins |
 |
|
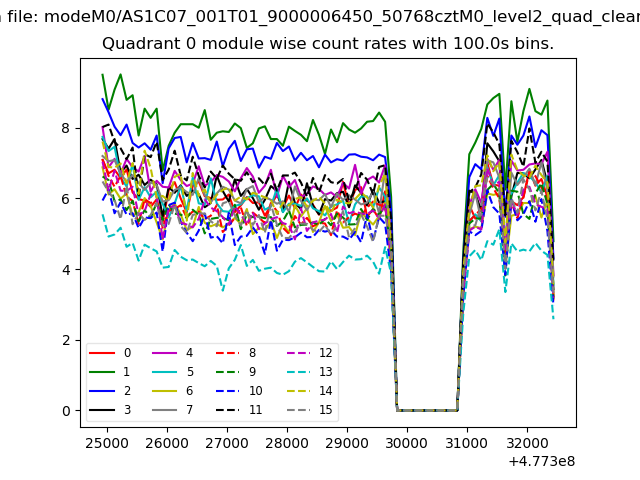
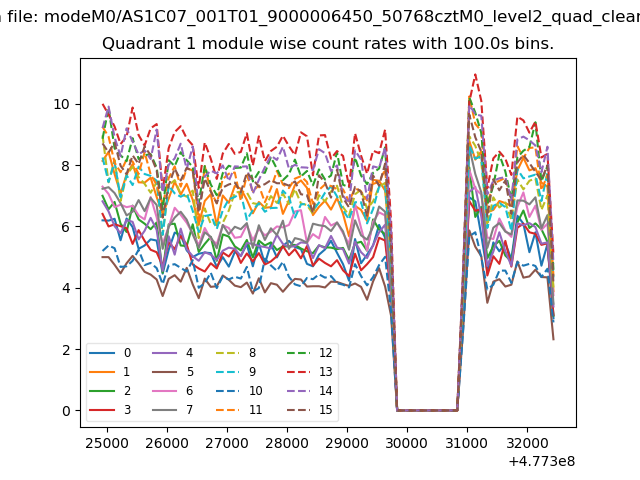
| Module-wise count rates for Quadrant A Data is divided into 100 sec bins |
 |
 |
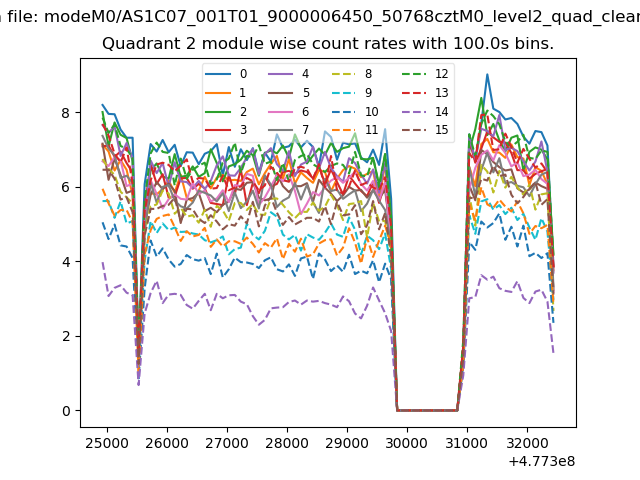
| Module-wise count rates for Quadrant B Data is divided into 100 sec bins |
 |
 |
| Module-wise count rates for Quadrant C Data is divided into 100 sec bins |
 |
 |
| Module-wise count rates for Quadrant D Data is divided into 100 sec bins |
 |
 |
| Parameter | Plot |
|---|---|
| CZT HV Monitor | 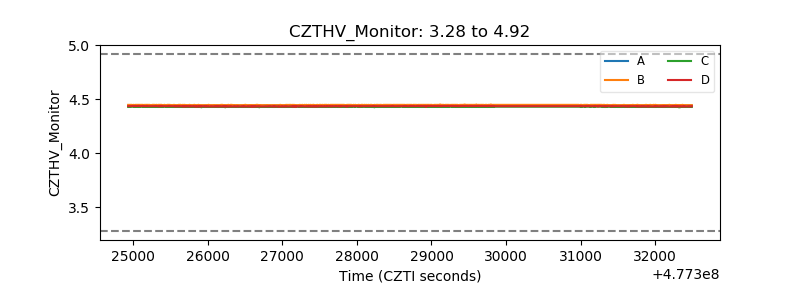 |
| D_VDD | 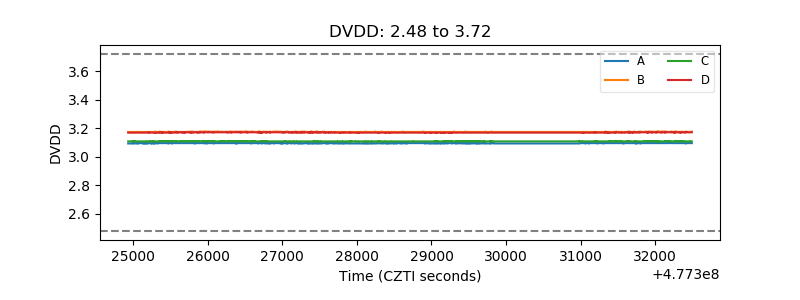 |
| Temperature 1 | 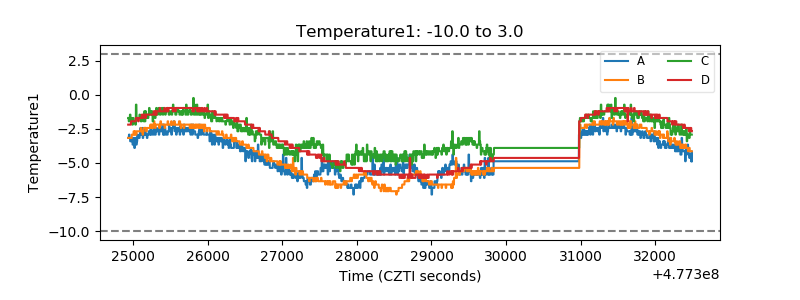 |
| Veto HV Monitor | 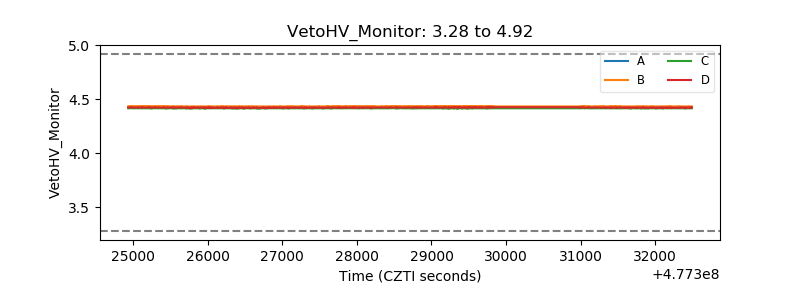 |
| Veto LLD | 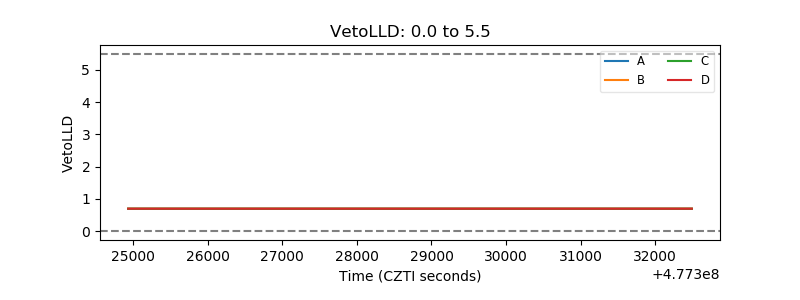 |
| Alpha Counter | 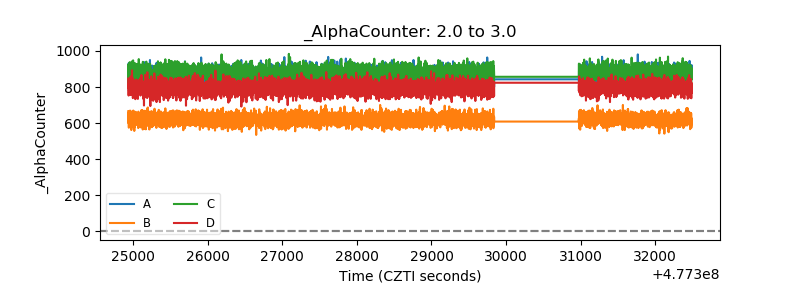 |
| _CPM_Rate | 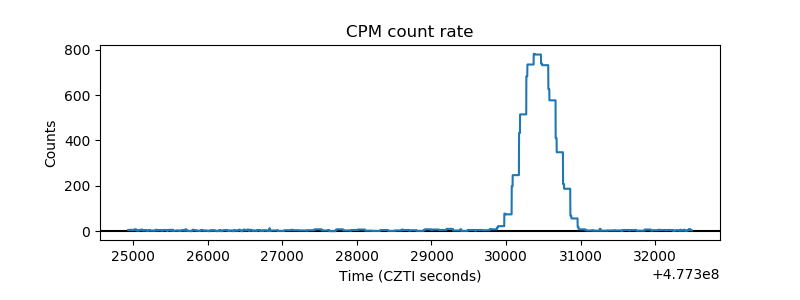 |
| CZT Counter | 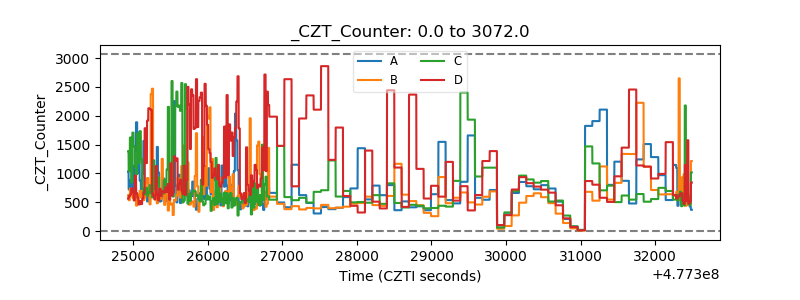 |
| +2.5 Volts monitor | 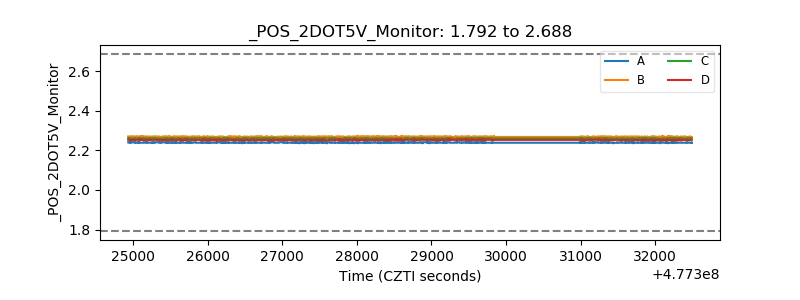 |
| +5 Volts monitor | 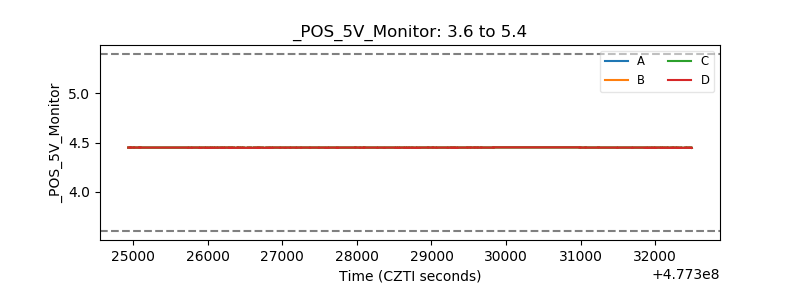 |
| _ROLL_ROT | 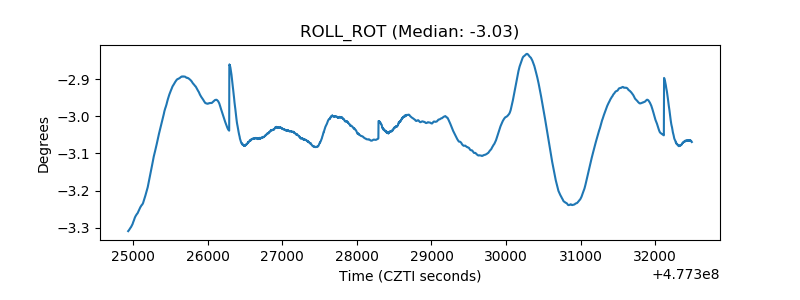 |
| _Roll_DEC | 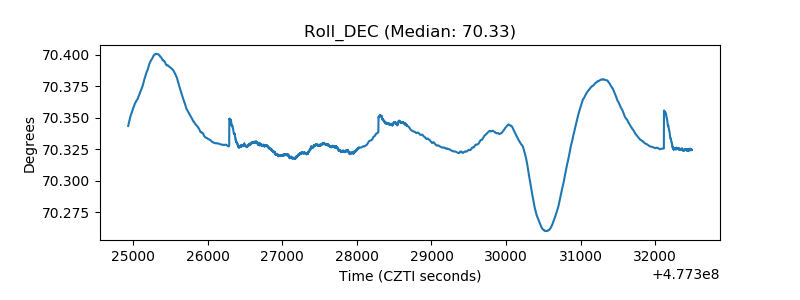 |
| _Roll_RA | 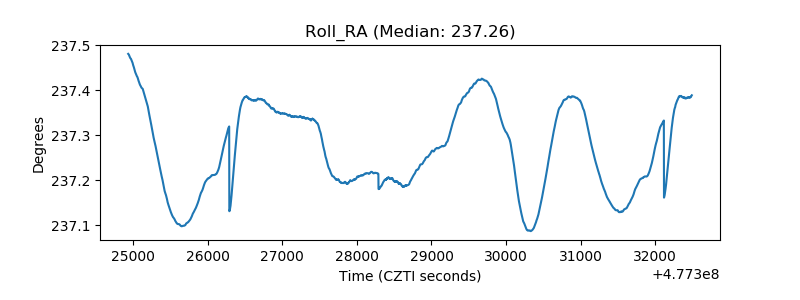 |
| Veto Counter | 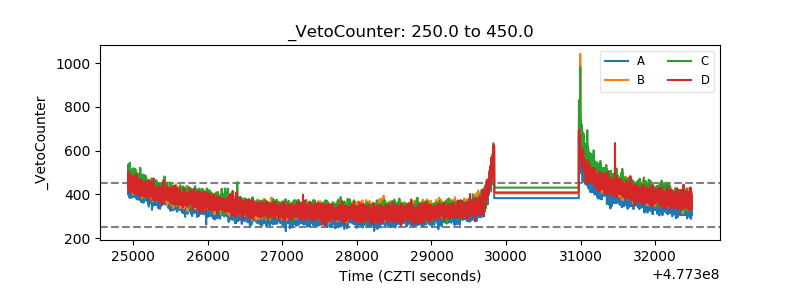 |