| Param | Original file | Final file |
|---|---|---|
| Filename | modeM0/AS1C07_001T01_9000006450_50769cztM0_level2.fits | modeM0/AS1C07_001T01_9000006450_50769cztM0_level2_quad_clean.evt |
| Size (bytes) | 576,417,600 | 93,873,600 |
| Size | 549.7 MB | 89.5 MB |
| Events in quadrant A | 6,273,902 | 564,665 |
| Events in quadrant B | 4,123,376 | 683,149 |
| Events in quadrant C | 4,973,430 | 597,691 |
| Events in quadrant D | 5,469,349 | 548,929 |
| Mode SS | |||
|---|---|---|---|
| Quadrant | BADHDUFLAG | Total packets | Discarded packets |
| A | 0 | 132 | 0 |
| B | 0 | 132 | 0 |
| C | 0 | 132 | 0 |
| D | 0 | 132 | 0 |
| Mode M0 | |||
|---|---|---|---|
| Quadrant | BADHDUFLAG | Total packets | Discarded packets |
| A | 0 | 23093 | 2 |
| B | 0 | 16743 | 2 |
| C | 0 | 19114 | 2 |
| D | 0 | 20705 | 5 |
| Mode M9 | |||
|---|---|---|---|
| Quadrant | BADHDUFLAG | Total packets | Discarded packets |
| A | 0 | 11 | 0 |
| B | 0 | 11 | 0 |
| C | 0 | 11 | 0 |
| D | 0 | 11 | 0 |
| Quadrant | Total seconds | Saturated seconds | Saturation percentage |
|---|---|---|---|
| A | 6413 | 968 | 15.094340% |
| B | 6414 | 299 | 4.661678% |
| C | 6414 | 313 | 4.879950% |
| D | 6413 | 479 | 7.469203% |
Noise dominated data is calculated using 1-second bins in cleaned event files. If a bin has >2000 counts, and if more than 50% of those come from <1% of pixels, then it is considered to be noise-dominated and hence unusable.
| Quadrant | # 1 sec bins | Bins with >0 counts | Bins with >2000 counts | High rate bins dominated by noise | Noise dominated (total time) | Noise dominated (detector-on time) | Marked lightcurve |
|---|---|---|---|---|---|---|---|
| A | 7568 | 6414 | 678 | 678 | 8.96% | 10.57% | 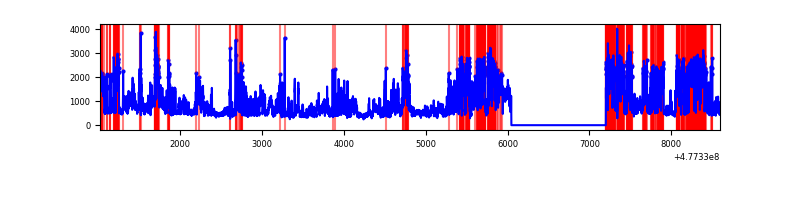 |
| B | 7569 | 6415 | 153 | 153 | 2.02% | 2.39% | 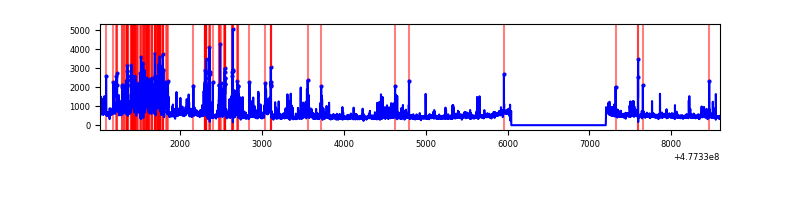 |
| C | 7569 | 6415 | 194 | 194 | 2.56% | 3.02% | 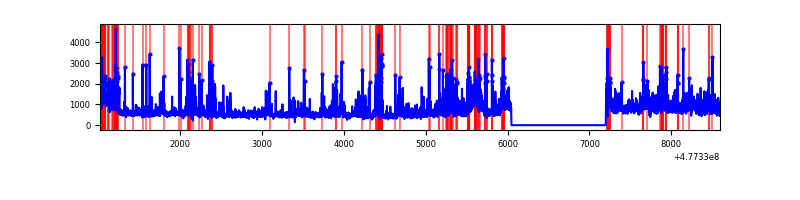 |
| D | 7568 | 6413 | 357 | 357 | 4.72% | 5.57% | 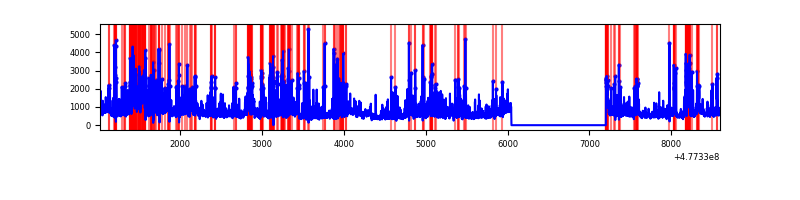 |
Top three noisy pixels from each quadrant. If the there are fewer than three noisy pixels in the level2.evt file, extra rows are filled as -1
| Pixel properties | Quadrant properties | ||||||
|---|---|---|---|---|---|---|---|
| Quadrant | DetID | PixID | Counts | Sigma | Mean | Median | Sigma |
| A | 4 | 4 | 2930110 | 17481.43 | 677 | 662 | 167.6 |
| A | 4 | 3 | 112399 | 666.79 | 677 | 662 | 167.6 |
| A | 3 | 114 | 105249 | 624.12 | 677 | 662 | 167.6 |
| B | 4 | 206 | 780633 | 5339.97 | 699 | 674 | 146.1 |
| B | 7 | 0 | 124933 | 850.73 | 699 | 674 | 146.1 |
| B | 10 | 247 | 122620 | 834.9 | 699 | 674 | 146.1 |
| C | 5 | 10 | 897151 | 4765.79 | 686 | 681 | 188.1 |
| C | 13 | 3 | 212582 | 1126.5 | 686 | 681 | 188.1 |
| C | 15 | 231 | 174699 | 925.11 | 686 | 681 | 188.1 |
| D | 2 | 216 | 635493 | 3444.45 | 669 | 646 | 184.3 |
| D | 15 | 174 | 626576 | 3396.07 | 669 | 646 | 184.3 |
| D | 11 | 245 | 229572 | 1242.07 | 669 | 646 | 184.3 |
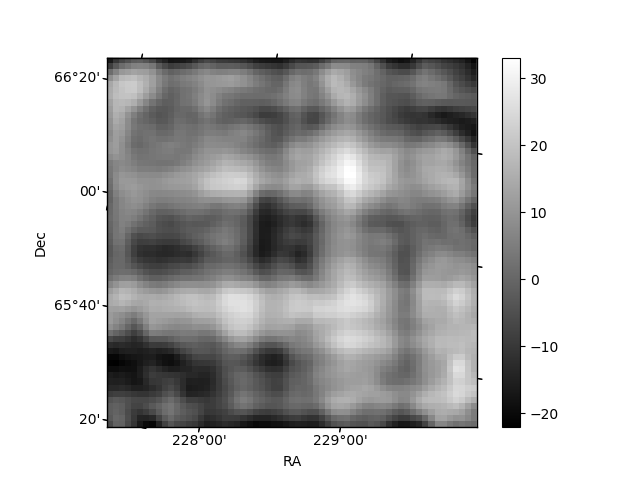
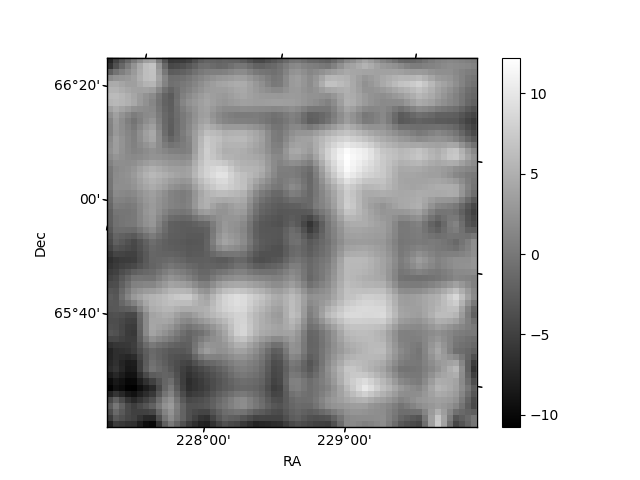
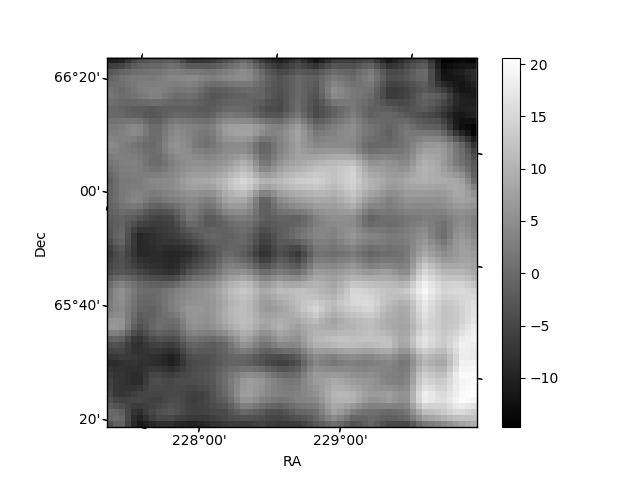
Histogram calculated using DETX and DETY for each event in the final _common_clean file
| Quadrant A | 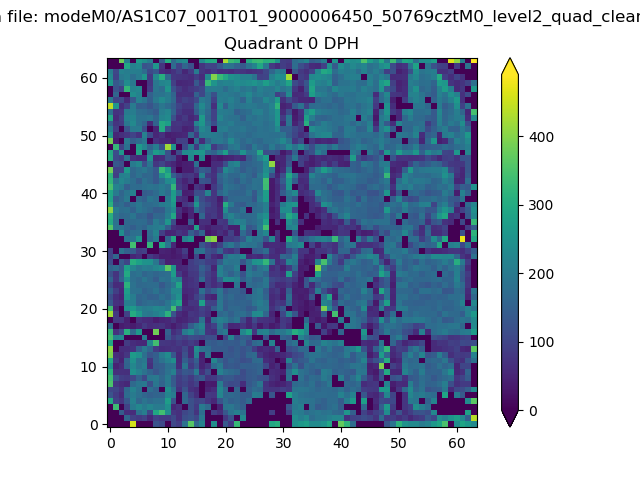 |
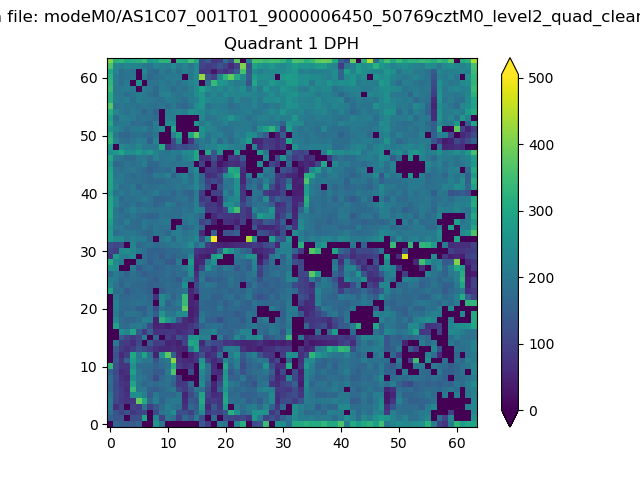 |
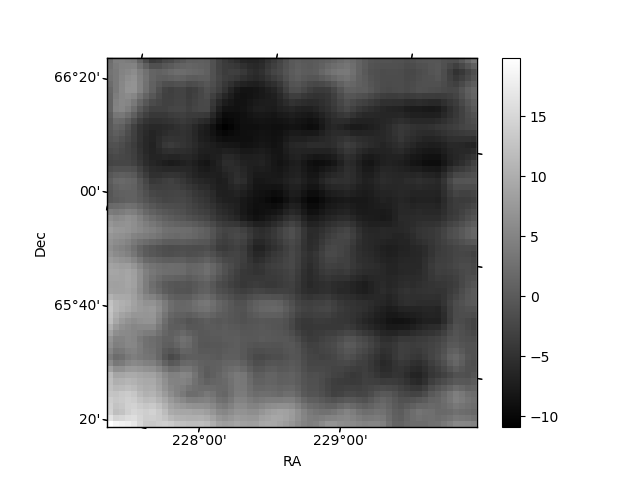
Quadrant B |
|---|---|---|---|
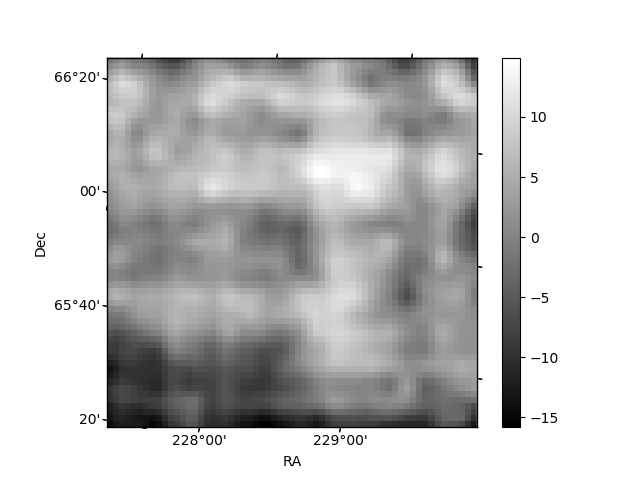
| Quadrant D | 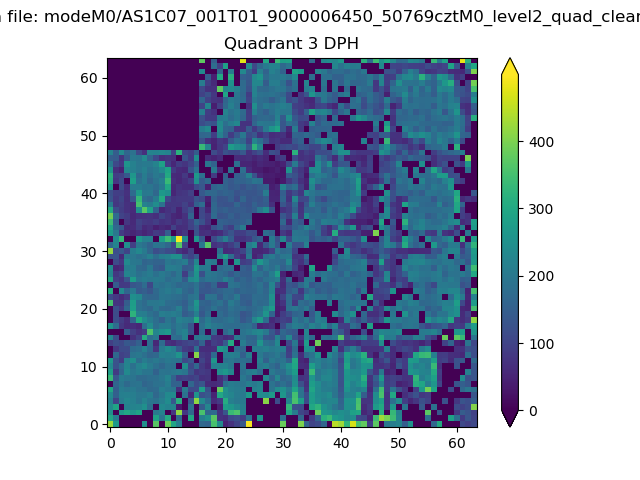 |
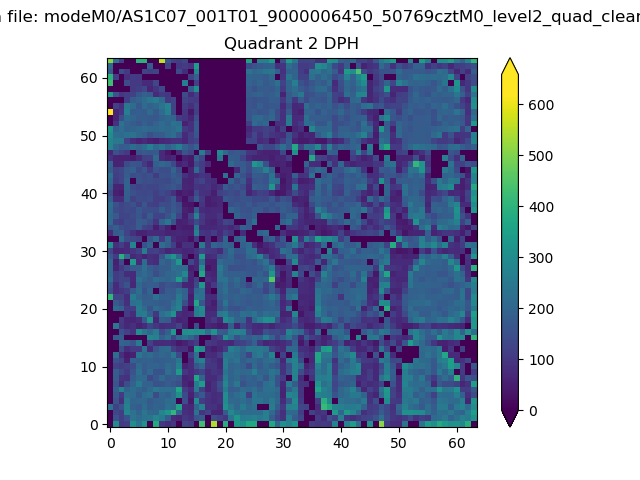 |
Quadrant C |
| Plot type | Count rate plots | Images |
|---|---|---|
| Comparison with Poisson distribution Blue bars denote a histogram of data divided into 1 sec bins. Red curve is a Poisson curve with rate = median count rate of data. |
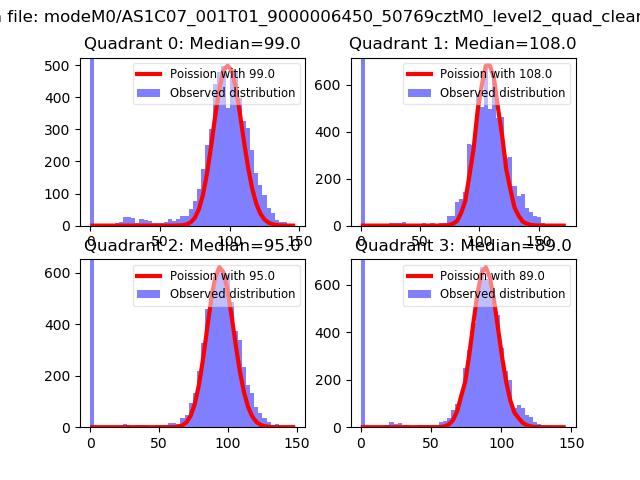 |
 |
| Quadrant-wise count rates Data is divided into 100 sec bins |
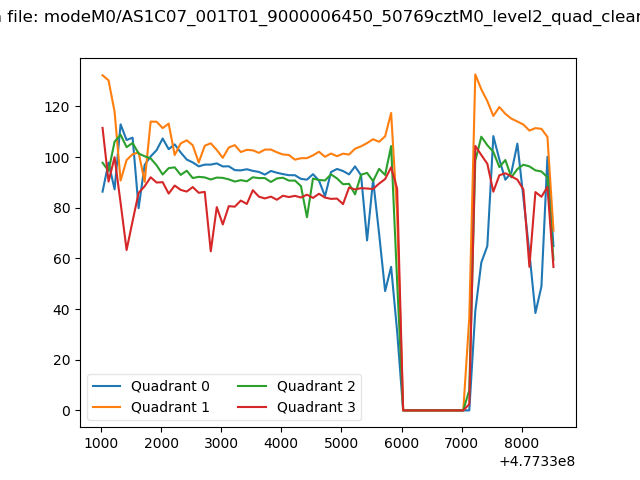 |
|
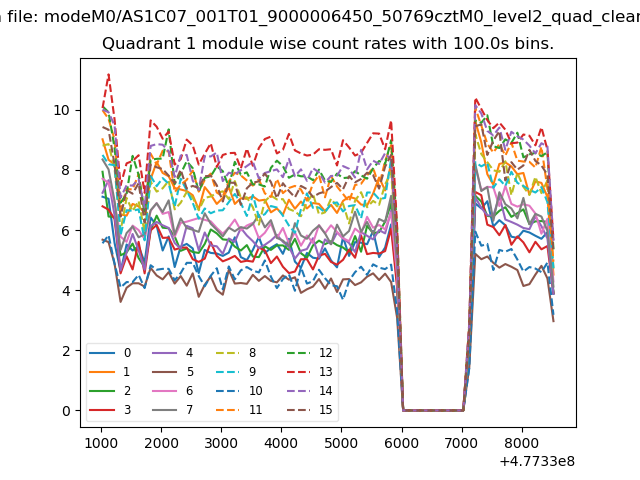
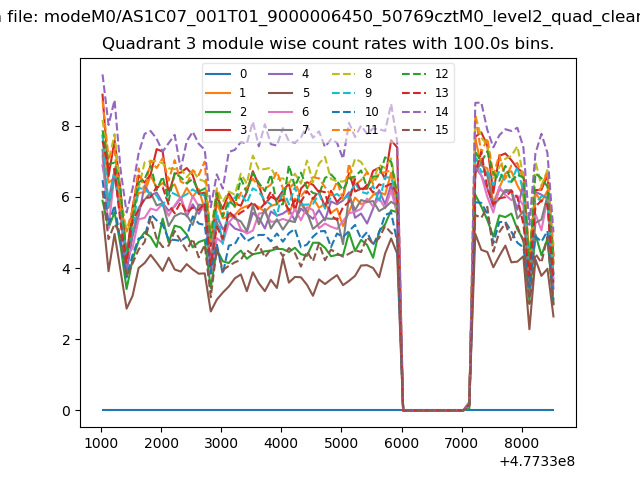
| Module-wise count rates for Quadrant A Data is divided into 100 sec bins |
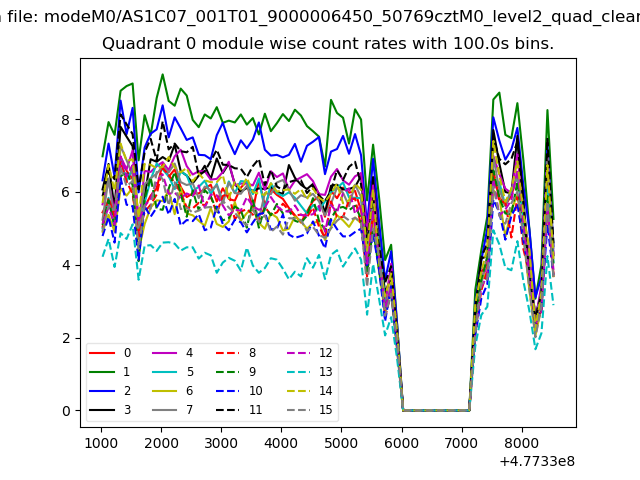 |
 |
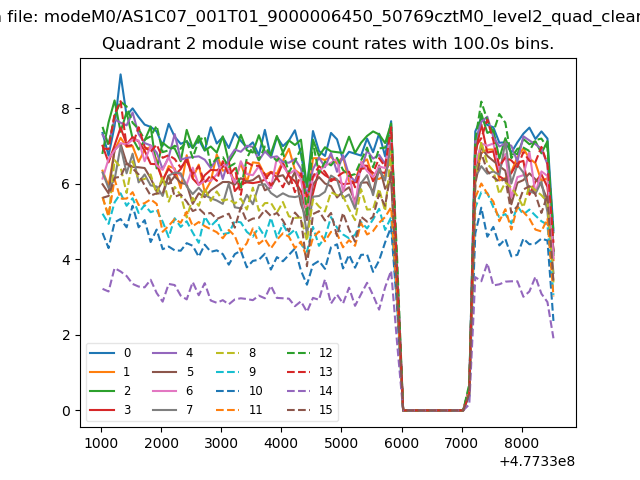
| Module-wise count rates for Quadrant B Data is divided into 100 sec bins |
 |
 |
| Module-wise count rates for Quadrant C Data is divided into 100 sec bins |
 |
 |
| Module-wise count rates for Quadrant D Data is divided into 100 sec bins |
 |
 |
| Parameter | Plot |
|---|---|
| CZT HV Monitor | 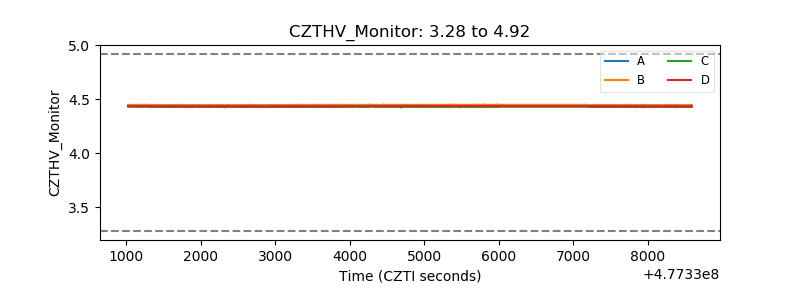 |
| D_VDD | 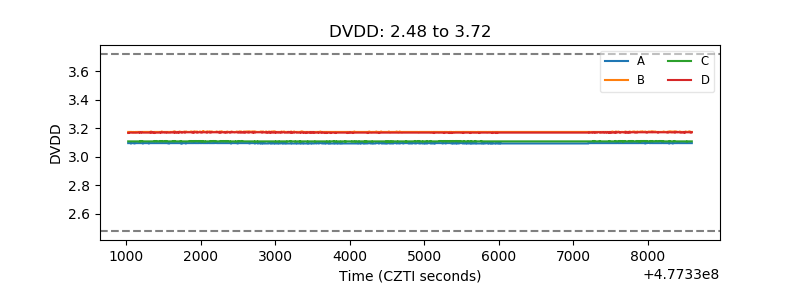 |
| Temperature 1 | 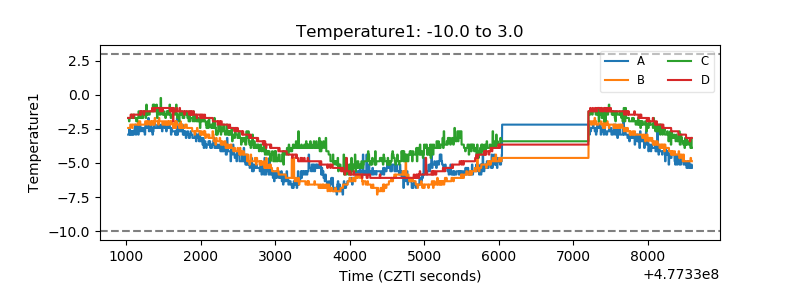 |
| Veto HV Monitor | 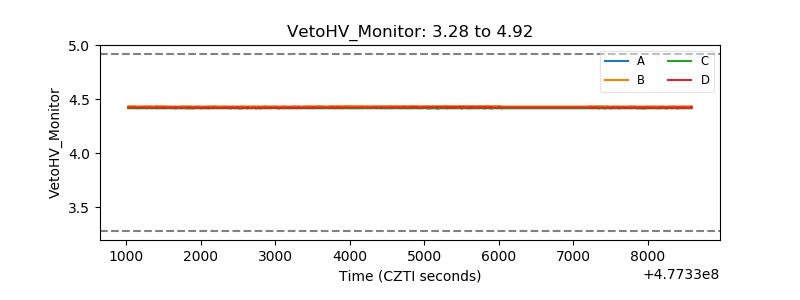 |
| Veto LLD | 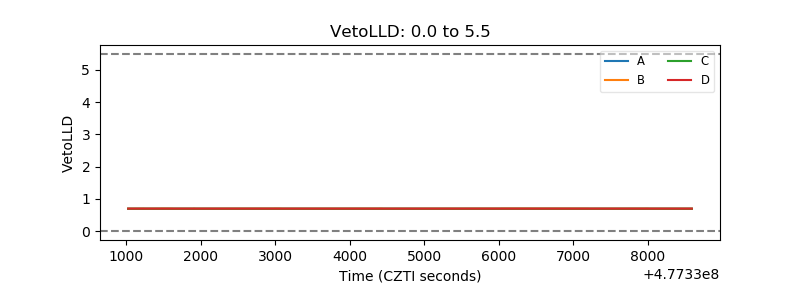 |
| Alpha Counter | 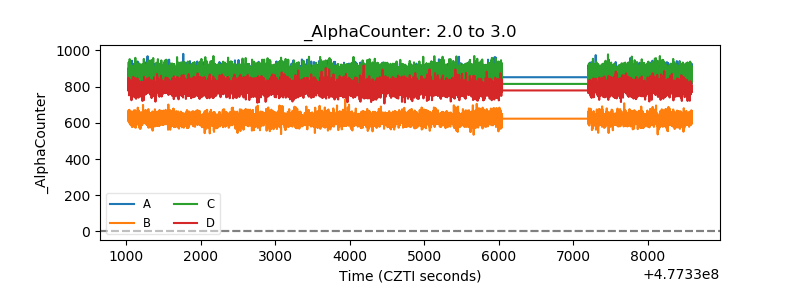 |
| _CPM_Rate | 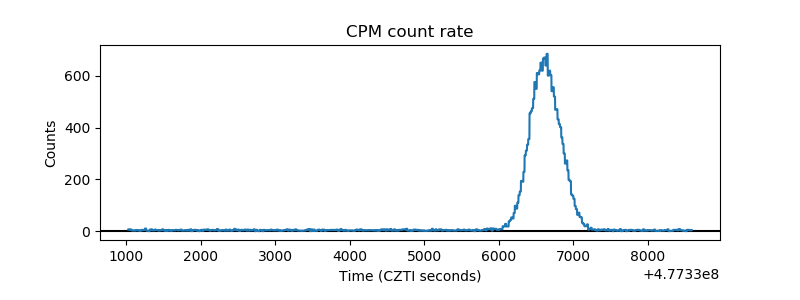 |
| CZT Counter | 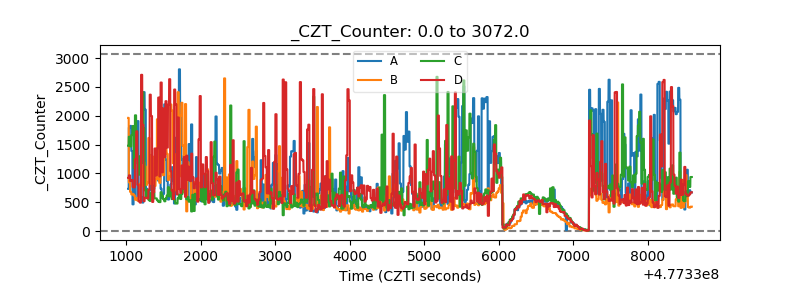 |
| +2.5 Volts monitor | 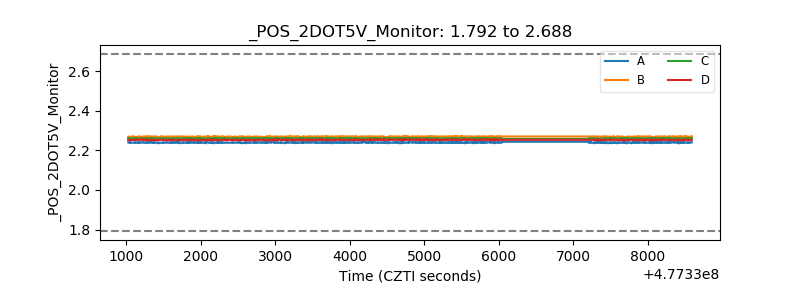 |
| +5 Volts monitor |  |
| _ROLL_ROT | 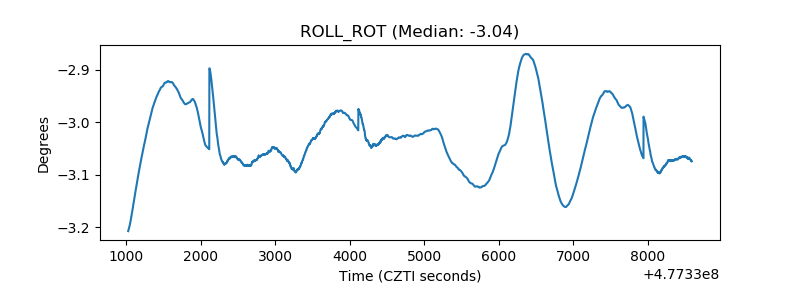 |
| _Roll_DEC | 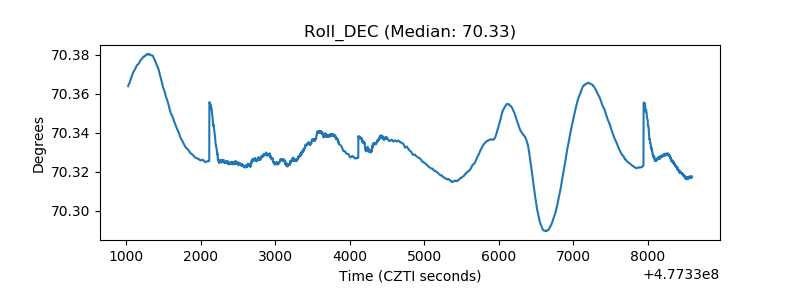 |
| _Roll_RA | 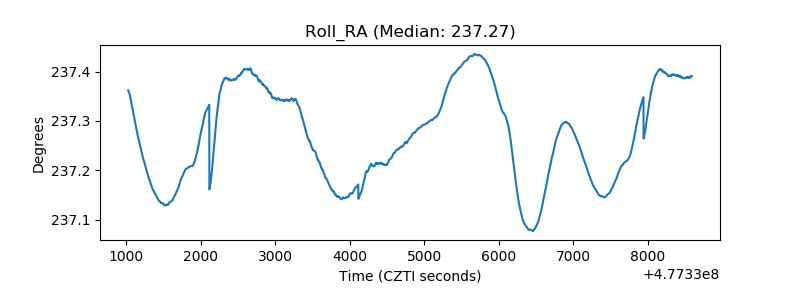 |
| Veto Counter | 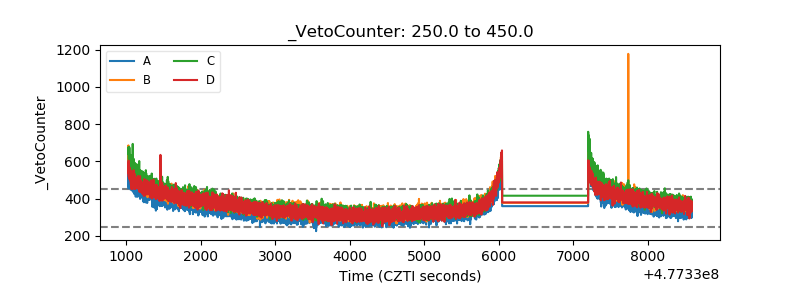 |