| Param | Original file | Final file |
|---|---|---|
| Filename | modeM0/AS1C07_001T01_9000006450_50770cztM0_level2.fits | modeM0/AS1C07_001T01_9000006450_50770cztM0_level2_quad_clean.evt |
| Size (bytes) | 592,450,560 | 86,397,120 |
| Size | 565.0 MB | 82.4 MB |
| Events in quadrant A | 5,364,459 | 573,868 |
| Events in quadrant B | 3,747,374 | 670,954 |
| Events in quadrant C | 6,246,083 | 590,259 |
| Events in quadrant D | 6,070,253 | 330,175 |
| Mode SS | |||
|---|---|---|---|
| Quadrant | BADHDUFLAG | Total packets | Discarded packets |
| A | 0 | 132 | 0 |
| B | 0 | 132 | 0 |
| C | 0 | 132 | 0 |
| D | 0 | 132 | 0 |
| Mode M0 | |||
|---|---|---|---|
| Quadrant | BADHDUFLAG | Total packets | Discarded packets |
| A | 0 | 20452 | 2 |
| B | 0 | 15630 | 2 |
| C | 0 | 23122 | 2 |
| D | 0 | 22573 | 2 |
| Mode M9 | |||
|---|---|---|---|
| Quadrant | BADHDUFLAG | Total packets | Discarded packets |
| A | 0 | 11 | 0 |
| B | 0 | 11 | 0 |
| C | 0 | 11 | 0 |
| D | 0 | 11 | 0 |
| Quadrant | Total seconds | Saturated seconds | Saturation percentage |
|---|---|---|---|
| A | 6456 | 784 | 12.143742% |
| B | 6456 | 299 | 4.631351% |
| C | 6457 | 363 | 5.621806% |
| D | 6457 | 2861 | 44.308502% |
Noise dominated data is calculated using 1-second bins in cleaned event files. If a bin has >2000 counts, and if more than 50% of those come from <1% of pixels, then it is considered to be noise-dominated and hence unusable.
| Quadrant | # 1 sec bins | Bins with >0 counts | Bins with >2000 counts | High rate bins dominated by noise | Noise dominated (total time) | Noise dominated (detector-on time) | Marked lightcurve |
|---|---|---|---|---|---|---|---|
| A | 7546 | 6457 | 644 | 644 | 8.53% | 9.97% | 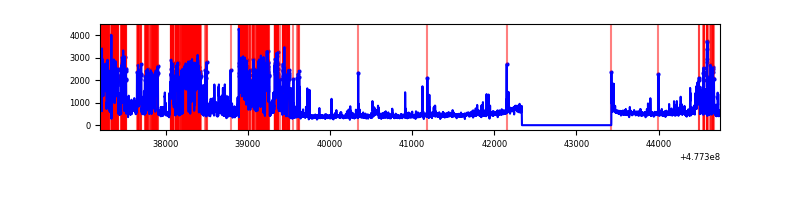 |
| B | 7546 | 6457 | 129 | 129 | 1.71% | 2.00% | 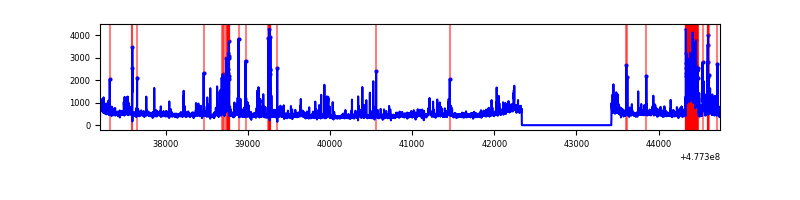 |
| C | 7547 | 6458 | 210 | 210 | 2.78% | 3.25% | 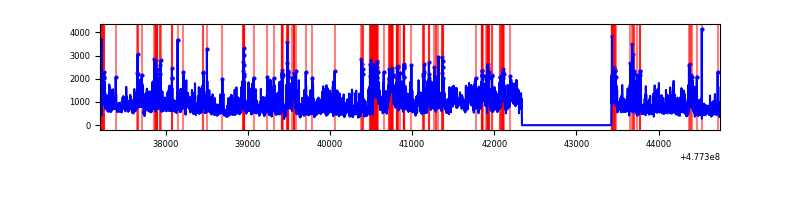 |
| D | 7546 | 6450 | 427 | 427 | 5.66% | 6.62% | 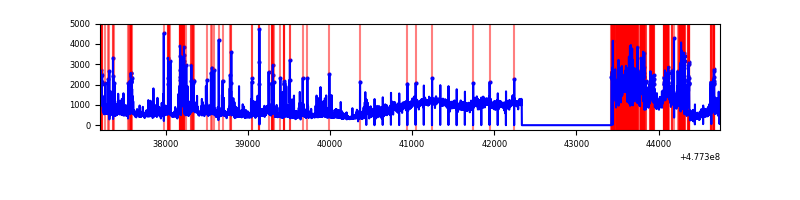 |
Top three noisy pixels from each quadrant. If the there are fewer than three noisy pixels in the level2.evt file, extra rows are filled as -1
| Pixel properties | Quadrant properties | ||||||
|---|---|---|---|---|---|---|---|
| Quadrant | DetID | PixID | Counts | Sigma | Mean | Median | Sigma |
| A | 4 | 4 | 2007511 | 11882.33 | 682 | 663 | 168.9 |
| A | 4 | 3 | 127873 | 753.2 | 682 | 663 | 168.9 |
| A | 8 | 38 | 83272 | 489.12 | 682 | 663 | 168.9 |
| B | 5 | 185 | 445589 | 3053.92 | 693 | 669 | 145.7 |
| B | 7 | 0 | 61683 | 418.8 | 693 | 669 | 145.7 |
| B | 0 | 229 | 59123 | 401.23 | 693 | 669 | 145.7 |
| C | 5 | 10 | 2791971 | 14886.06 | 684 | 678 | 187.5 |
| C | 13 | 3 | 183730 | 976.22 | 684 | 678 | 187.5 |
| C | 1 | 243 | 68129 | 359.72 | 684 | 678 | 187.5 |
| D | 8 | 226 | 775860 | 6407.26 | 438 | 424 | 121.0 |
| D | 8 | 178 | 563414 | 4651.87 | 438 | 424 | 121.0 |
| D | 8 | 146 | 557371 | 4601.94 | 438 | 424 | 121.0 |
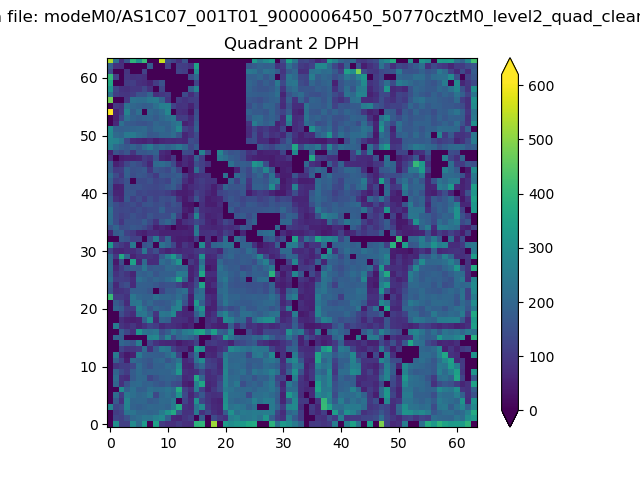
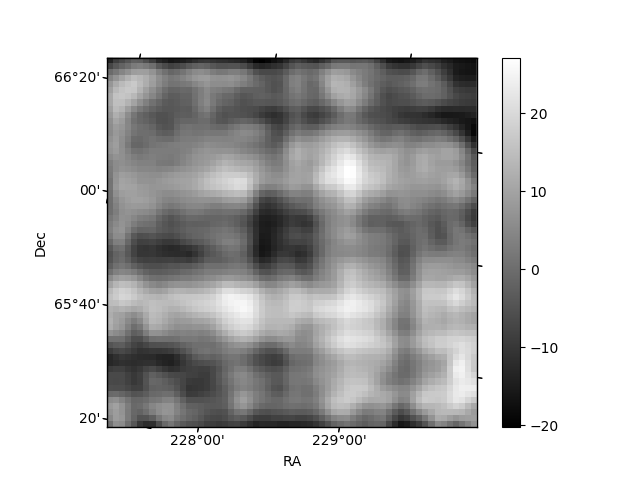
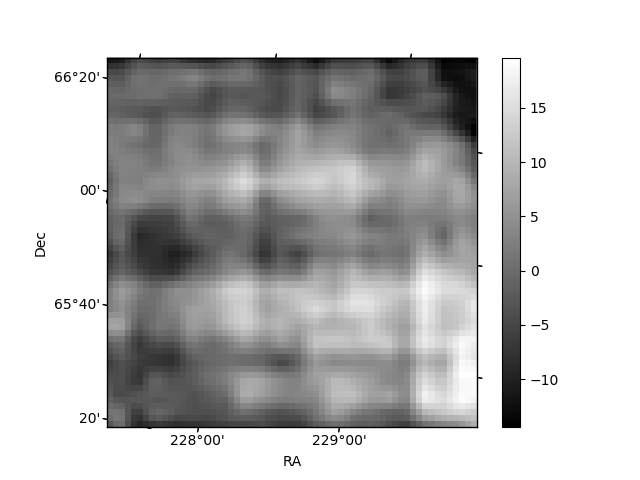
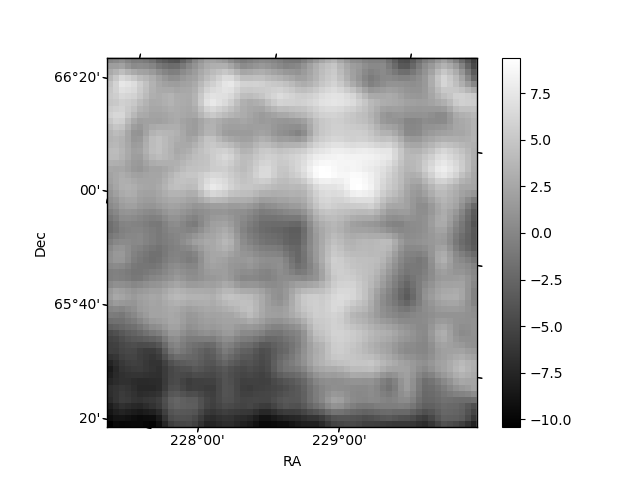
Histogram calculated using DETX and DETY for each event in the final _common_clean file
| Quadrant A | 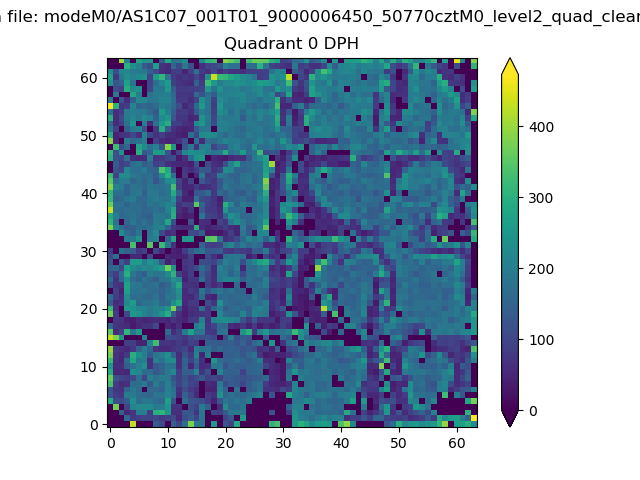 |
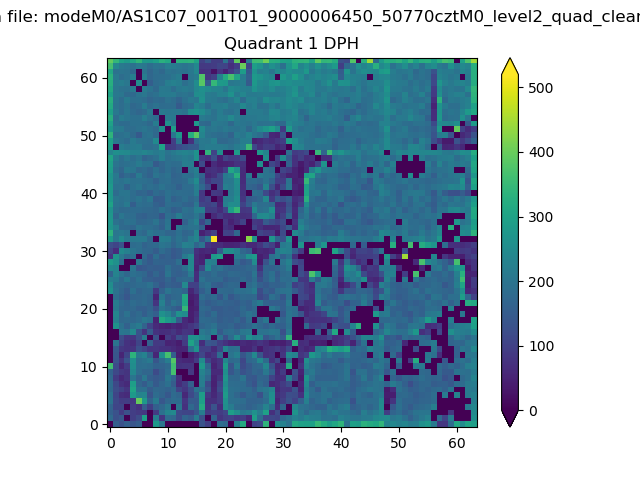 |
Quadrant B |
|---|---|---|---|
| Quadrant D | 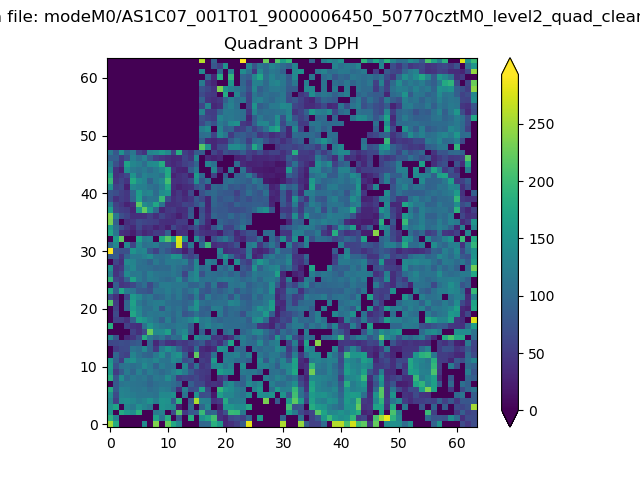 |
 |
Quadrant C |
| Plot type | Count rate plots | Images |
|---|---|---|
| Comparison with Poisson distribution Blue bars denote a histogram of data divided into 1 sec bins. Red curve is a Poisson curve with rate = median count rate of data. |
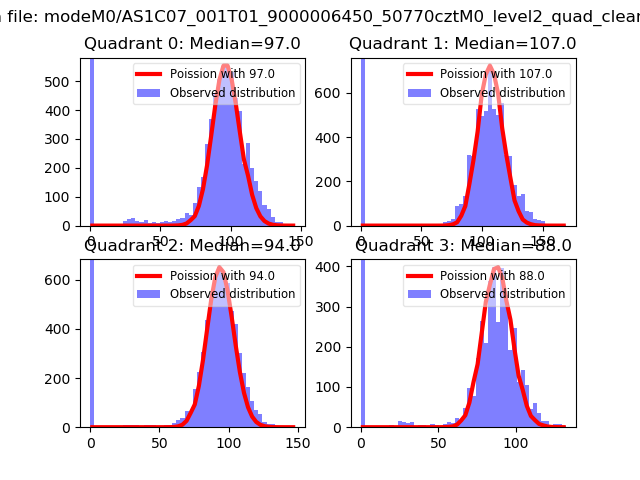 |
 |
| Quadrant-wise count rates Data is divided into 100 sec bins |
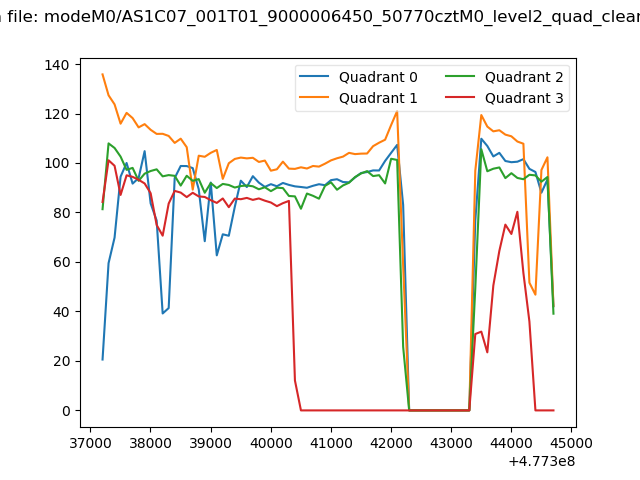 |
|
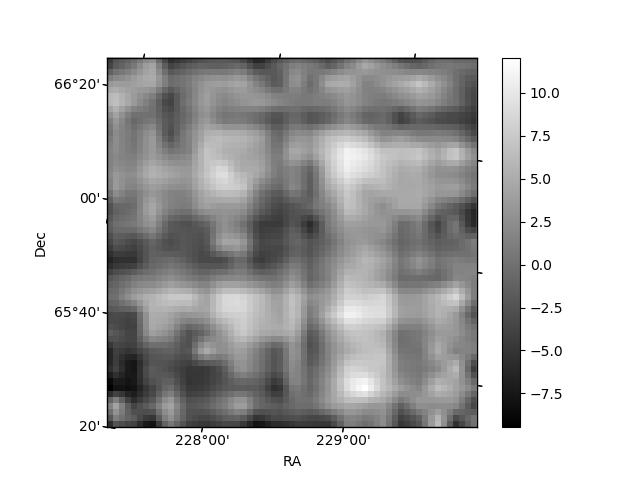
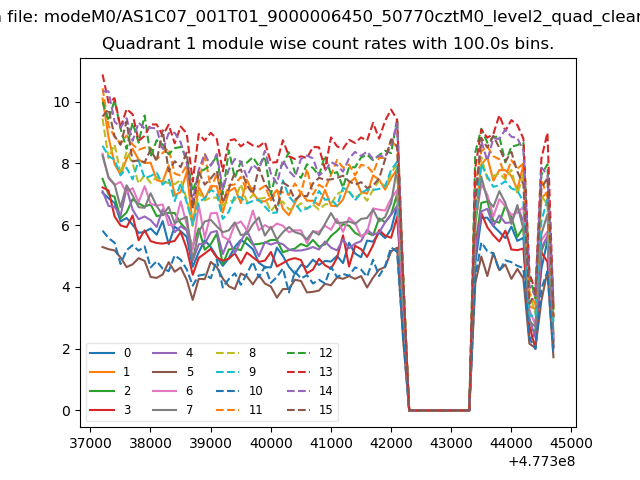
| Module-wise count rates for Quadrant A Data is divided into 100 sec bins |
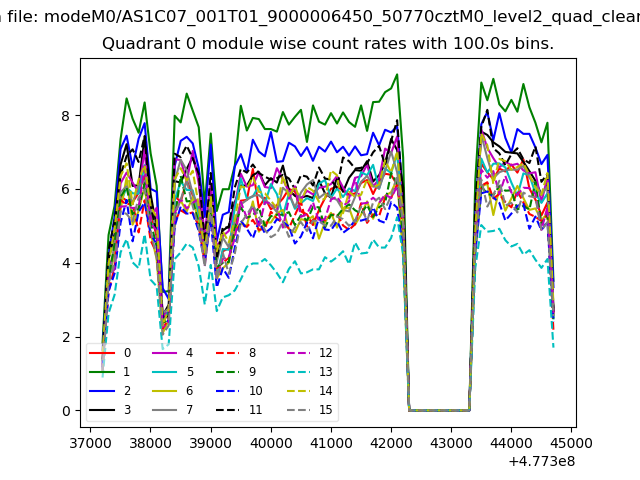 |
 |
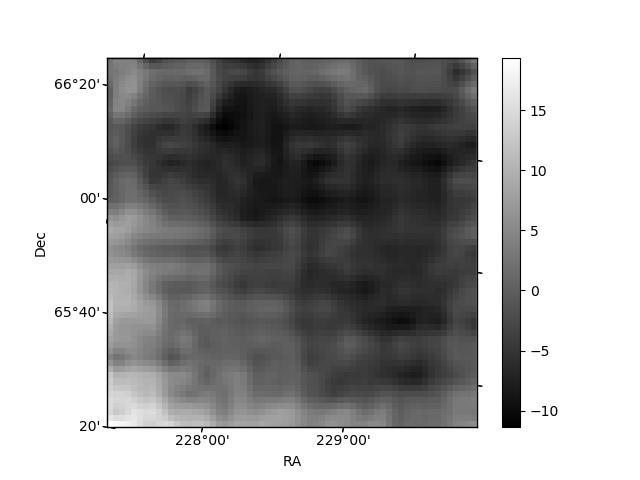
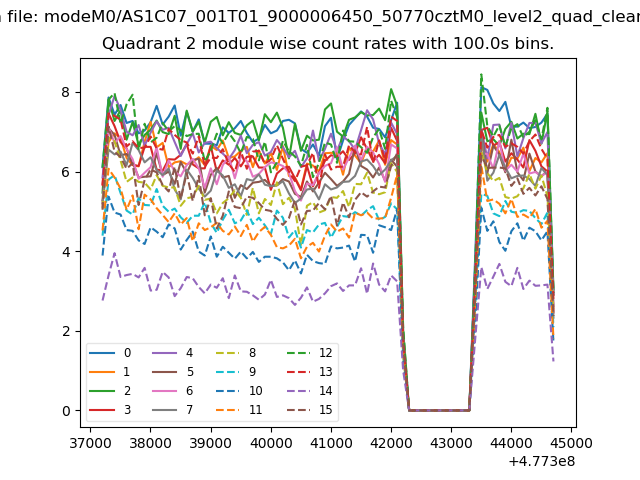
| Module-wise count rates for Quadrant B Data is divided into 100 sec bins |
 |
 |
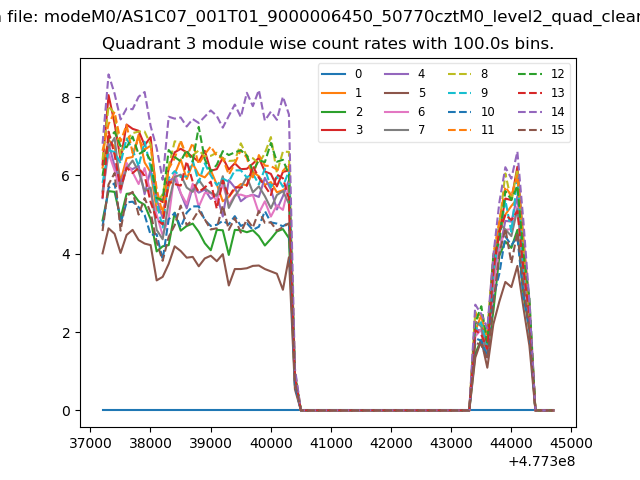
| Module-wise count rates for Quadrant C Data is divided into 100 sec bins |
 |
 |
| Module-wise count rates for Quadrant D Data is divided into 100 sec bins |
 |
 |
| Parameter | Plot |
|---|---|
| CZT HV Monitor | 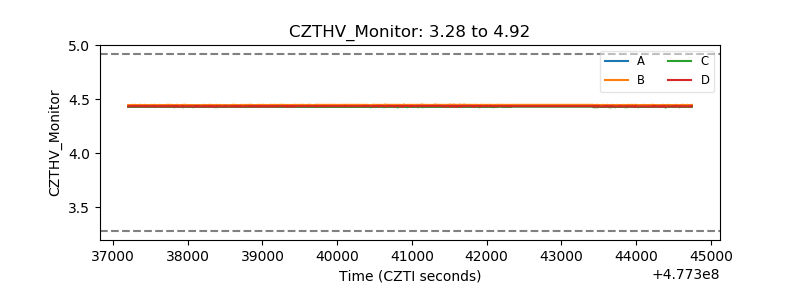 |
| D_VDD | 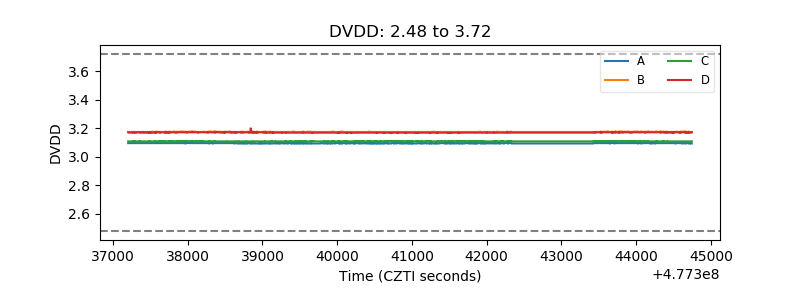 |
| Temperature 1 | 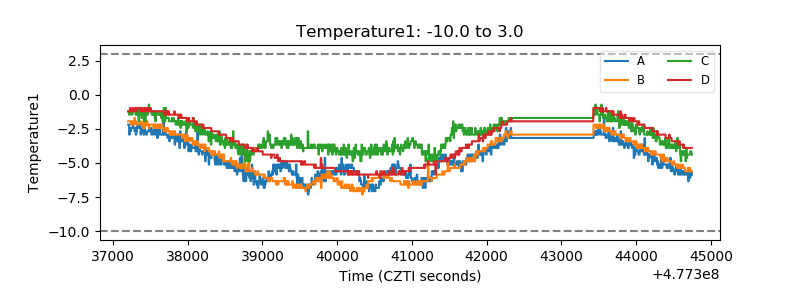 |
| Veto HV Monitor | 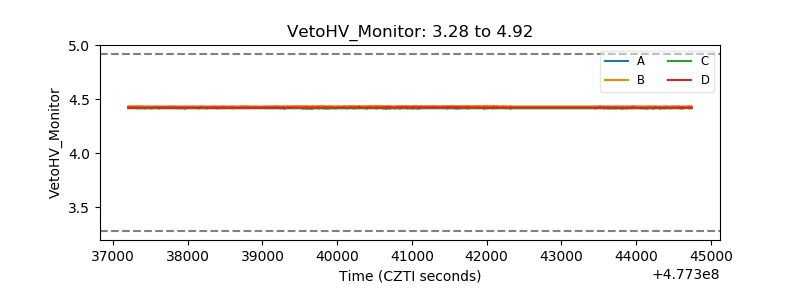 |
| Veto LLD | 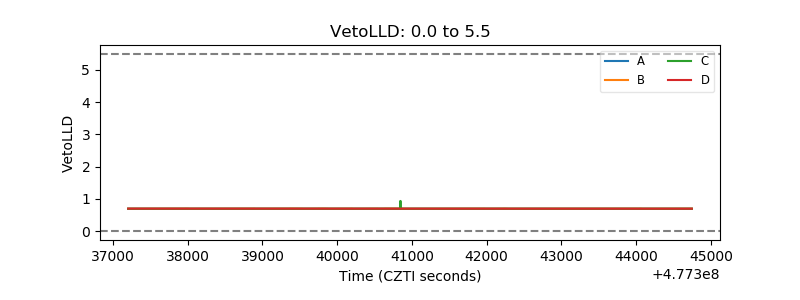 |
| Alpha Counter | 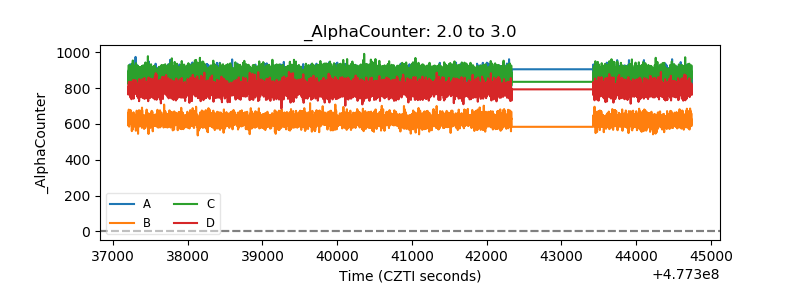 |
| _CPM_Rate | 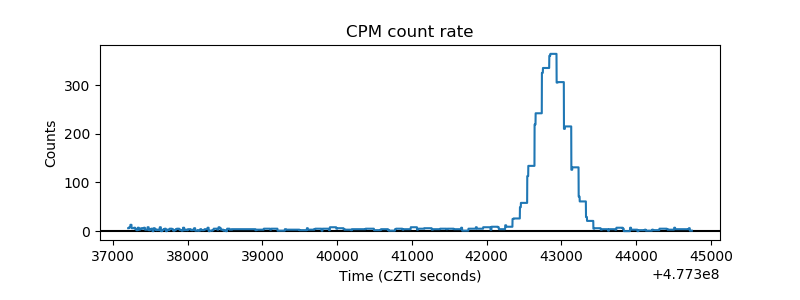 |
| CZT Counter | 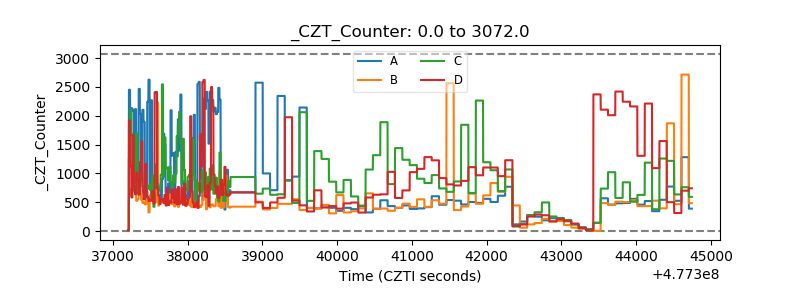 |
| +2.5 Volts monitor | 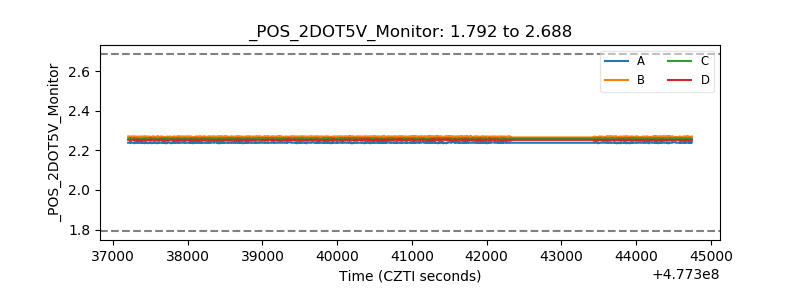 |
| +5 Volts monitor | 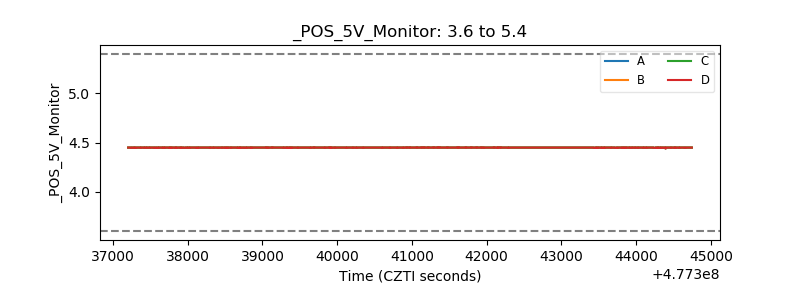 |
| _ROLL_ROT | 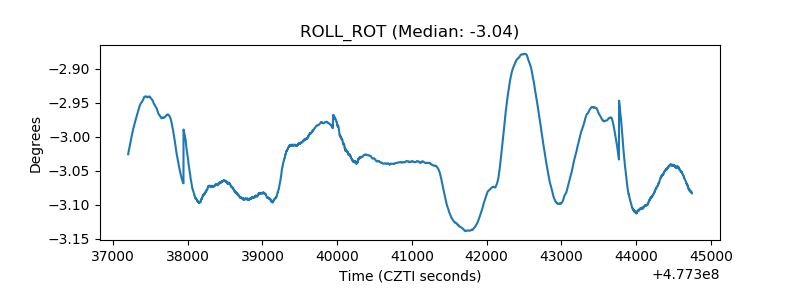 |
| _Roll_DEC | 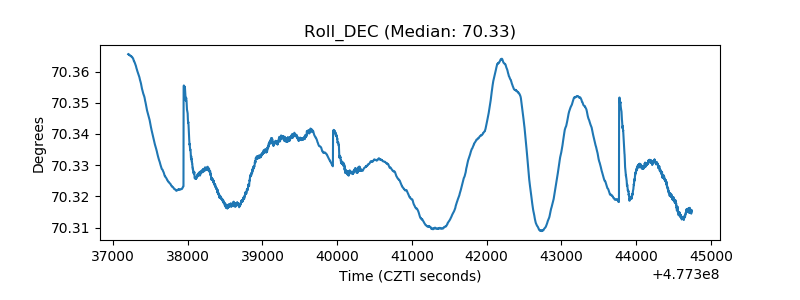 |
| _Roll_RA | 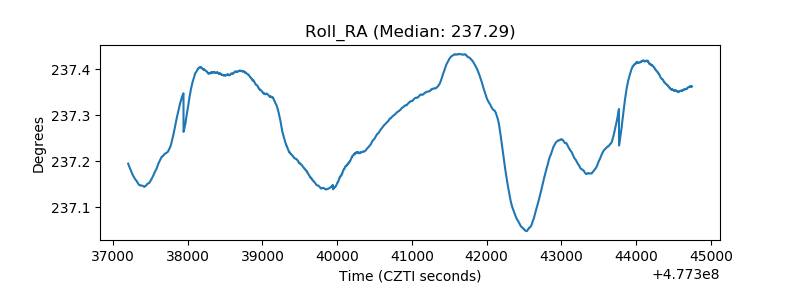 |
| Veto Counter | 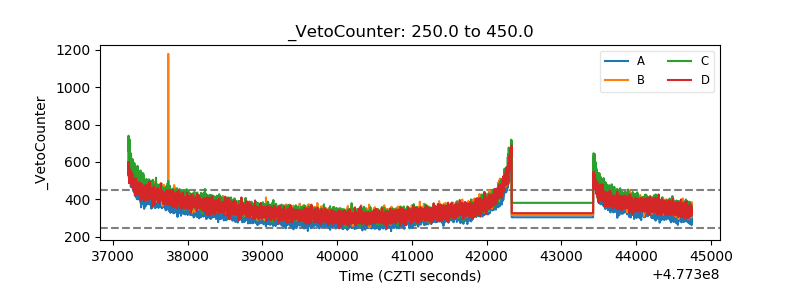 |