| Param | Original file | Final file |
|---|---|---|
| Filename | modeM0/AS1C07_001T01_9000006450_50771cztM0_level2.fits | modeM0/AS1C07_001T01_9000006450_50771cztM0_level2_quad_clean.evt |
| Size (bytes) | 673,868,160 | 90,480,960 |
| Size | 642.7 MB | 86.3 MB |
| Events in quadrant A | 4,737,836 | 617,299 |
| Events in quadrant B | 4,866,474 | 636,995 |
| Events in quadrant C | 5,689,757 | 595,622 |
| Events in quadrant D | 9,131,095 | 421,800 |
| Mode SS | |||
|---|---|---|---|
| Quadrant | BADHDUFLAG | Total packets | Discarded packets |
| A | 0 | 138 | 0 |
| B | 0 | 138 | 0 |
| C | 0 | 138 | 0 |
| D | 0 | 138 | 0 |
| Mode M0 | |||
|---|---|---|---|
| Quadrant | BADHDUFLAG | Total packets | Discarded packets |
| A | 0 | 18607 | 2 |
| B | 0 | 19217 | 2 |
| C | 0 | 21625 | 2 |
| D | 0 | 31806 | 2 |
| Mode M9 | |||
|---|---|---|---|
| Quadrant | BADHDUFLAG | Total packets | Discarded packets |
| A | 0 | 10 | 0 |
| B | 0 | 11 | 0 |
| C | 0 | 11 | 0 |
| D | 0 | 11 | 0 |
| Quadrant | Total seconds | Saturated seconds | Saturation percentage |
|---|---|---|---|
| A | 6705 | 336 | 5.011186% |
| B | 6704 | 624 | 9.307876% |
| C | 6704 | 384 | 5.727924% |
| D | 6704 | 2037 | 30.384845% |
Noise dominated data is calculated using 1-second bins in cleaned event files. If a bin has >2000 counts, and if more than 50% of those come from <1% of pixels, then it is considered to be noise-dominated and hence unusable.
| Quadrant | # 1 sec bins | Bins with >0 counts | Bins with >2000 counts | High rate bins dominated by noise | Noise dominated (total time) | Noise dominated (detector-on time) | Marked lightcurve |
|---|---|---|---|---|---|---|---|
| A | 7630 | 6706 | 234 | 234 | 3.07% | 3.49% | 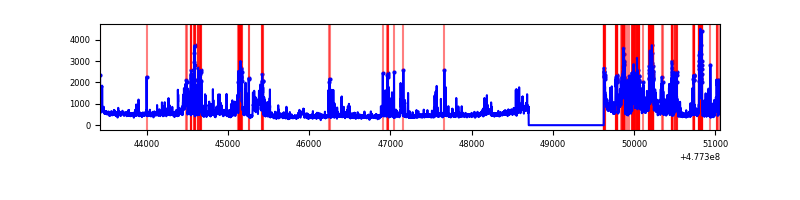 |
| B | 7629 | 6705 | 369 | 369 | 4.84% | 5.50% | 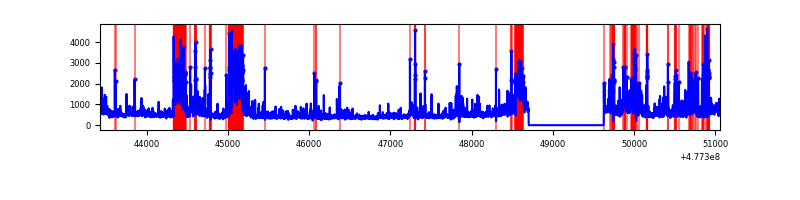 |
| C | 7629 | 6705 | 219 | 219 | 2.87% | 3.27% | 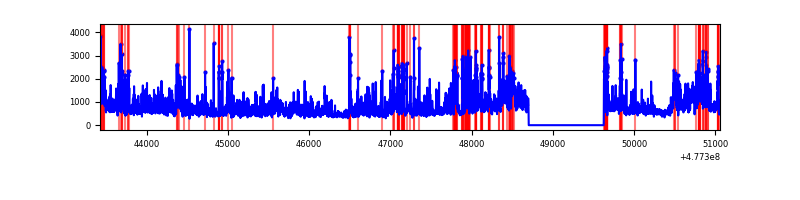 |
| D | 7629 | 6705 | 1106 | 1106 | 14.50% | 16.50% | 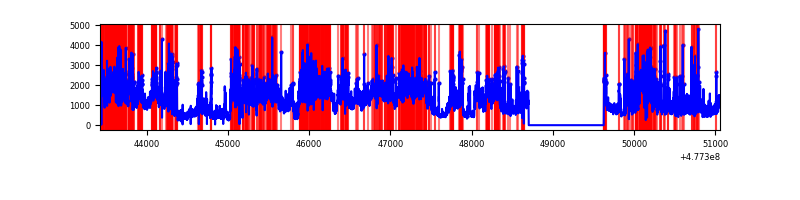 |
Top three noisy pixels from each quadrant. If the there are fewer than three noisy pixels in the level2.evt file, extra rows are filled as -1
| Pixel properties | Quadrant properties | ||||||
|---|---|---|---|---|---|---|---|
| Quadrant | DetID | PixID | Counts | Sigma | Mean | Median | Sigma |
| A | 12 | 80 | 360685 | 2033.07 | 704 | 685 | 177.1 |
| A | 4 | 249 | 294440 | 1658.96 | 704 | 685 | 177.1 |
| A | 6 | 161 | 254401 | 1432.84 | 704 | 685 | 177.1 |
| B | 0 | 229 | 456412 | 3123.48 | 683 | 659 | 145.9 |
| B | 5 | 185 | 397733 | 2721.33 | 683 | 659 | 145.9 |
| B | 4 | 206 | 355325 | 2430.69 | 683 | 659 | 145.9 |
| C | 5 | 10 | 1977541 | 10302.03 | 692 | 682 | 191.9 |
| C | 13 | 3 | 131213 | 680.24 | 692 | 682 | 191.9 |
| C | 15 | 174 | 103716 | 536.94 | 692 | 682 | 191.9 |
| D | 8 | 242 | 2106903 | 12989.58 | 575 | 555 | 162.2 |
| D | 8 | 241 | 611744 | 3769.12 | 575 | 555 | 162.2 |
| D | 8 | 226 | 483448 | 2977.94 | 575 | 555 | 162.2 |
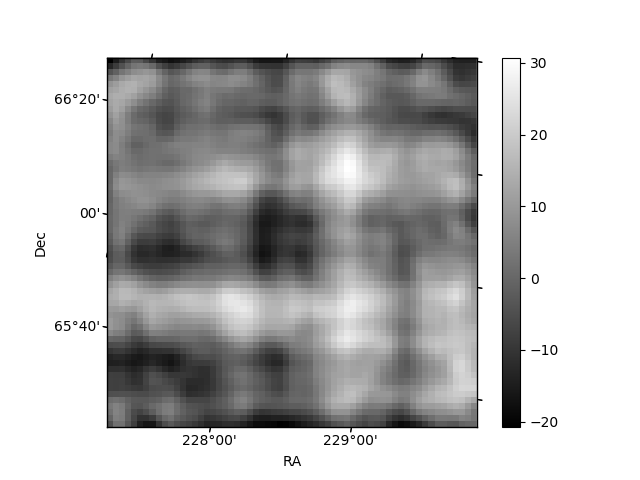
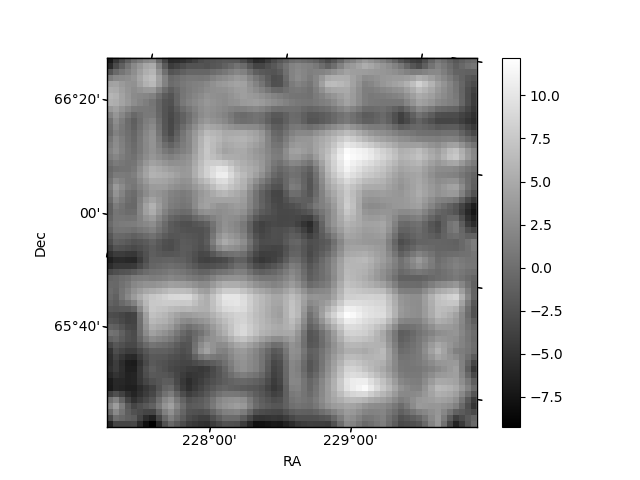
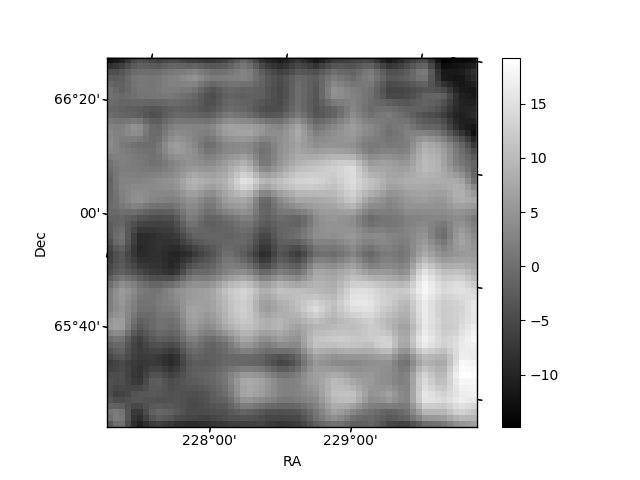
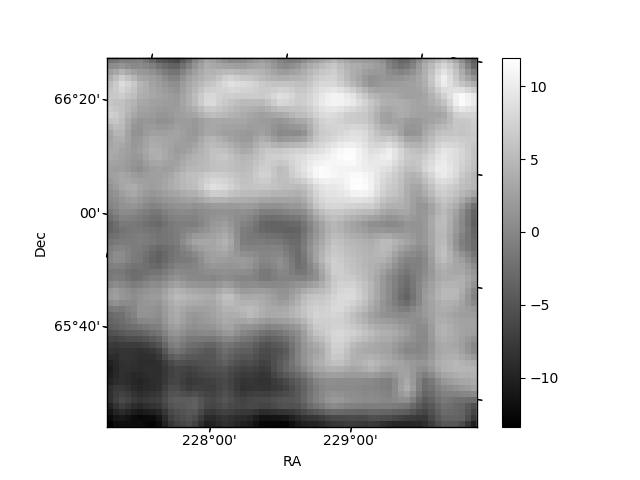
Histogram calculated using DETX and DETY for each event in the final _common_clean file
| Quadrant A | 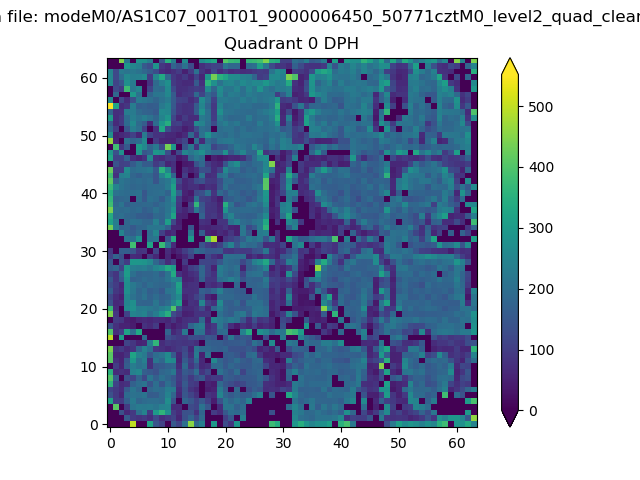 |
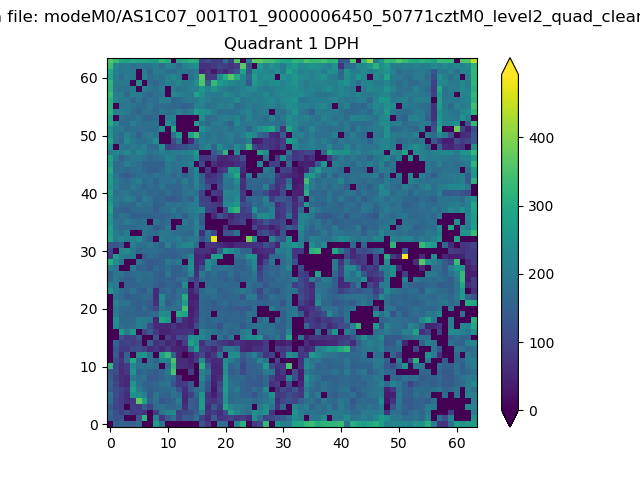 |
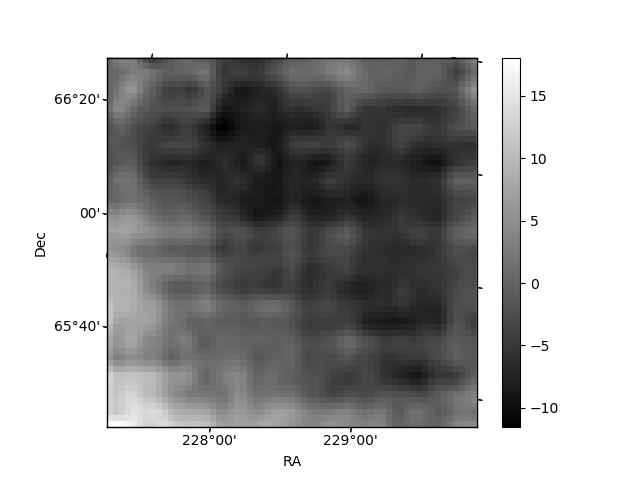
Quadrant B |
|---|---|---|---|
| Quadrant D | 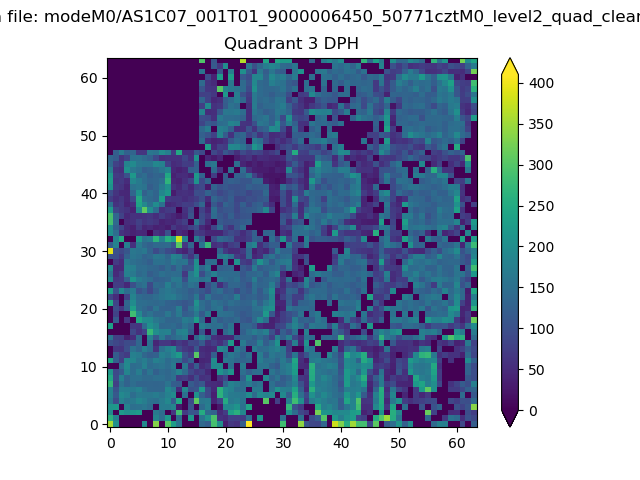 |
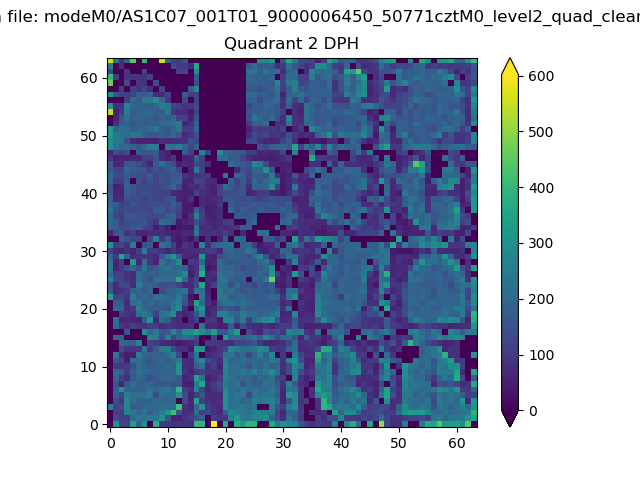 |
Quadrant C |
| Plot type | Count rate plots | Images |
|---|---|---|
| Comparison with Poisson distribution Blue bars denote a histogram of data divided into 1 sec bins. Red curve is a Poisson curve with rate = median count rate of data. |
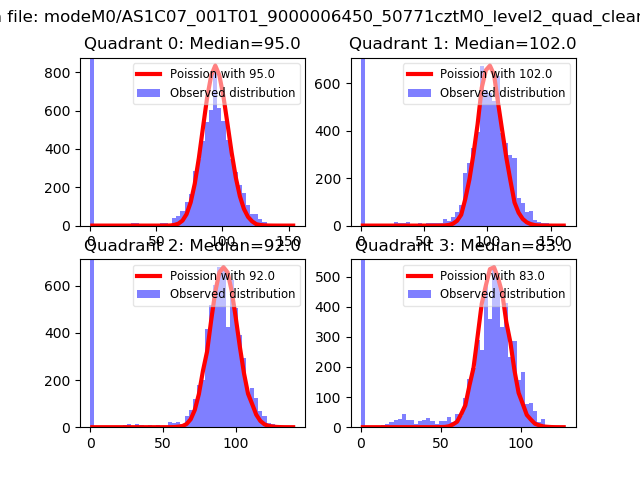 |
 |
| Quadrant-wise count rates Data is divided into 100 sec bins |
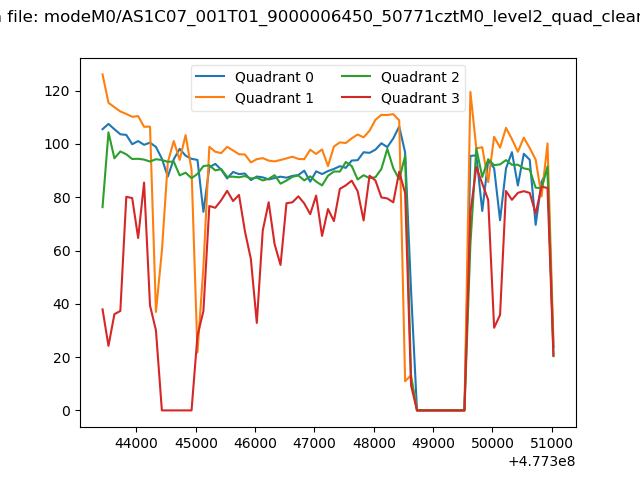 |
|
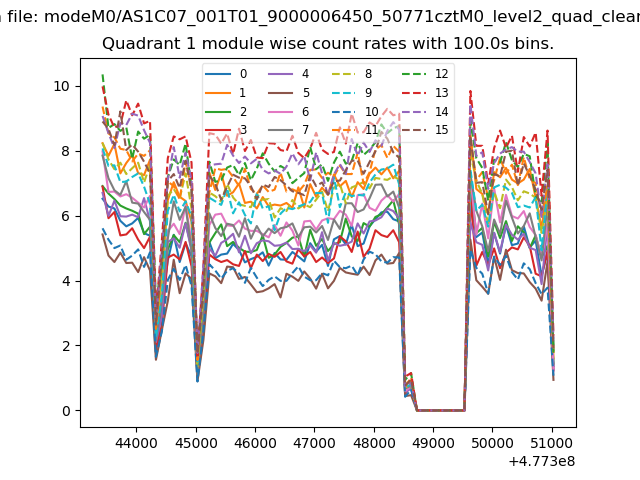
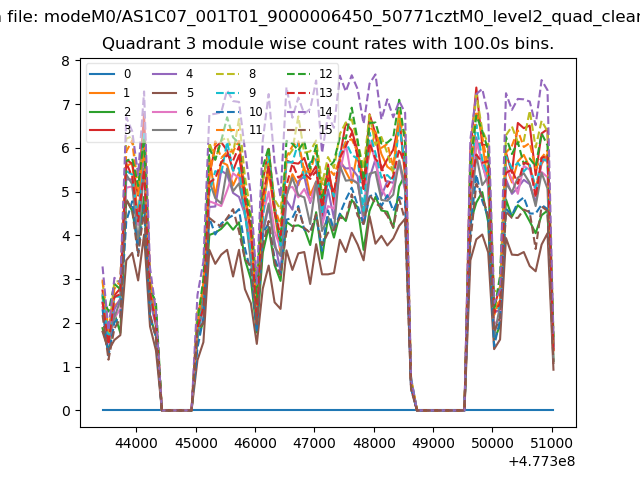
| Module-wise count rates for Quadrant A Data is divided into 100 sec bins |
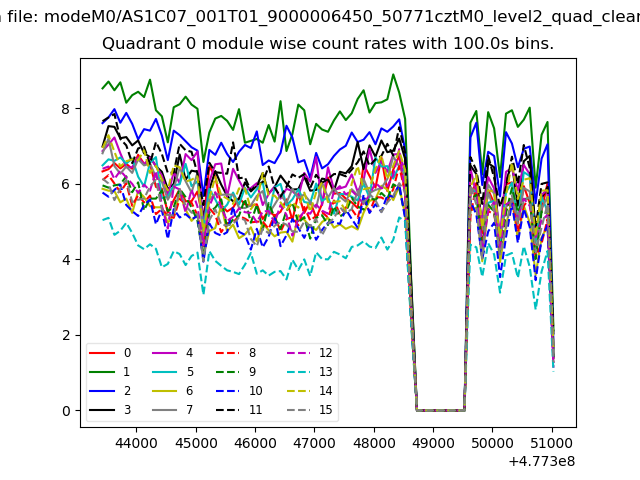 |
 |
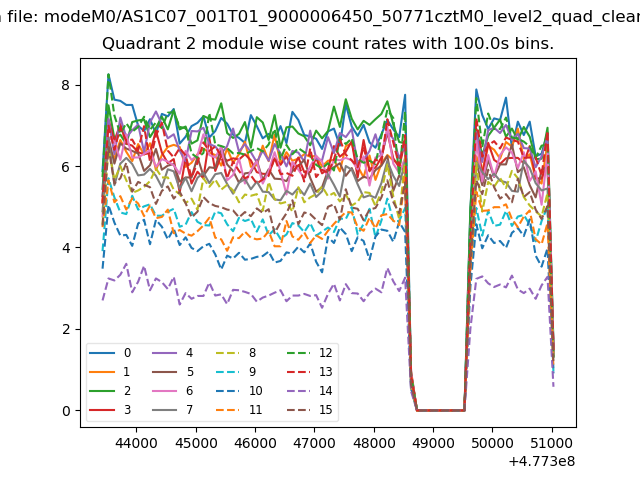
| Module-wise count rates for Quadrant B Data is divided into 100 sec bins |
 |
 |
| Module-wise count rates for Quadrant C Data is divided into 100 sec bins |
 |
 |
| Module-wise count rates for Quadrant D Data is divided into 100 sec bins |
 |
 |
| Parameter | Plot |
|---|---|
| CZT HV Monitor | 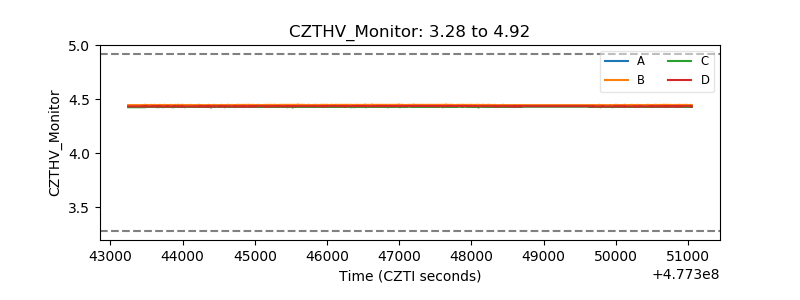 |
| D_VDD | 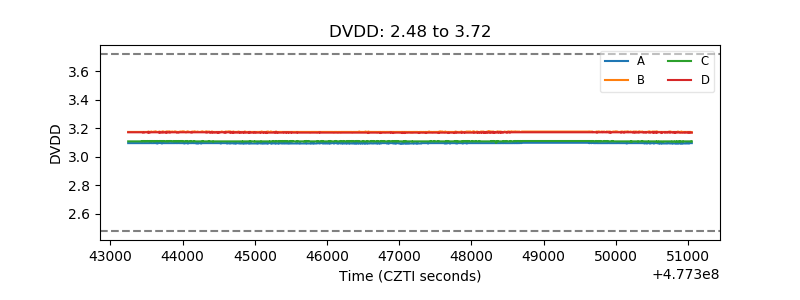 |
| Temperature 1 | 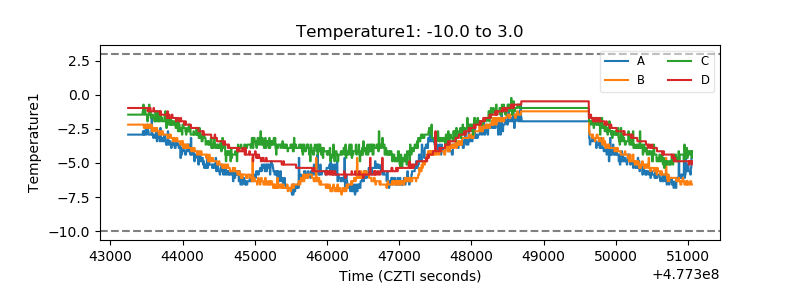 |
| Veto HV Monitor | 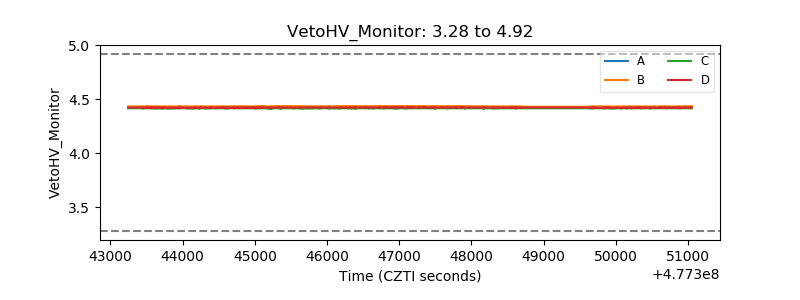 |
| Veto LLD | 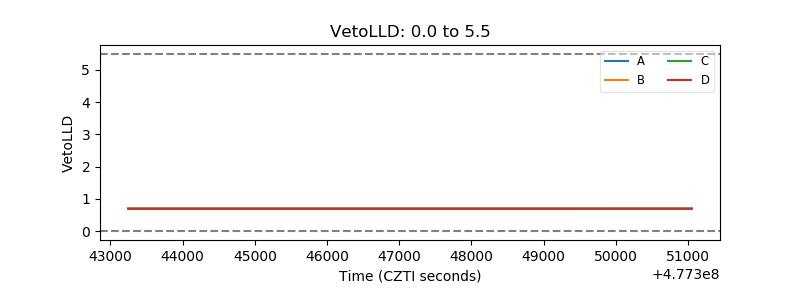 |
| Alpha Counter | 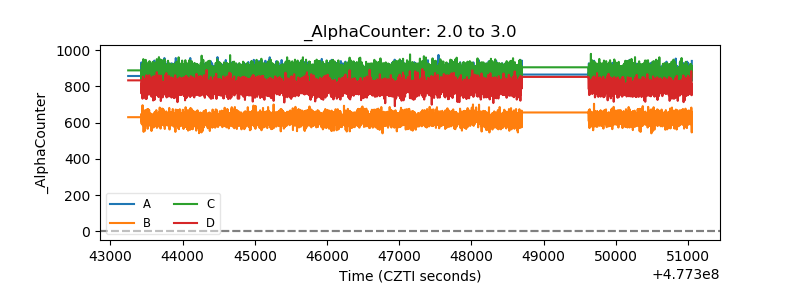 |
| _CPM_Rate | 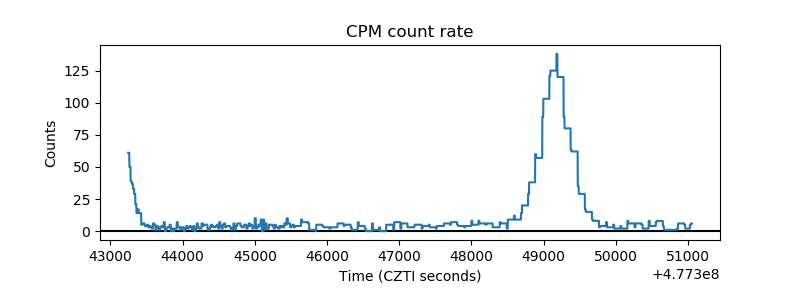 |
| CZT Counter | 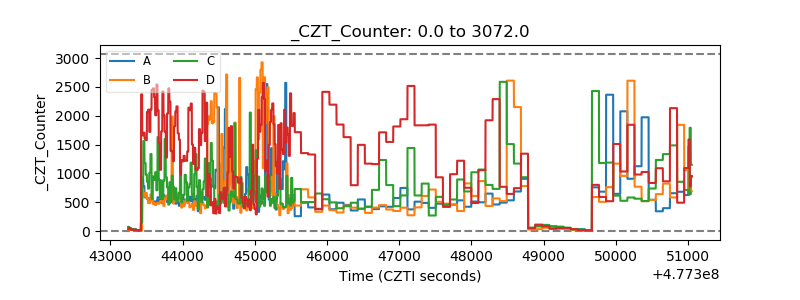 |
| +2.5 Volts monitor | 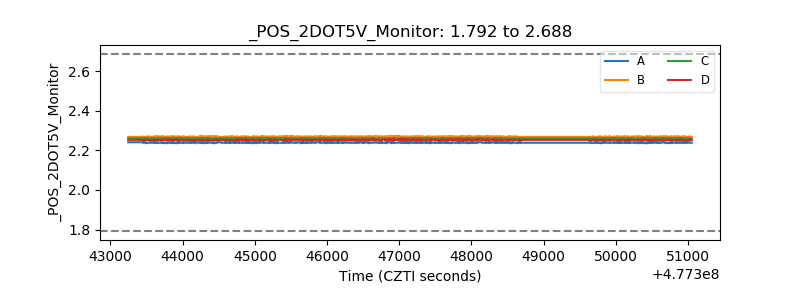 |
| +5 Volts monitor |  |
| _ROLL_ROT | 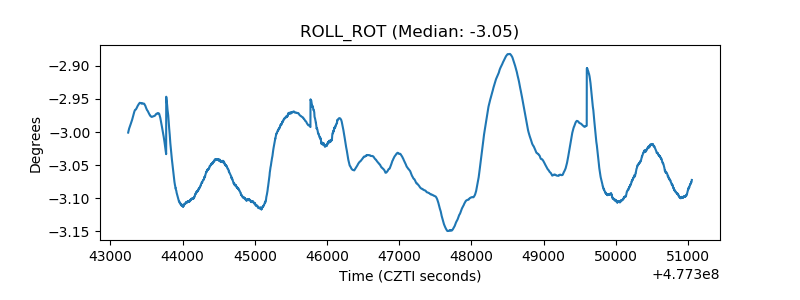 |
| _Roll_DEC | 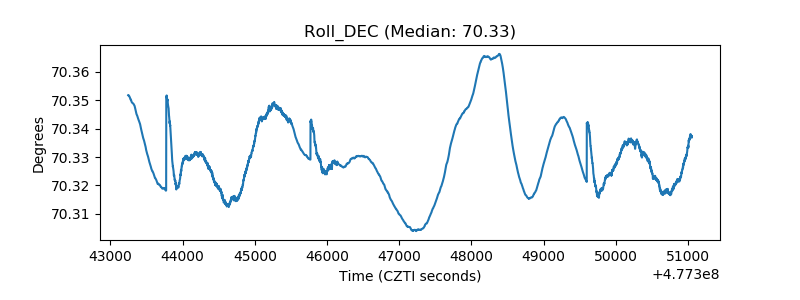 |
| _Roll_RA | 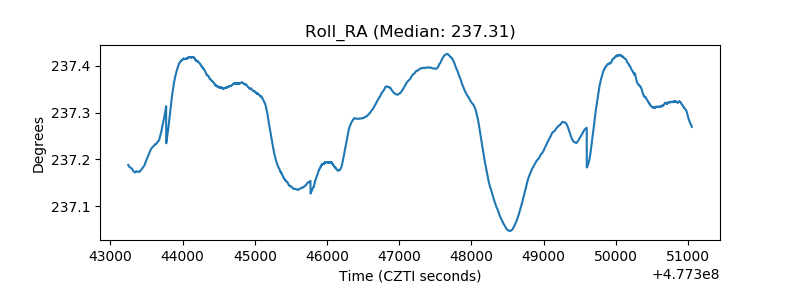 |
| Veto Counter | 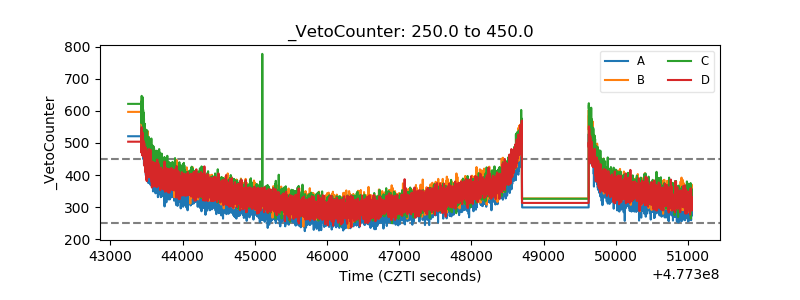 |