| Param | Original file | Final file |
|---|---|---|
| Filename | modeM0/AS1C07_001T01_9000006450_50772cztM0_level2.fits | modeM0/AS1C07_001T01_9000006450_50772cztM0_level2_quad_clean.evt |
| Size (bytes) | 723,473,280 | 98,697,600 |
| Size | 690.0 MB | 94.1 MB |
| Events in quadrant A | 5,645,031 | 648,569 |
| Events in quadrant B | 4,793,491 | 717,918 |
| Events in quadrant C | 6,180,699 | 615,835 |
| Events in quadrant D | 9,607,258 | 506,408 |
| Mode SS | |||
|---|---|---|---|
| Quadrant | BADHDUFLAG | Total packets | Discarded packets |
| A | 0 | 148 | 0 |
| B | 0 | 148 | 0 |
| C | 0 | 148 | 0 |
| D | 0 | 148 | 0 |
| Mode M0 | |||
|---|---|---|---|
| Quadrant | BADHDUFLAG | Total packets | Discarded packets |
| A | 0 | 21680 | 2 |
| B | 0 | 19330 | 3 |
| C | 0 | 23289 | 2 |
| D | 0 | 33548 | 2 |
| Mode M9 | |||
|---|---|---|---|
| Quadrant | BADHDUFLAG | Total packets | Discarded packets |
| A | 0 | 11 | 0 |
| B | 0 | 11 | 0 |
| C | 0 | 12 | 0 |
| D | 0 | 12 | 0 |
| Quadrant | Total seconds | Saturated seconds | Saturation percentage |
|---|---|---|---|
| A | 7173 | 352 | 4.907291% |
| B | 7172 | 297 | 4.141104% |
| C | 7172 | 513 | 7.152817% |
| D | 7172 | 1314 | 18.321249% |
Noise dominated data is calculated using 1-second bins in cleaned event files. If a bin has >2000 counts, and if more than 50% of those come from <1% of pixels, then it is considered to be noise-dominated and hence unusable.
| Quadrant | # 1 sec bins | Bins with >0 counts | Bins with >2000 counts | High rate bins dominated by noise | Noise dominated (total time) | Noise dominated (detector-on time) | Marked lightcurve |
|---|---|---|---|---|---|---|---|
| A | 7728 | 7175 | 271 | 271 | 3.51% | 3.78% | 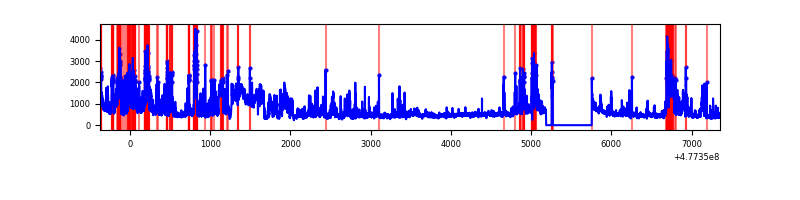 |
| B | 7727 | 7174 | 153 | 153 | 1.98% | 2.13% | 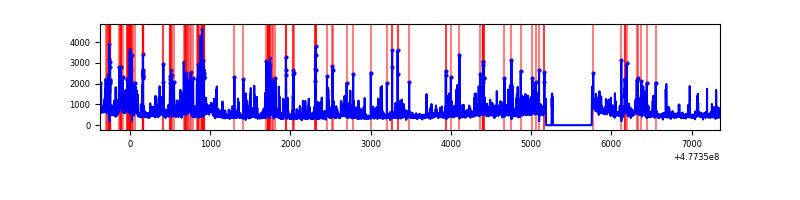 |
| C | 7727 | 7174 | 399 | 399 | 5.16% | 5.56% | 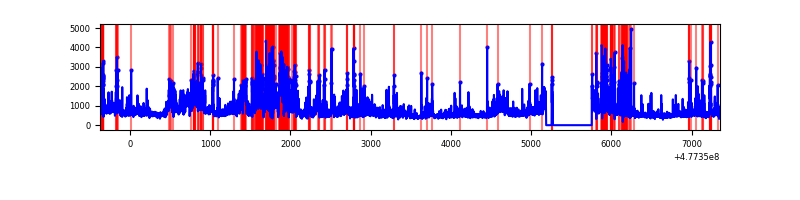 |
| D | 7727 | 7173 | 1089 | 1089 | 14.09% | 15.18% | 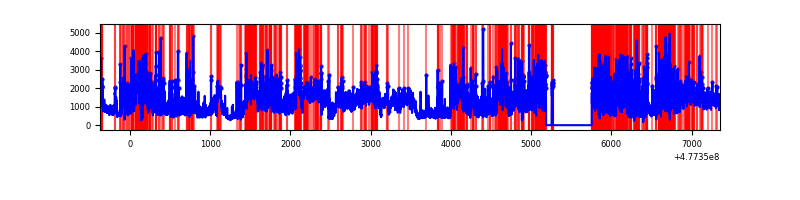 |
Top three noisy pixels from each quadrant. If the there are fewer than three noisy pixels in the level2.evt file, extra rows are filled as -1
| Pixel properties | Quadrant properties | ||||||
|---|---|---|---|---|---|---|---|
| Quadrant | DetID | PixID | Counts | Sigma | Mean | Median | Sigma |
| A | 12 | 80 | 1348180 | 7120.91 | 742 | 723 | 189.2 |
| A | 6 | 161 | 196645 | 1035.39 | 742 | 723 | 189.2 |
| A | 8 | 38 | 155918 | 820.16 | 742 | 723 | 189.2 |
| B | 4 | 206 | 843726 | 5376.22 | 744 | 717 | 156.8 |
| B | 6 | 255 | 207910 | 1321.36 | 744 | 717 | 156.8 |
| B | 6 | 51 | 112547 | 713.19 | 744 | 717 | 156.8 |
| C | 5 | 10 | 2007386 | 10017.9 | 722 | 718 | 200.3 |
| C | 13 | 3 | 312920 | 1558.61 | 722 | 718 | 200.3 |
| C | 4 | 5 | 192439 | 957.13 | 722 | 718 | 200.3 |
| D | 8 | 242 | 2230022 | 11882.11 | 663 | 638 | 187.6 |
| D | 2 | 216 | 1430539 | 7621.05 | 663 | 638 | 187.6 |
| D | 8 | 241 | 610753 | 3251.77 | 663 | 638 | 187.6 |
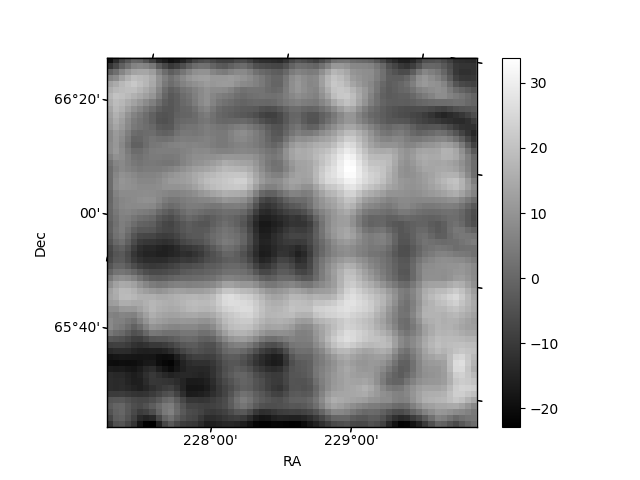
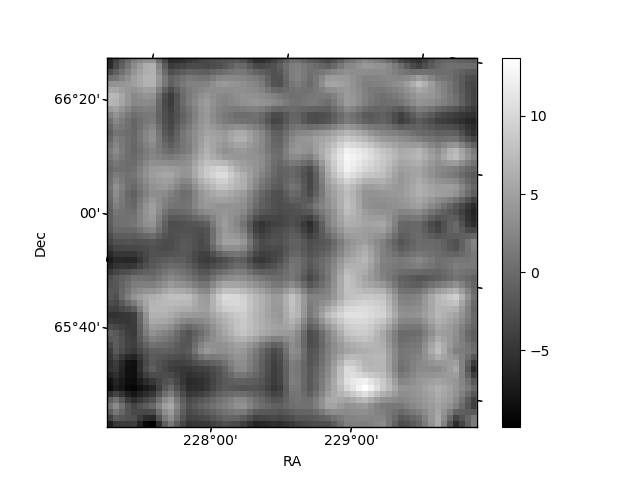
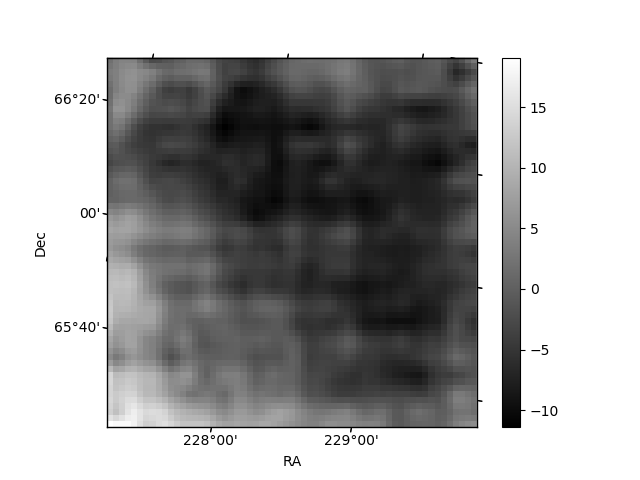
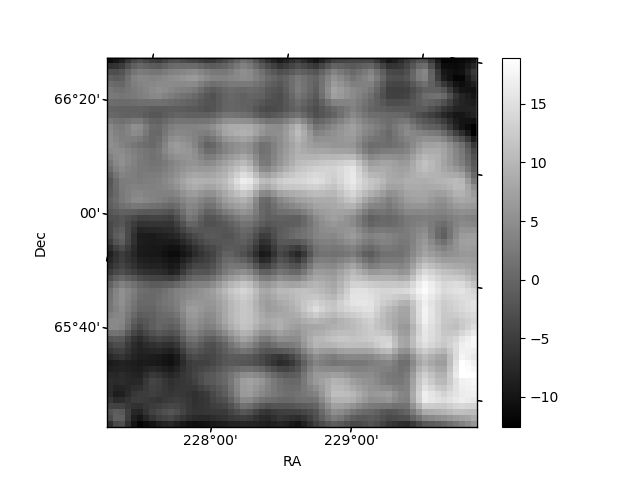
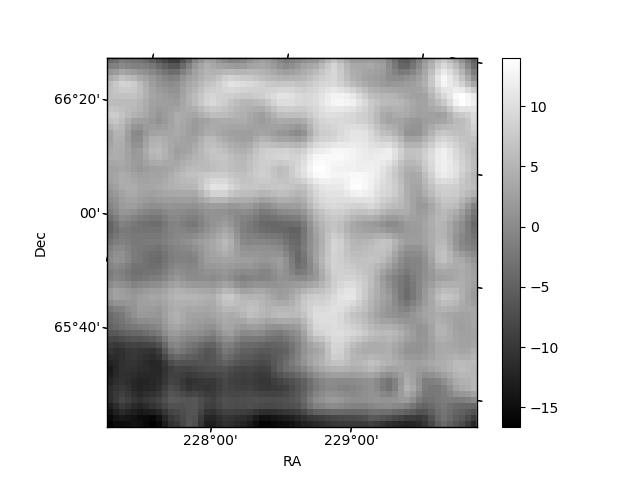
Histogram calculated using DETX and DETY for each event in the final _common_clean file
| Quadrant A | 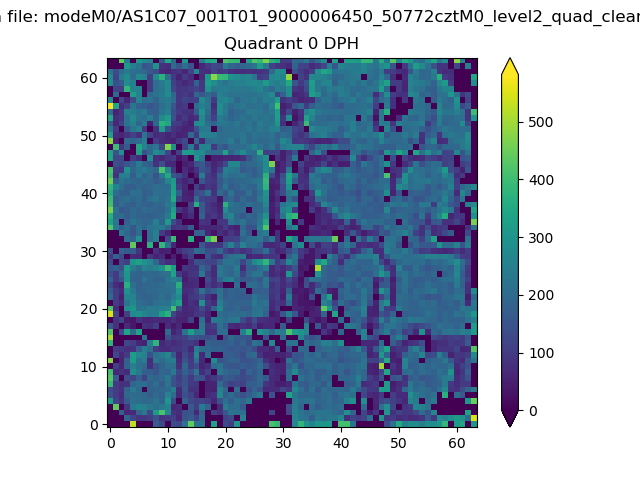 |
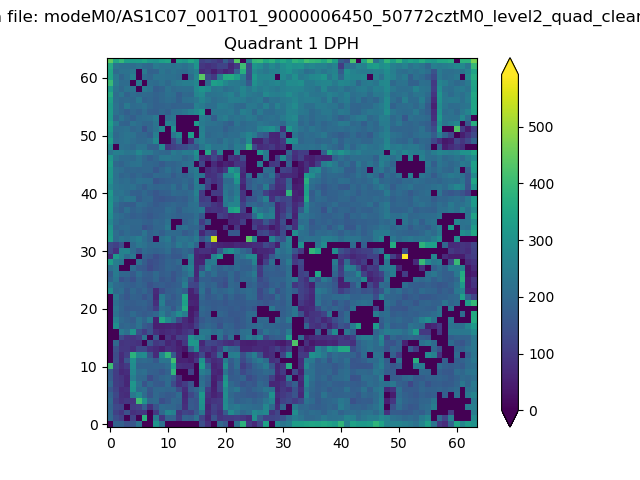 |
Quadrant B |
|---|---|---|---|
| Quadrant D | 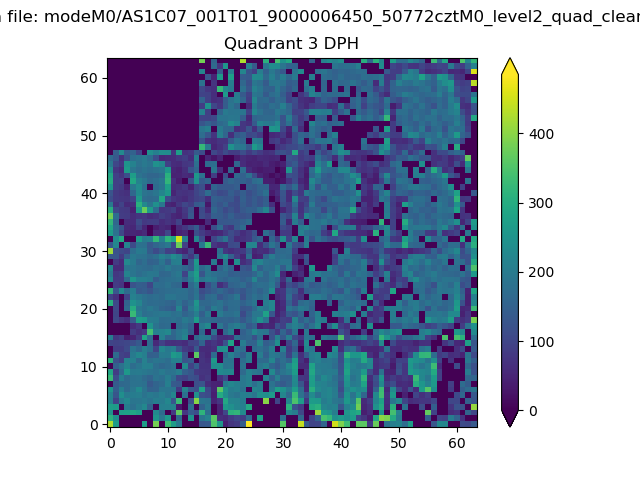 |
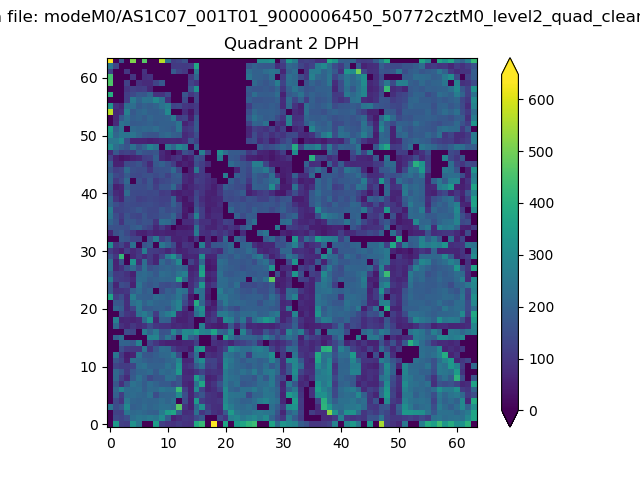 |
Quadrant C |
| Plot type | Count rate plots | Images |
|---|---|---|
| Comparison with Poisson distribution Blue bars denote a histogram of data divided into 1 sec bins. Red curve is a Poisson curve with rate = median count rate of data. |
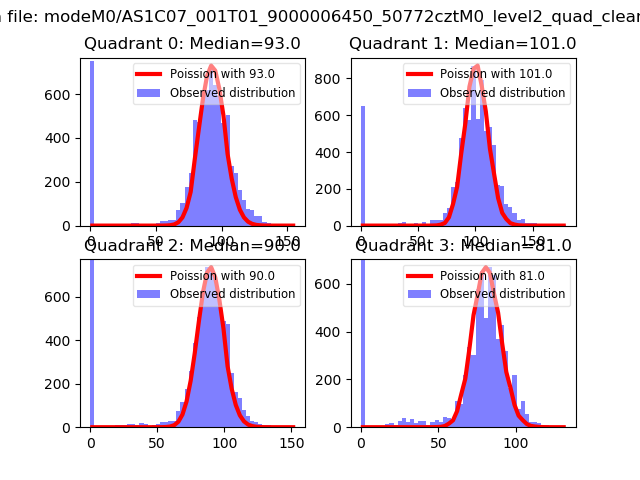 |
 |
| Quadrant-wise count rates Data is divided into 100 sec bins |
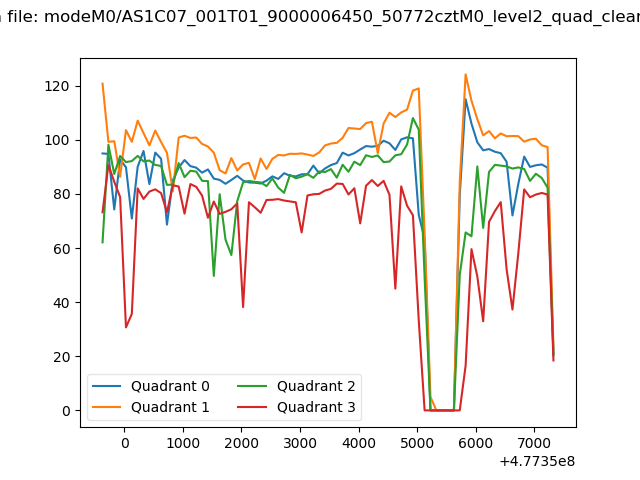 |
|
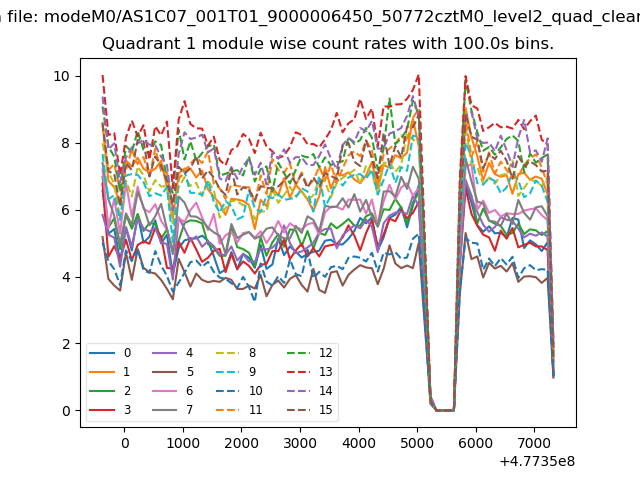
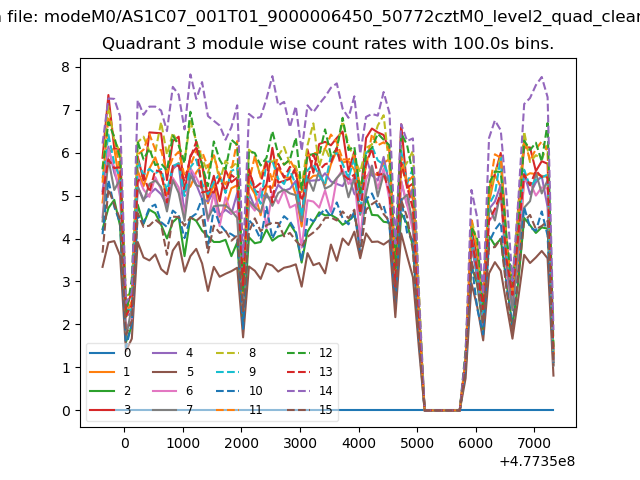
| Module-wise count rates for Quadrant A Data is divided into 100 sec bins |
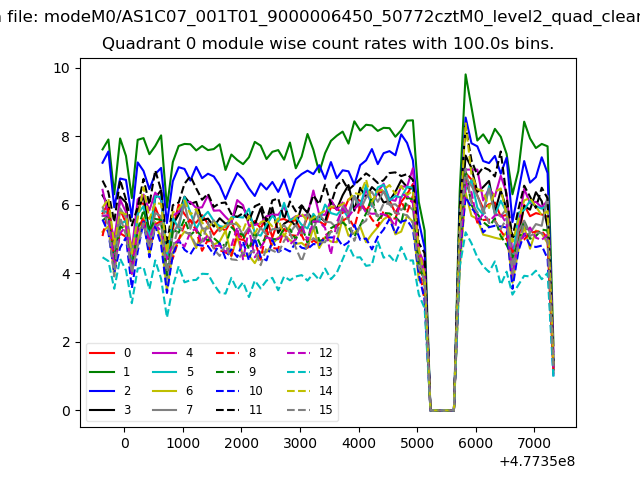 |
 |
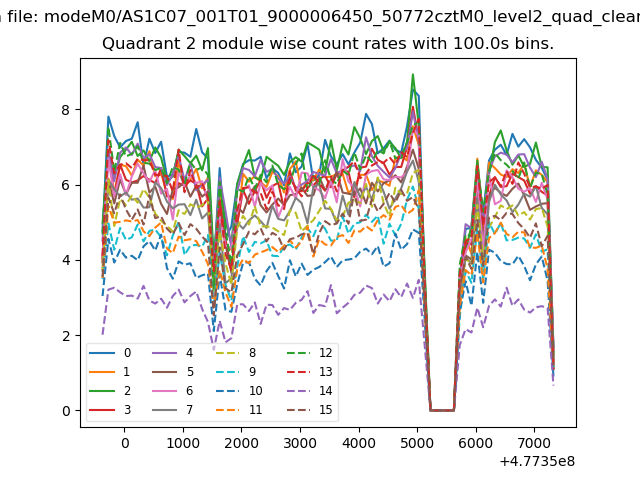
| Module-wise count rates for Quadrant B Data is divided into 100 sec bins |
 |
 |
| Module-wise count rates for Quadrant C Data is divided into 100 sec bins |
 |
 |
| Module-wise count rates for Quadrant D Data is divided into 100 sec bins |
 |
 |
| Parameter | Plot |
|---|---|
| CZT HV Monitor | 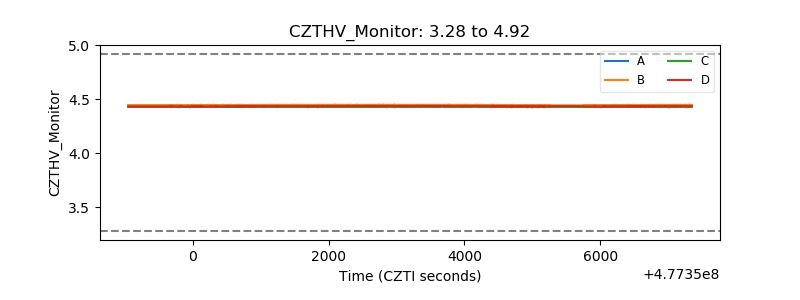 |
| D_VDD | 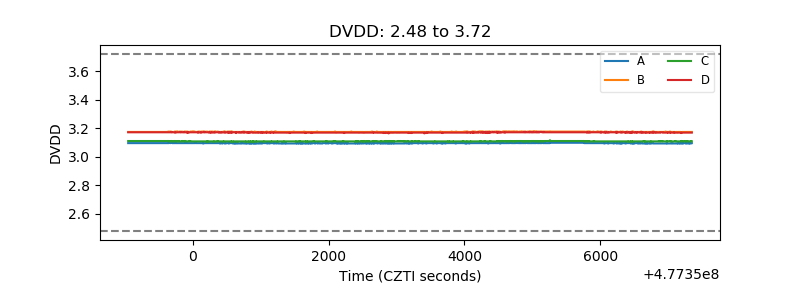 |
| Temperature 1 | 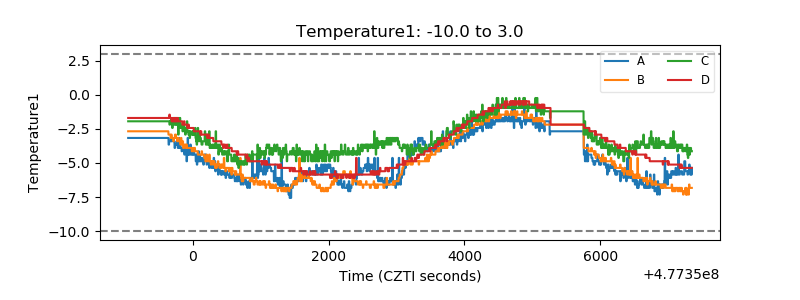 |
| Veto HV Monitor | 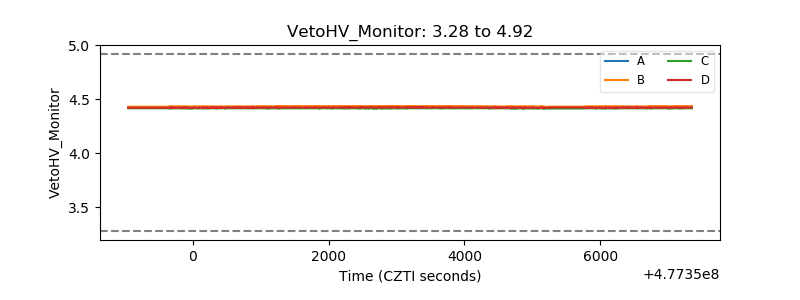 |
| Veto LLD | 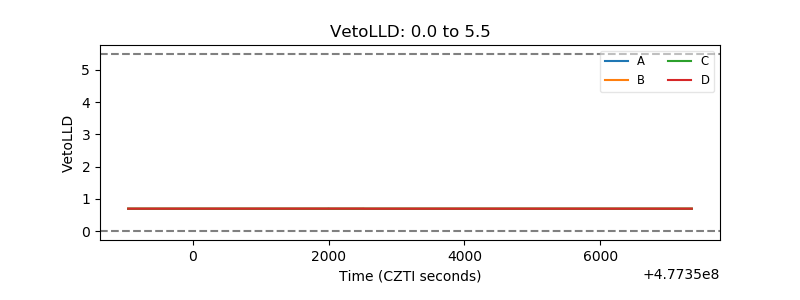 |
| Alpha Counter | 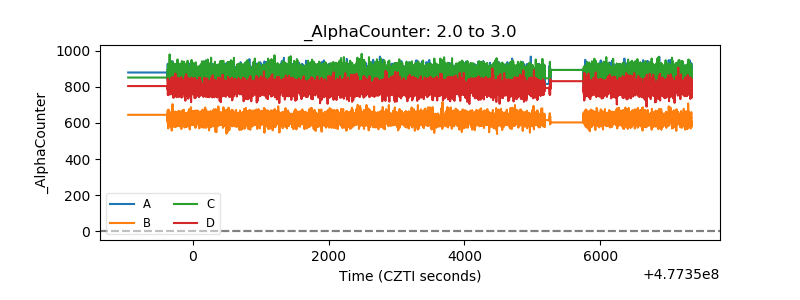 |
| _CPM_Rate | 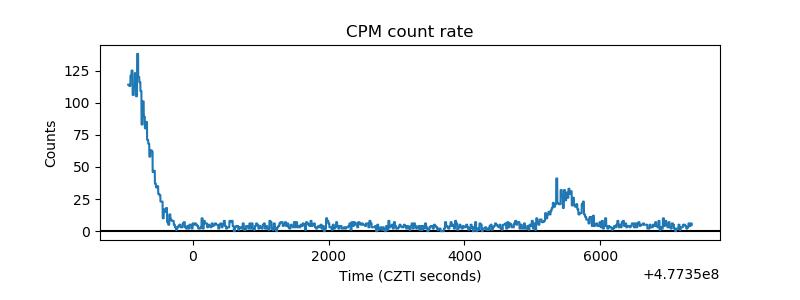 |
| CZT Counter | 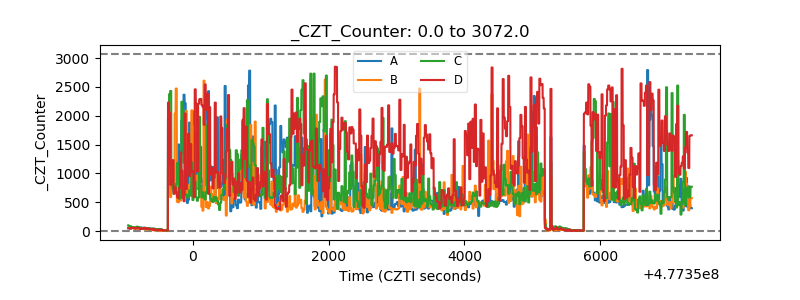 |
| +2.5 Volts monitor | 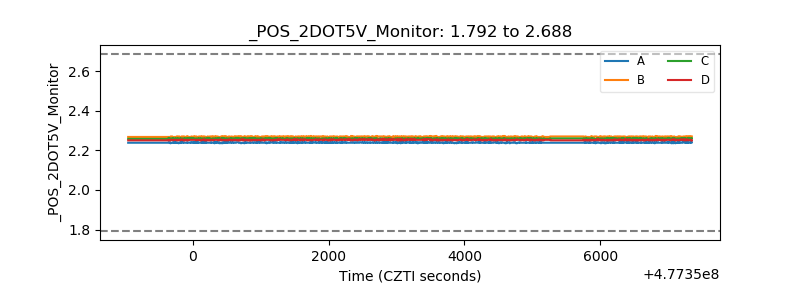 |
| +5 Volts monitor | 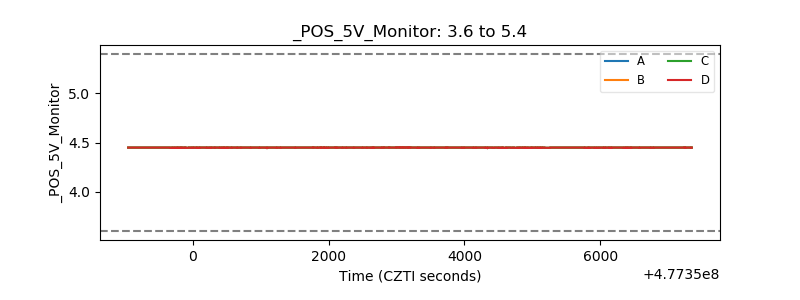 |
| _ROLL_ROT | 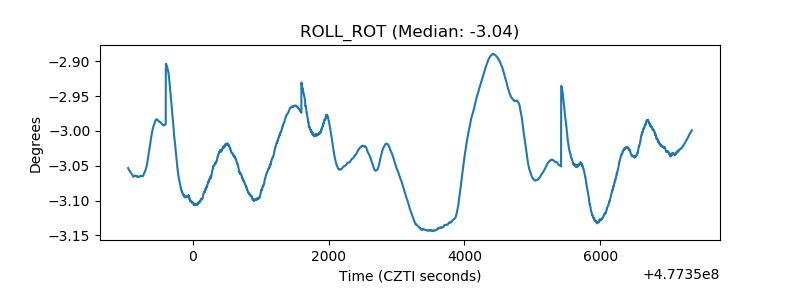 |
| _Roll_DEC | 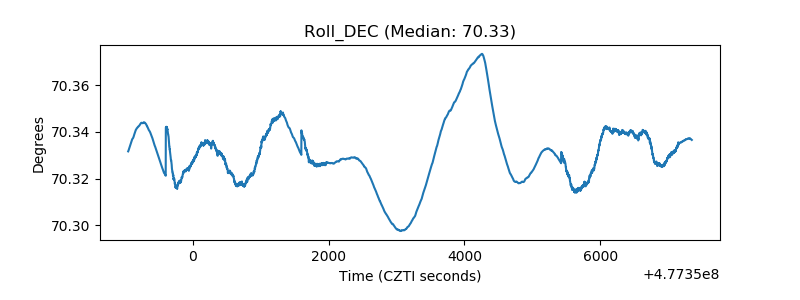 |
| _Roll_RA | 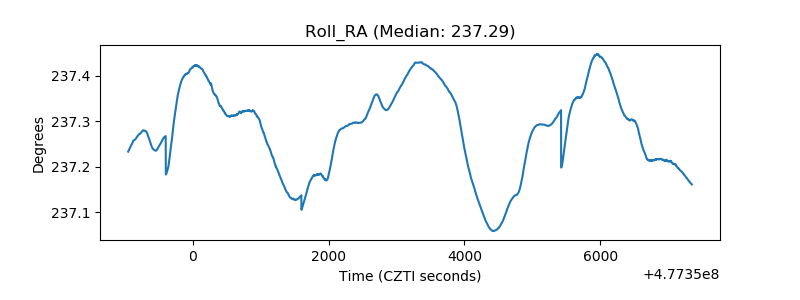 |
| Veto Counter | 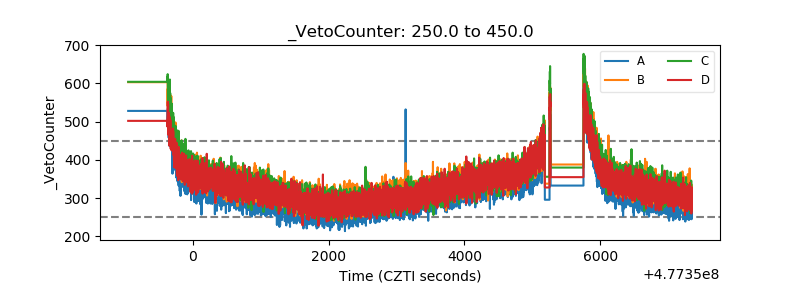 |