| Param | Original file | Final file |
|---|---|---|
| Filename | modeM0/AS1C07_001T01_9000006450_50773cztM0_level2.fits | modeM0/AS1C07_001T01_9000006450_50773cztM0_level2_quad_clean.evt |
| Size (bytes) | 760,703,040 | 103,985,280 |
| Size | 725.5 MB | 99.2 MB |
| Events in quadrant A | 5,720,562 | 689,521 |
| Events in quadrant B | 4,278,015 | 774,718 |
| Events in quadrant C | 7,380,394 | 615,381 |
| Events in quadrant D | 10,189,582 | 537,400 |
| Mode SS | |||
|---|---|---|---|
| Quadrant | BADHDUFLAG | Total packets | Discarded packets |
| A | 0 | 154 | 0 |
| B | 0 | 154 | 0 |
| C | 0 | 154 | 0 |
| D | 0 | 154 | 0 |
| Mode M0 | |||
|---|---|---|---|
| Quadrant | BADHDUFLAG | Total packets | Discarded packets |
| A | 0 | 22529 | 6 |
| B | 0 | 18388 | 0 |
| C | 0 | 27136 | 0 |
| D | 0 | 35685 | 0 |
| Quadrant | Total seconds | Saturated seconds | Saturation percentage |
|---|---|---|---|
| A | 7629 | 409 | 5.361122% |
| B | 7632 | 115 | 1.506813% |
| C | 7632 | 1096 | 14.360587% |
| D | 7632 | 1623 | 21.265723% |
Noise dominated data is calculated using 1-second bins in cleaned event files. If a bin has >2000 counts, and if more than 50% of those come from <1% of pixels, then it is considered to be noise-dominated and hence unusable.
| Quadrant | # 1 sec bins | Bins with >0 counts | Bins with >2000 counts | High rate bins dominated by noise | Noise dominated (total time) | Noise dominated (detector-on time) | Marked lightcurve |
|---|---|---|---|---|---|---|---|
| A | 7631 | 7630 | 225 | 225 | 2.95% | 2.95% | 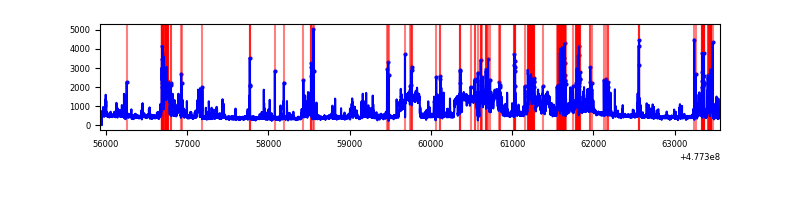 |
| B | 7632 | 7632 | 53 | 53 | 0.69% | 0.69% | 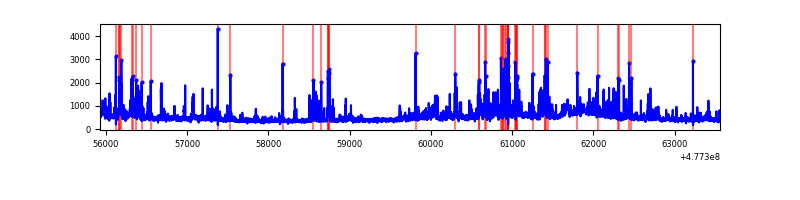 |
| C | 7632 | 7632 | 753 | 753 | 9.87% | 9.87% | 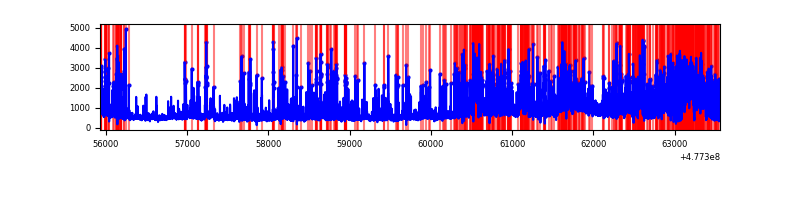 |
| D | 7632 | 7632 | 1239 | 1239 | 16.23% | 16.23% | 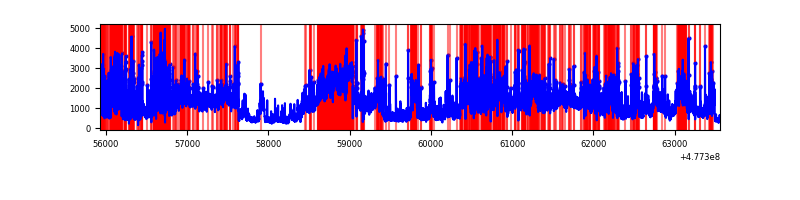 |
Top three noisy pixels from each quadrant. If the there are fewer than three noisy pixels in the level2.evt file, extra rows are filled as -1
| Pixel properties | Quadrant properties | ||||||
|---|---|---|---|---|---|---|---|
| Quadrant | DetID | PixID | Counts | Sigma | Mean | Median | Sigma |
| A | 12 | 80 | 1159876 | 5961.74 | 788 | 771 | 194.4 |
| A | 3 | 46 | 232509 | 1191.92 | 788 | 771 | 194.4 |
| A | 14 | 254 | 148200 | 758.29 | 788 | 771 | 194.4 |
| B | 4 | 206 | 395067 | 2314.85 | 806 | 778 | 170.3 |
| B | 0 | 229 | 111780 | 651.69 | 806 | 778 | 170.3 |
| B | 8 | 128 | 95725 | 557.43 | 806 | 778 | 170.3 |
| C | 4 | 5 | 1593141 | 7657.48 | 751 | 746 | 208.0 |
| C | 9 | 38 | 706307 | 3392.89 | 751 | 746 | 208.0 |
| C | 5 | 10 | 473819 | 2274.91 | 751 | 746 | 208.0 |
| D | 8 | 242 | 2449466 | 12142.5 | 724 | 699 | 201.7 |
| D | 2 | 216 | 1196408 | 5929.07 | 724 | 699 | 201.7 |
| D | 8 | 241 | 726082 | 3596.9 | 724 | 699 | 201.7 |
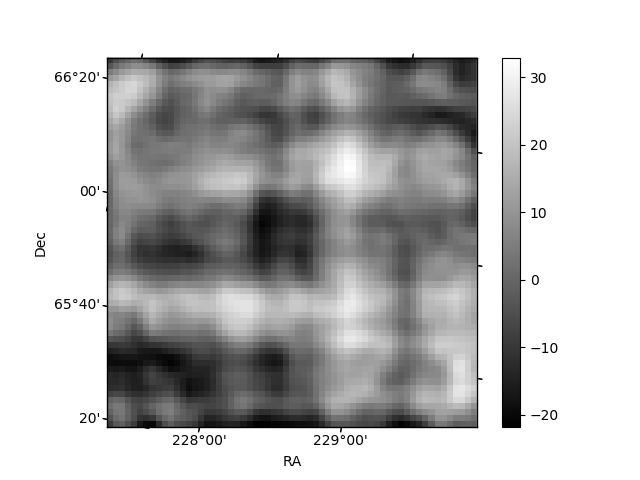
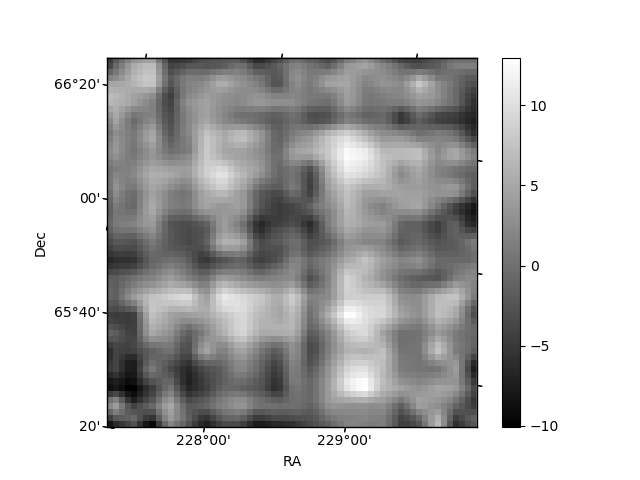
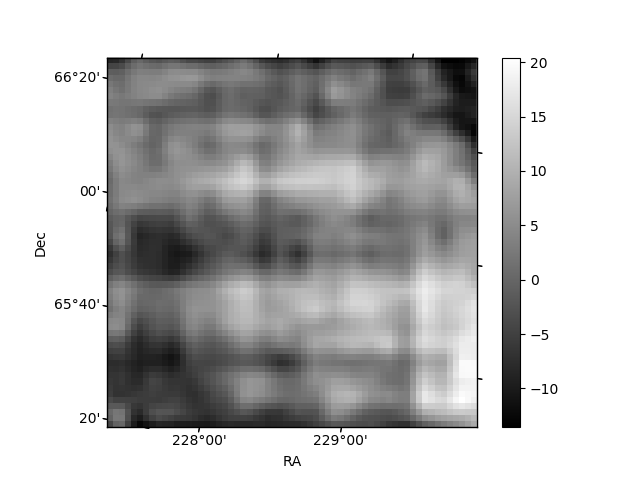
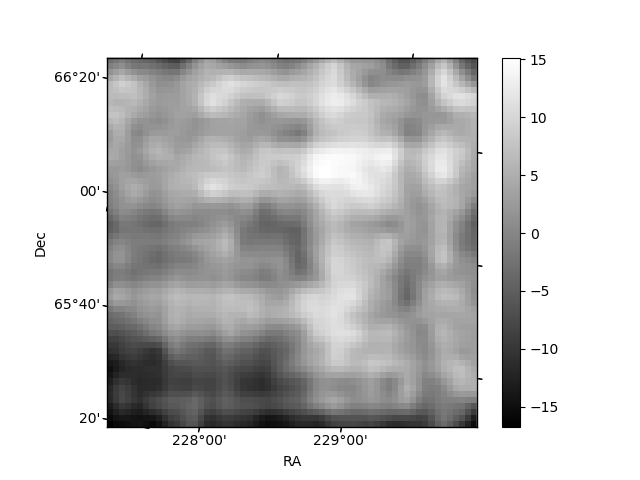
Histogram calculated using DETX and DETY for each event in the final _common_clean file
| Quadrant A | 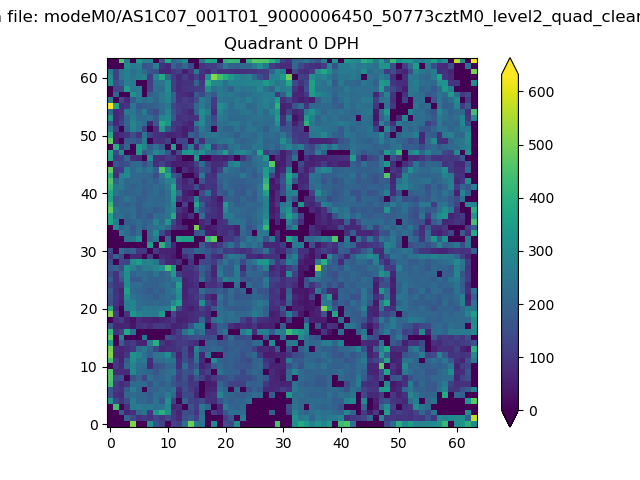 |
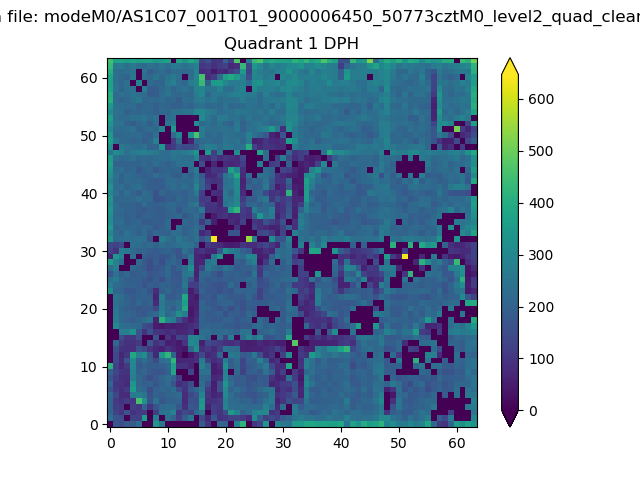 |
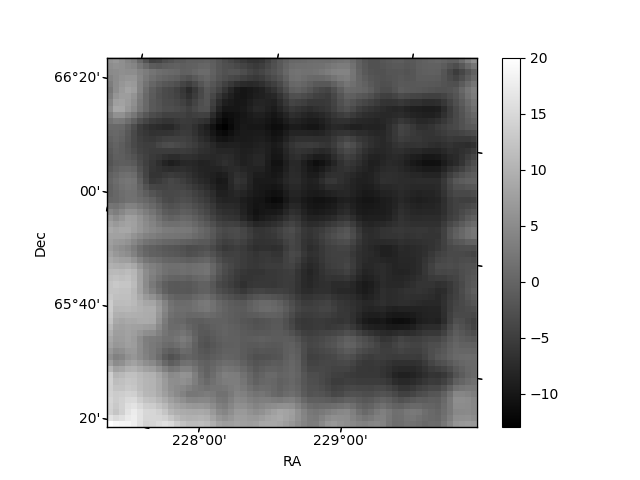
Quadrant B |
|---|---|---|---|
| Quadrant D | 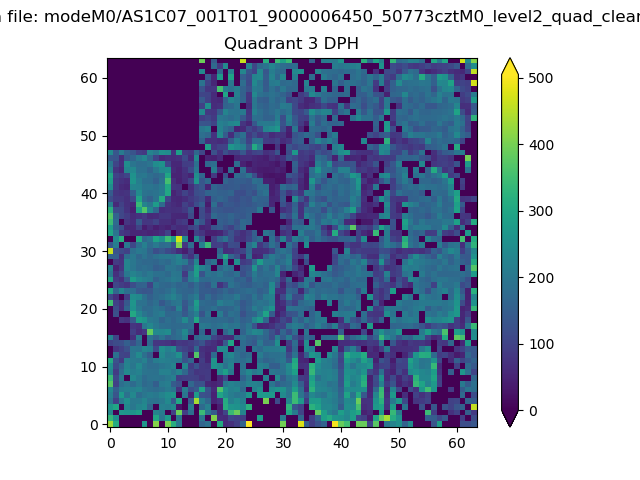 |
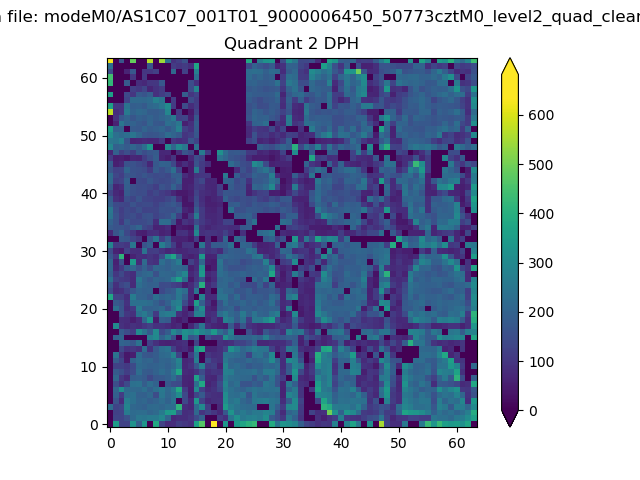 |
Quadrant C |
| Plot type | Count rate plots | Images |
|---|---|---|
| Comparison with Poisson distribution Blue bars denote a histogram of data divided into 1 sec bins. Red curve is a Poisson curve with rate = median count rate of data. |
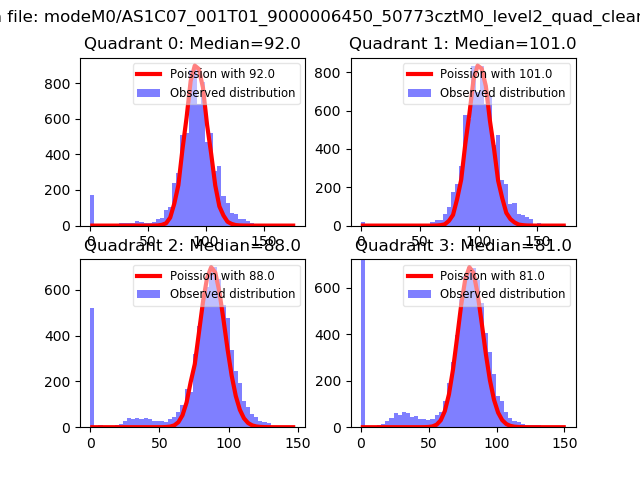 |
 |
| Quadrant-wise count rates Data is divided into 100 sec bins |
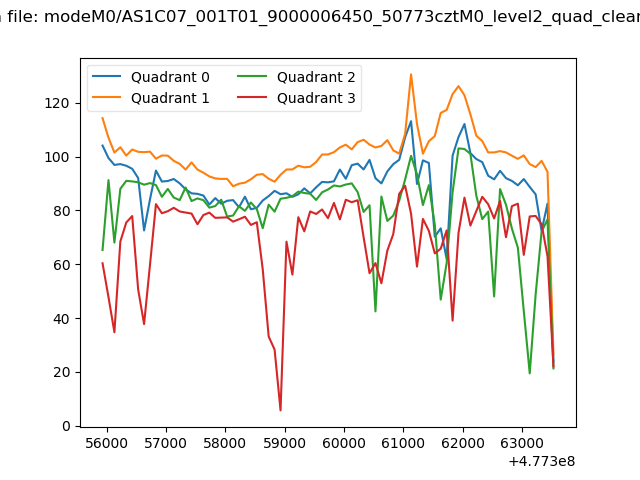 |
|
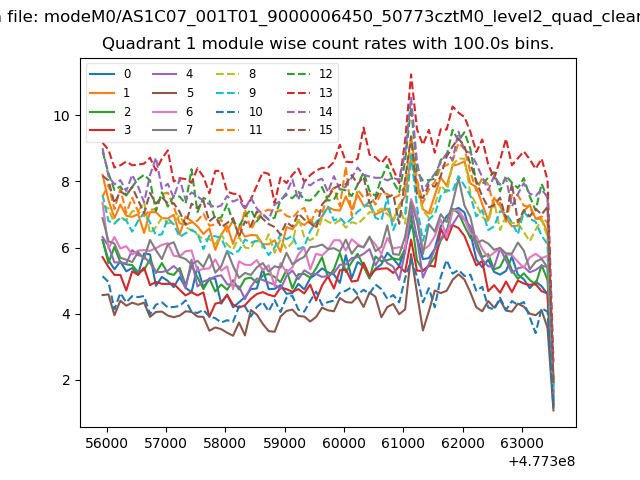
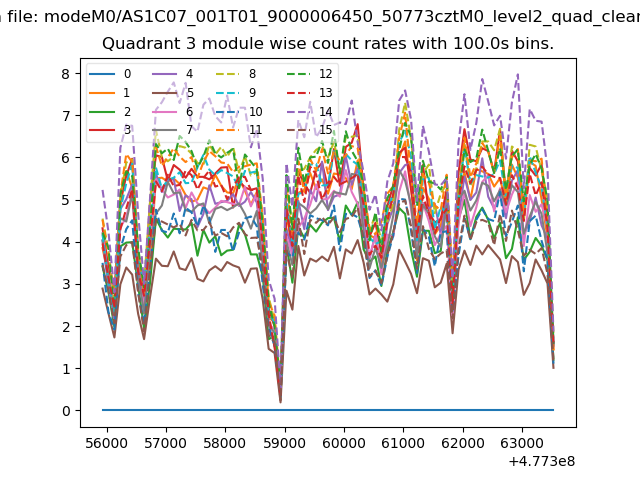
| Module-wise count rates for Quadrant A Data is divided into 100 sec bins |
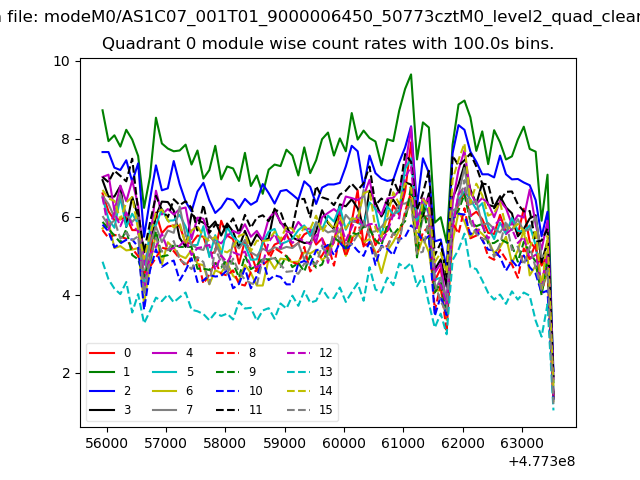 |
 |
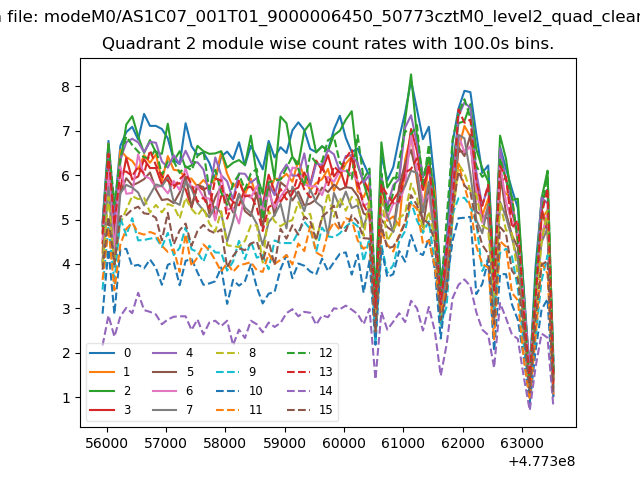
| Module-wise count rates for Quadrant B Data is divided into 100 sec bins |
 |
 |
| Module-wise count rates for Quadrant C Data is divided into 100 sec bins |
 |
 |
| Module-wise count rates for Quadrant D Data is divided into 100 sec bins |
 |
 |
| Parameter | Plot |
|---|---|
| CZT HV Monitor | 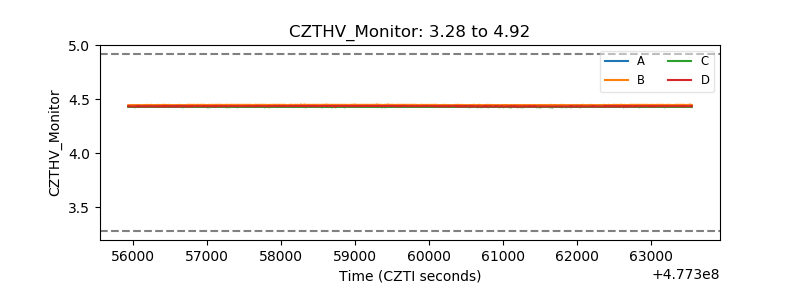 |
| D_VDD |  |
| Temperature 1 | 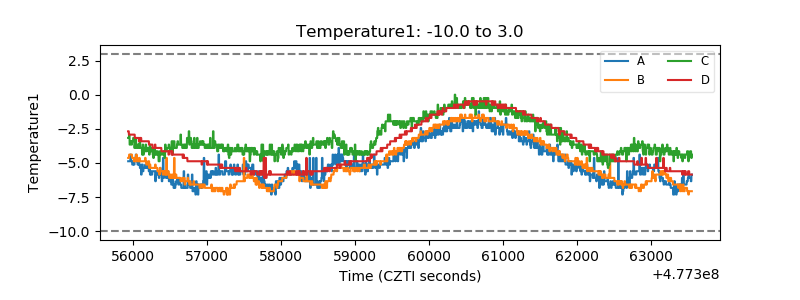 |
| Veto HV Monitor |  |
| Veto LLD | 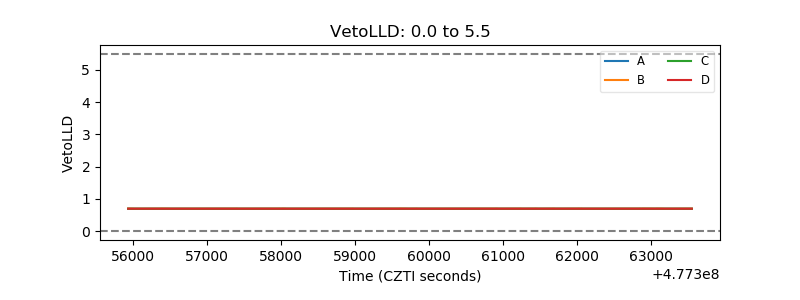 |
| Alpha Counter | 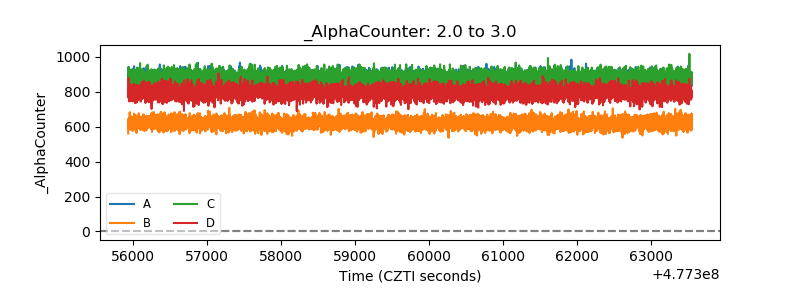 |
| _CPM_Rate | 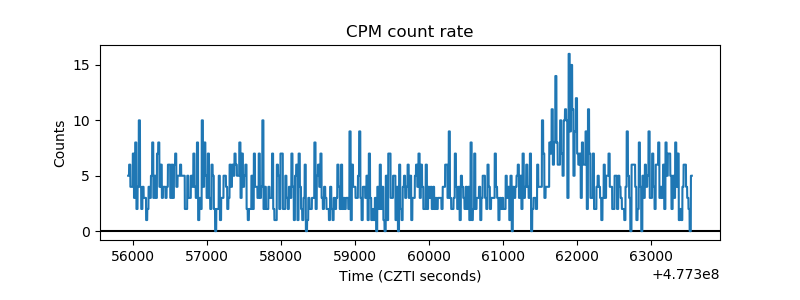 |
| CZT Counter | 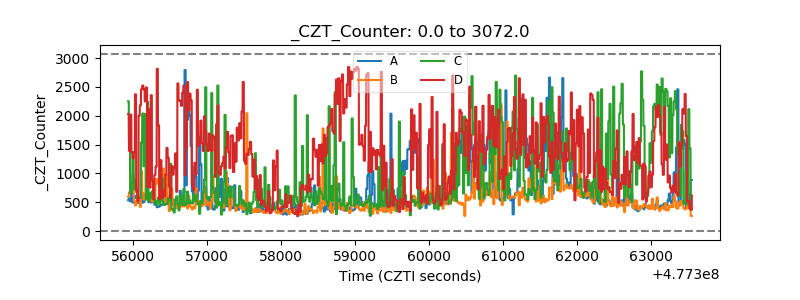 |
| +2.5 Volts monitor | 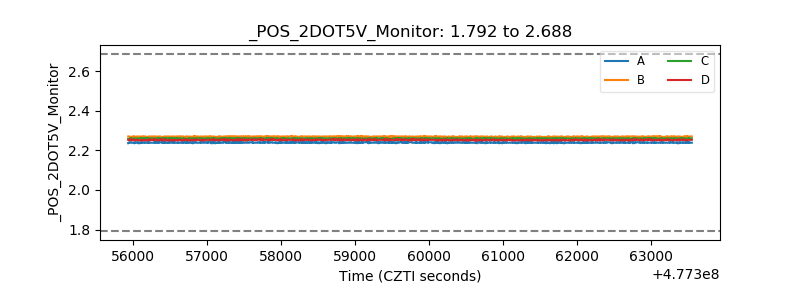 |
| +5 Volts monitor |  |
| _ROLL_ROT | 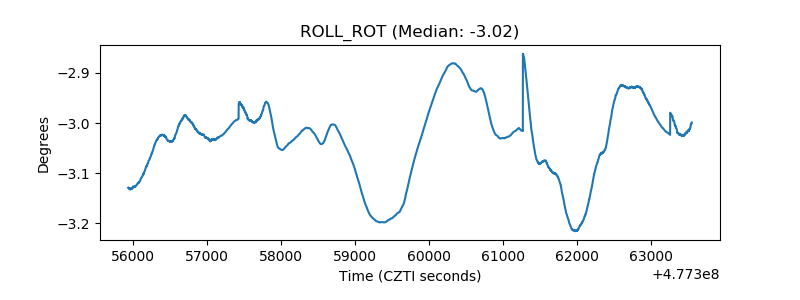 |
| _Roll_DEC | 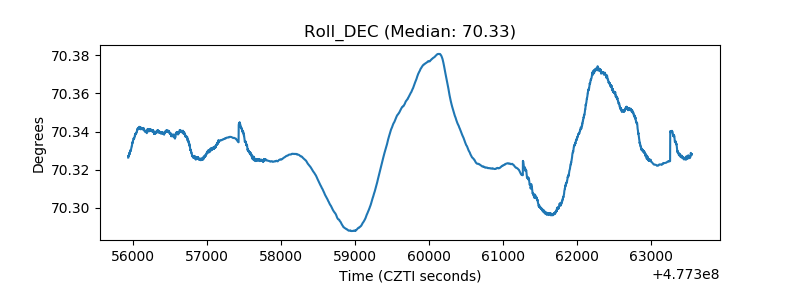 |
| _Roll_RA | 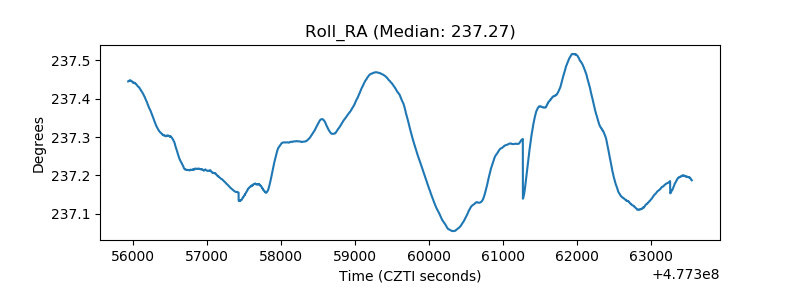 |
| Veto Counter | 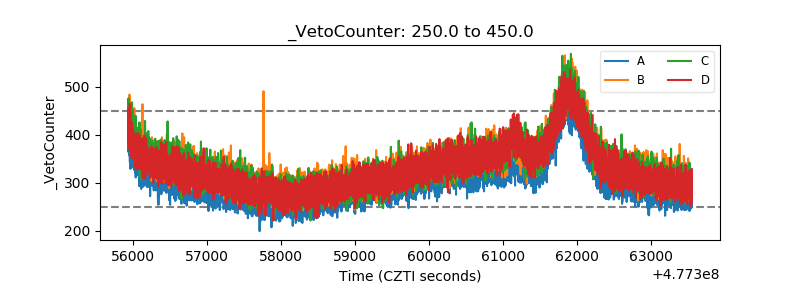 |