| Param | Original file | Final file |
|---|---|---|
| Filename | modeM0/AS1C07_001T01_9000006450_50774cztM0_level2.fits | modeM0/AS1C07_001T01_9000006450_50774cztM0_level2_quad_clean.evt |
| Size (bytes) | 932,791,680 | 115,153,920 |
| Size | 889.6 MB | 109.8 MB |
| Events in quadrant A | 5,729,020 | 789,790 |
| Events in quadrant B | 4,429,393 | 884,786 |
| Events in quadrant C | 11,401,603 | 623,424 |
| Events in quadrant D | 12,295,095 | 582,613 |
| Mode SS | |||
|---|---|---|---|
| Quadrant | BADHDUFLAG | Total packets | Discarded packets |
| A | 0 | 174 | 0 |
| B | 0 | 174 | 0 |
| C | 0 | 174 | 0 |
| D | 0 | 174 | 0 |
| Mode M0 | |||
|---|---|---|---|
| Quadrant | BADHDUFLAG | Total packets | Discarded packets |
| A | 0 | 23220 | 0 |
| B | 0 | 19784 | 11 |
| C | 0 | 39968 | 2 |
| D | 0 | 42672 | 0 |
| Quadrant | Total seconds | Saturated seconds | Saturation percentage |
|---|---|---|---|
| A | 8722 | 373 | 4.276542% |
| B | 8720 | 114 | 1.307339% |
| C | 8722 | 2267 | 25.991745% |
| D | 8722 | 2190 | 25.108920% |
Noise dominated data is calculated using 1-second bins in cleaned event files. If a bin has >2000 counts, and if more than 50% of those come from <1% of pixels, then it is considered to be noise-dominated and hence unusable.
| Quadrant | # 1 sec bins | Bins with >0 counts | Bins with >2000 counts | High rate bins dominated by noise | Noise dominated (total time) | Noise dominated (detector-on time) | Marked lightcurve |
|---|---|---|---|---|---|---|---|
| A | 8722 | 8722 | 202 | 202 | 2.32% | 2.32% | 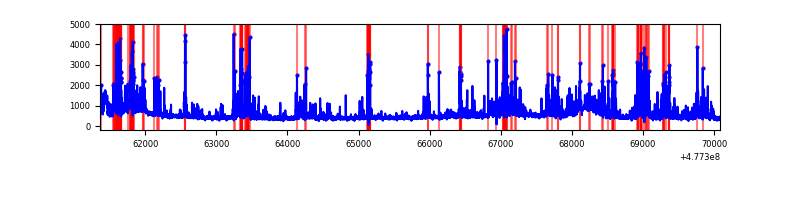 |
| B | 8723 | 8721 | 44 | 44 | 0.50% | 0.50% | 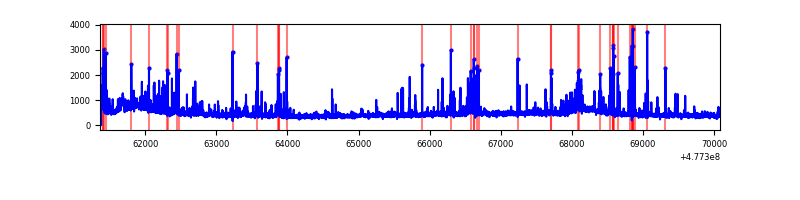 |
| C | 8722 | 8722 | 1484 | 1484 | 17.01% | 17.01% | 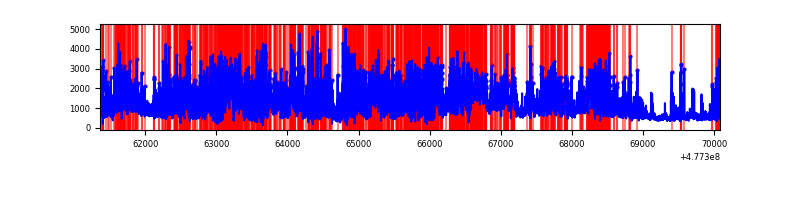 |
| D | 8722 | 8722 | 1552 | 1552 | 17.79% | 17.79% | 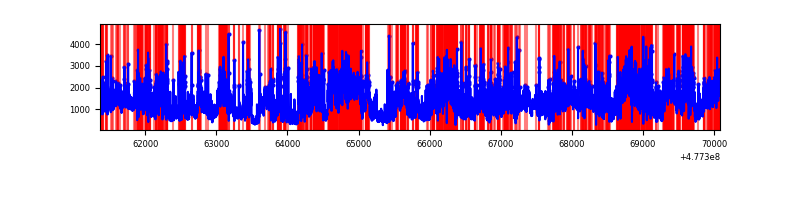 |
Top three noisy pixels from each quadrant. If the there are fewer than three noisy pixels in the level2.evt file, extra rows are filled as -1
| Pixel properties | Quadrant properties | ||||||
|---|---|---|---|---|---|---|---|
| Quadrant | DetID | PixID | Counts | Sigma | Mean | Median | Sigma |
| A | 14 | 254 | 315147 | 1377.89 | 917 | 891 | 228.1 |
| A | 12 | 250 | 298800 | 1306.21 | 917 | 891 | 228.1 |
| A | 3 | 46 | 174188 | 759.84 | 917 | 891 | 228.1 |
| B | 4 | 206 | 94854 | 465.39 | 935 | 900 | 201.9 |
| B | 6 | 51 | 80762 | 395.59 | 935 | 900 | 201.9 |
| B | 8 | 128 | 70922 | 346.85 | 935 | 900 | 201.9 |
| C | 4 | 5 | 2327916 | 9972.97 | 834 | 827 | 233.3 |
| C | 5 | 10 | 1597417 | 6842.34 | 834 | 827 | 233.3 |
| C | 4 | 210 | 1282032 | 5490.73 | 834 | 827 | 233.3 |
| D | 8 | 242 | 3102662 | 13607.1 | 819 | 791 | 228.0 |
| D | 15 | 93 | 1002557 | 4394.48 | 819 | 791 | 228.0 |
| D | 8 | 241 | 697798 | 3057.59 | 819 | 791 | 228.0 |
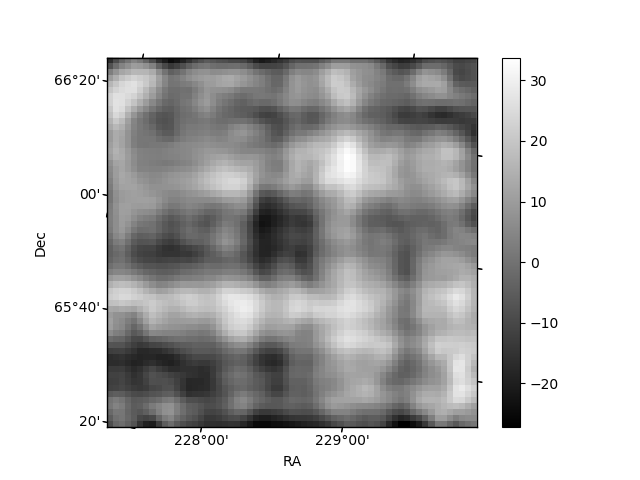
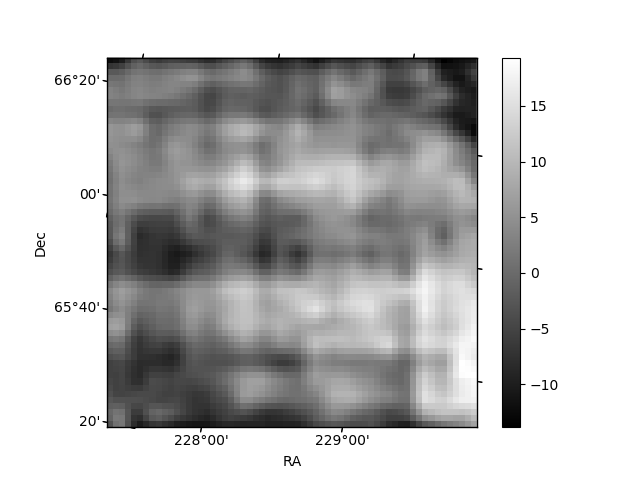
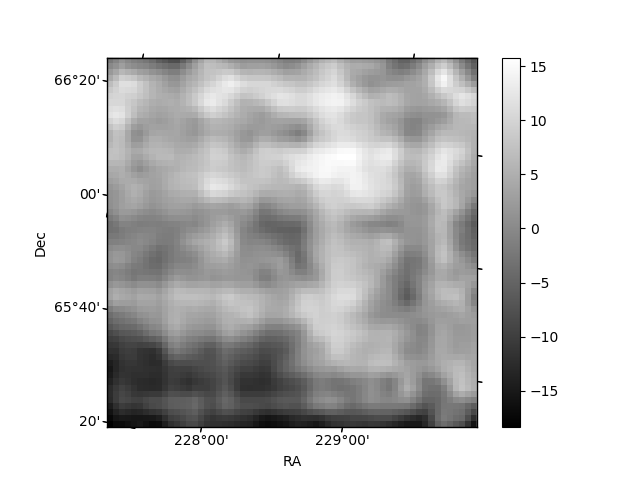
Histogram calculated using DETX and DETY for each event in the final _common_clean file
| Quadrant A | 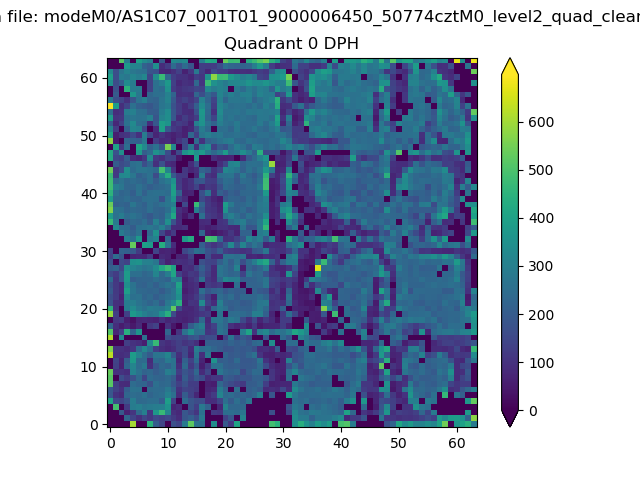 |
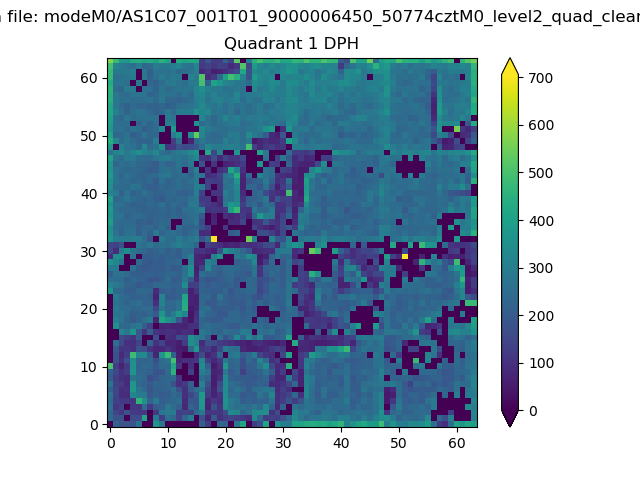 |
Quadrant B |
|---|---|---|---|
| Quadrant D | 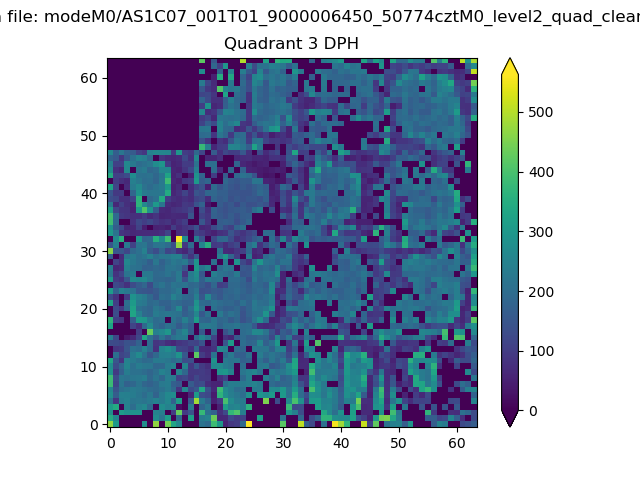 |
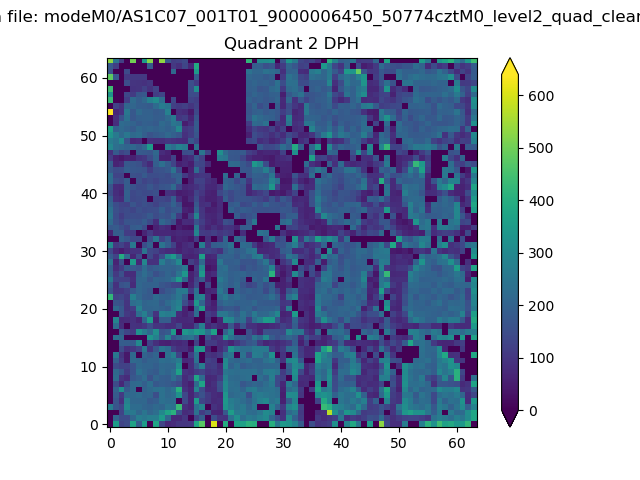 |
Quadrant C |
| Plot type | Count rate plots | Images |
|---|---|---|
| Comparison with Poisson distribution Blue bars denote a histogram of data divided into 1 sec bins. Red curve is a Poisson curve with rate = median count rate of data. |
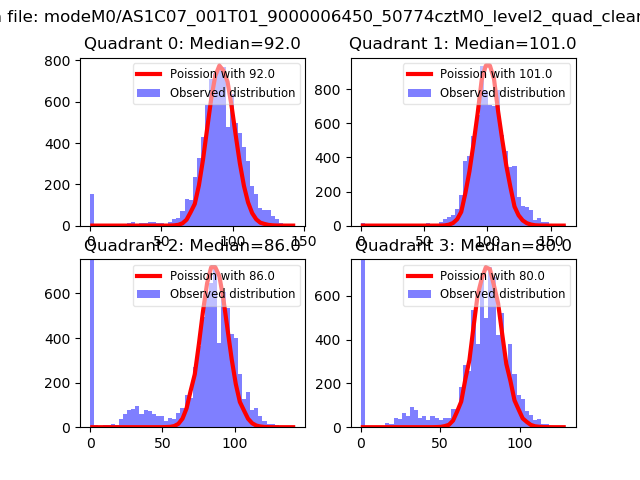 |
 |
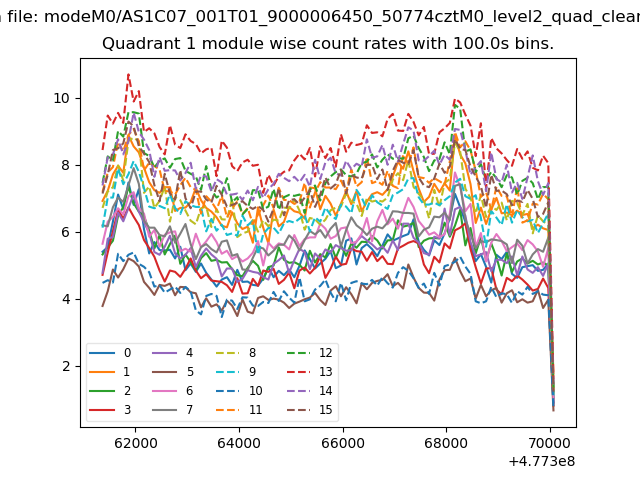
| Quadrant-wise count rates Data is divided into 100 sec bins |
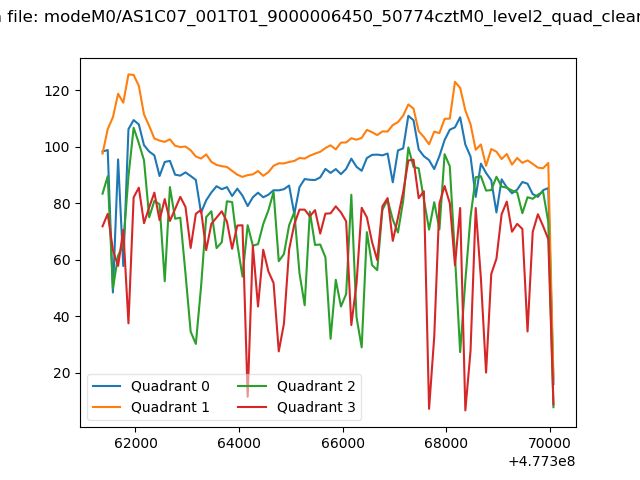 |
|
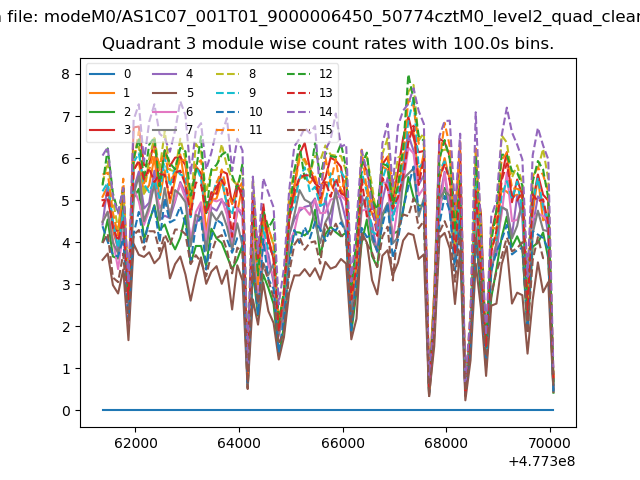
| Module-wise count rates for Quadrant A Data is divided into 100 sec bins |
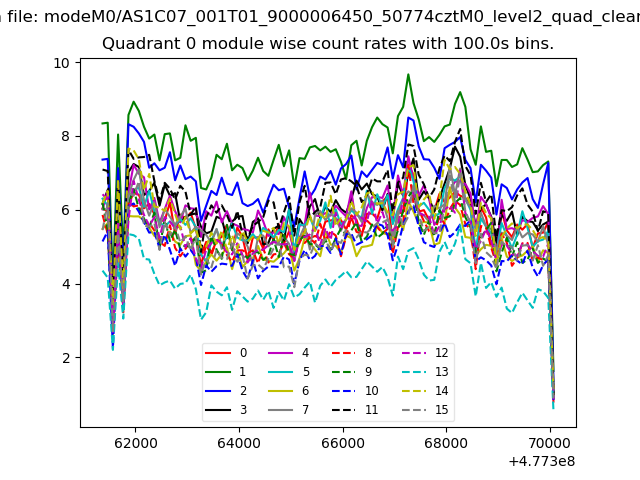 |
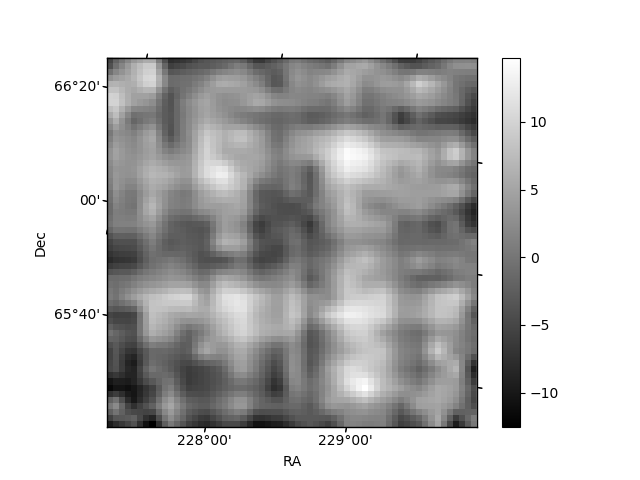 |
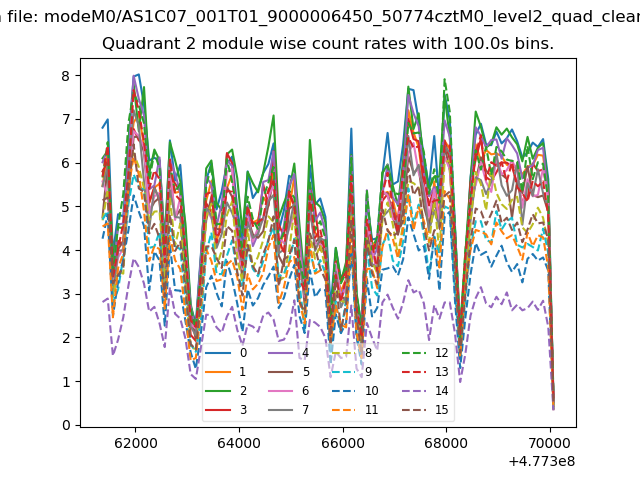
| Module-wise count rates for Quadrant B Data is divided into 100 sec bins |
 |
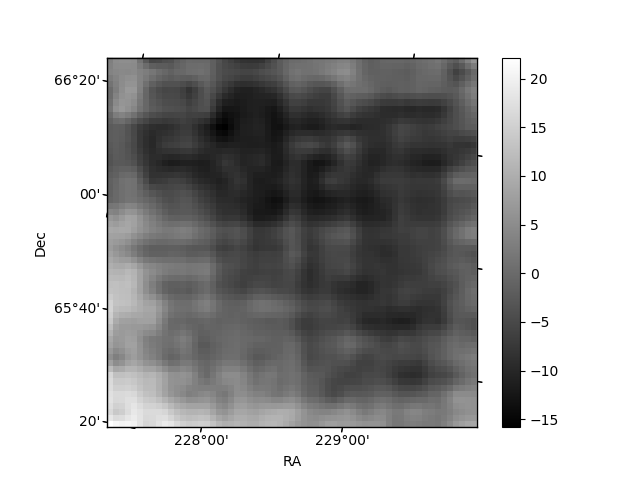 |
| Module-wise count rates for Quadrant C Data is divided into 100 sec bins |
 |
 |
| Module-wise count rates for Quadrant D Data is divided into 100 sec bins |
 |
 |
| Parameter | Plot |
|---|---|
| CZT HV Monitor | 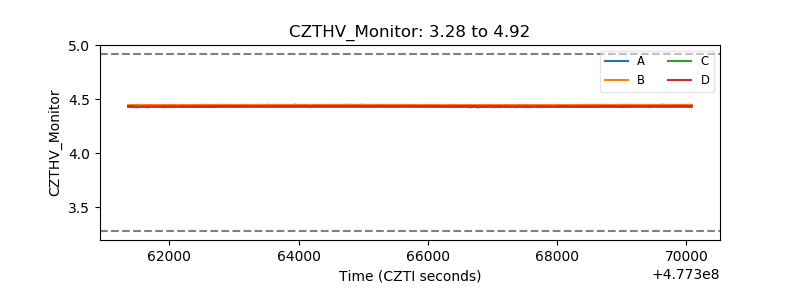 |
| D_VDD | 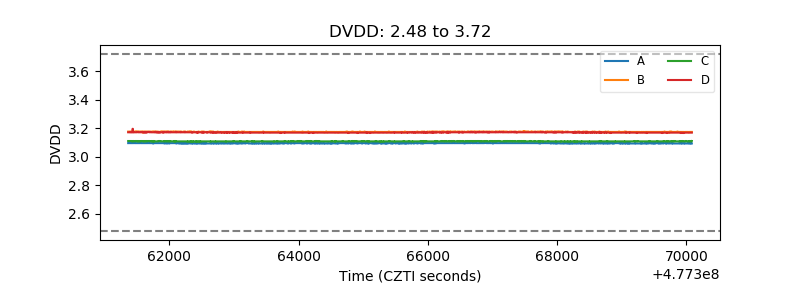 |
| Temperature 1 | 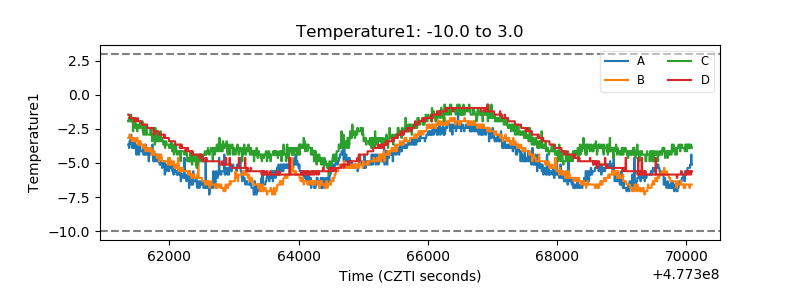 |
| Veto HV Monitor | 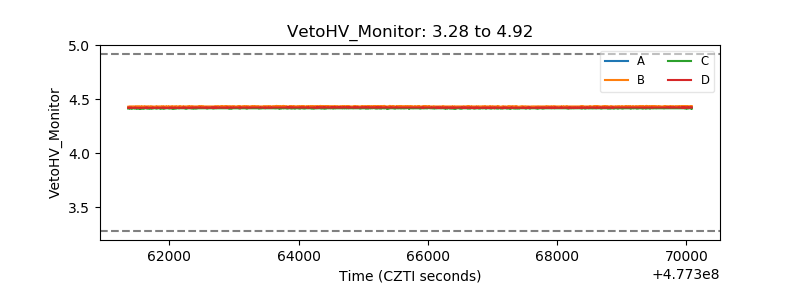 |
| Veto LLD | 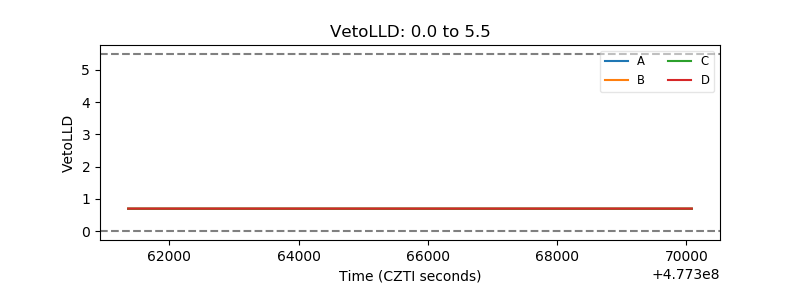 |
| Alpha Counter | 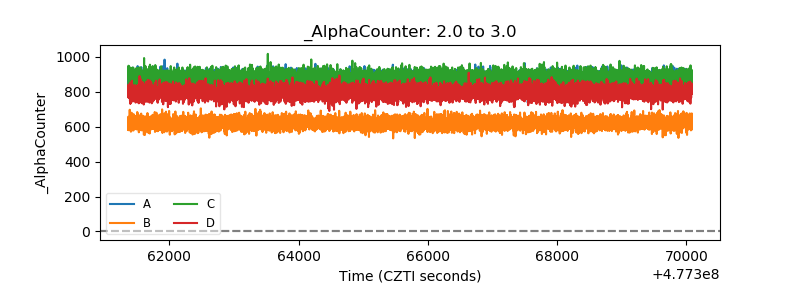 |
| _CPM_Rate | 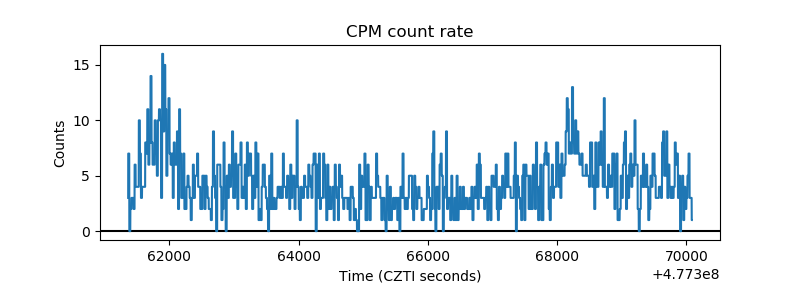 |
| CZT Counter | 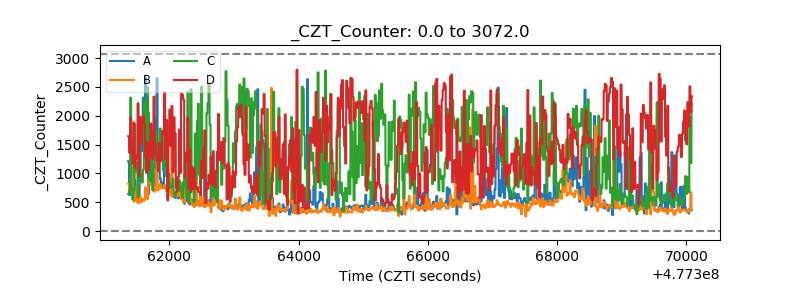 |
| +2.5 Volts monitor | 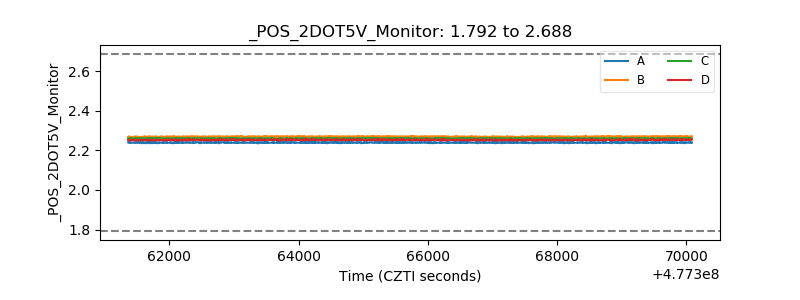 |
| +5 Volts monitor | 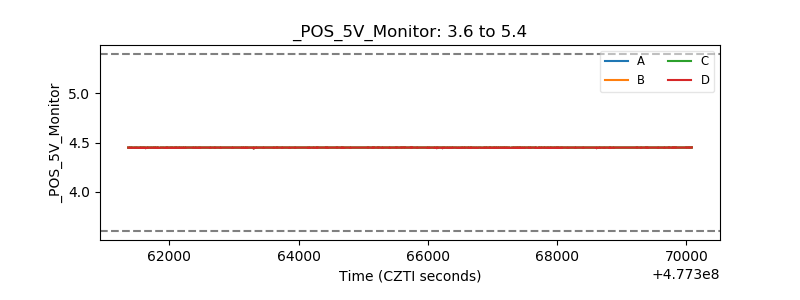 |
| _ROLL_ROT | 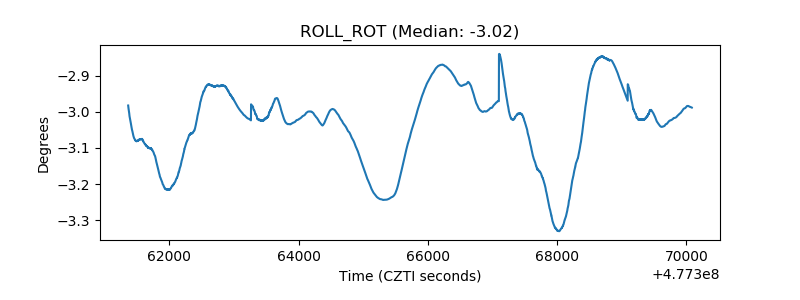 |
| _Roll_DEC | 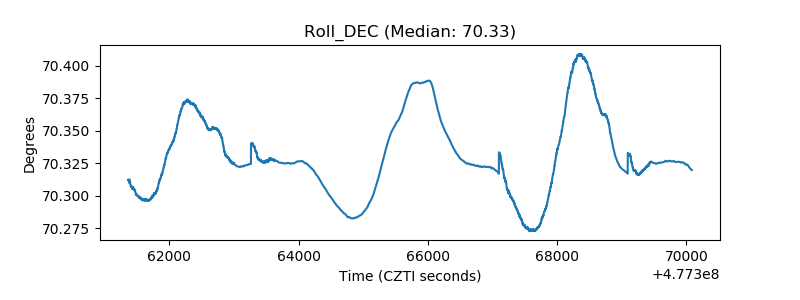 |
| _Roll_RA | 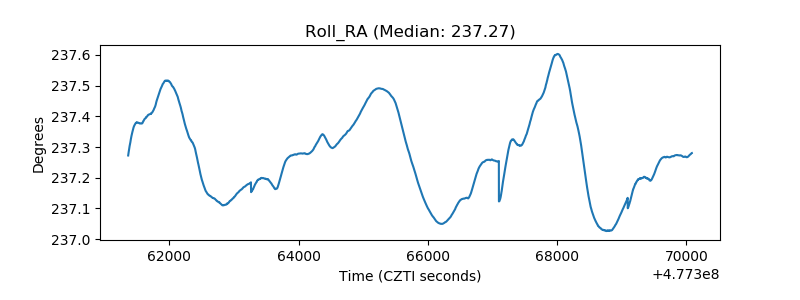 |
| Veto Counter | 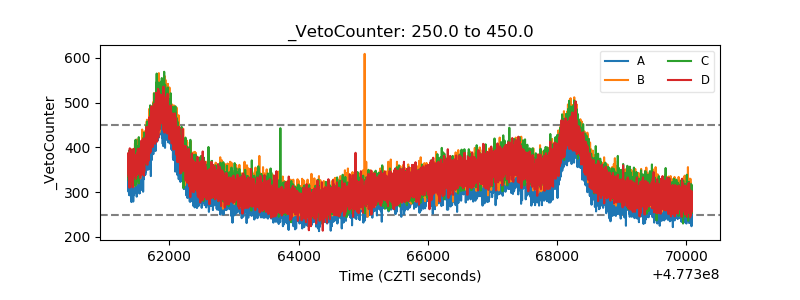 |