| Param | Original file | Final file |
|---|---|---|
| Filename | modeM0/AS1C07_001T01_9000006450_50775cztM0_level2.fits | modeM0/AS1C07_001T01_9000006450_50775cztM0_level2_quad_clean.evt |
| Size (bytes) | 747,910,080 | 94,415,040 |
| Size | 713.3 MB | 90.0 MB |
| Events in quadrant A | 4,782,395 | 651,180 |
| Events in quadrant B | 3,497,592 | 715,075 |
| Events in quadrant C | 8,360,322 | 522,345 |
| Events in quadrant D | 10,489,797 | 469,908 |
| Mode SS | |||
|---|---|---|---|
| Quadrant | BADHDUFLAG | Total packets | Discarded packets |
| A | 0 | 144 | 0 |
| B | 0 | 144 | 0 |
| C | 0 | 144 | 0 |
| D | 0 | 144 | 0 |
| Mode M0 | |||
|---|---|---|---|
| Quadrant | BADHDUFLAG | Total packets | Discarded packets |
| A | 0 | 19339 | 0 |
| B | 0 | 15865 | 0 |
| C | 0 | 29839 | 0 |
| D | 0 | 36258 | 5 |
| Quadrant | Total seconds | Saturated seconds | Saturation percentage |
|---|---|---|---|
| A | 7176 | 190 | 2.647715% |
| B | 7176 | 118 | 1.644370% |
| C | 7176 | 1612 | 22.463768% |
| D | 7175 | 1705 | 23.763066% |
Noise dominated data is calculated using 1-second bins in cleaned event files. If a bin has >2000 counts, and if more than 50% of those come from <1% of pixels, then it is considered to be noise-dominated and hence unusable.
| Quadrant | # 1 sec bins | Bins with >0 counts | Bins with >2000 counts | High rate bins dominated by noise | Noise dominated (total time) | Noise dominated (detector-on time) | Marked lightcurve |
|---|---|---|---|---|---|---|---|
| A | 7176 | 7176 | 105 | 105 | 1.46% | 1.46% |  |
| B | 7176 | 7176 | 32 | 32 | 0.45% | 0.45% | 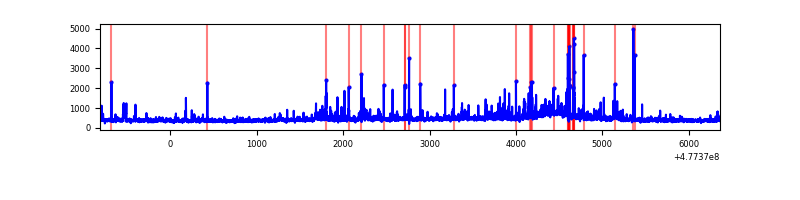 |
| C | 7176 | 7176 | 1000 | 1000 | 13.94% | 13.94% | 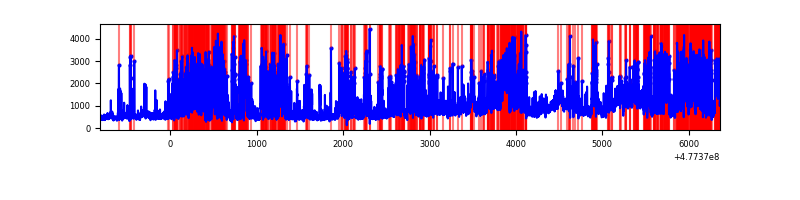 |
| D | 7175 | 7175 | 1293 | 1293 | 18.02% | 18.02% | 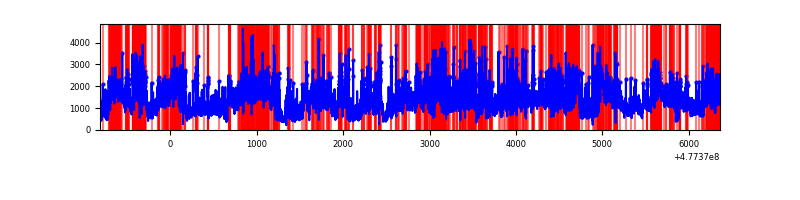 |
Top three noisy pixels from each quadrant. If the there are fewer than three noisy pixels in the level2.evt file, extra rows are filled as -1
| Pixel properties | Quadrant properties | ||||||
|---|---|---|---|---|---|---|---|
| Quadrant | DetID | PixID | Counts | Sigma | Mean | Median | Sigma |
| A | 12 | 80 | 541761 | 2951.83 | 745 | 726 | 183.3 |
| A | 14 | 254 | 339256 | 1846.98 | 745 | 726 | 183.3 |
| A | 12 | 250 | 173748 | 943.99 | 745 | 726 | 183.3 |
| B | 9 | 251 | 87057 | 537.8 | 745 | 719 | 160.5 |
| B | 10 | 246 | 48259 | 296.12 | 745 | 719 | 160.5 |
| B | 4 | 206 | 47536 | 291.62 | 745 | 719 | 160.5 |
| C | 4 | 210 | 2367927 | 12868.78 | 670 | 666 | 184.0 |
| C | 15 | 174 | 1075000 | 5840.24 | 670 | 666 | 184.0 |
| C | 5 | 10 | 331506 | 1798.5 | 670 | 666 | 184.0 |
| D | 8 | 242 | 3560440 | 19261.23 | 644 | 621 | 184.8 |
| D | 8 | 241 | 759749 | 4107.44 | 644 | 621 | 184.8 |
| D | 8 | 226 | 449808 | 2430.43 | 644 | 621 | 184.8 |
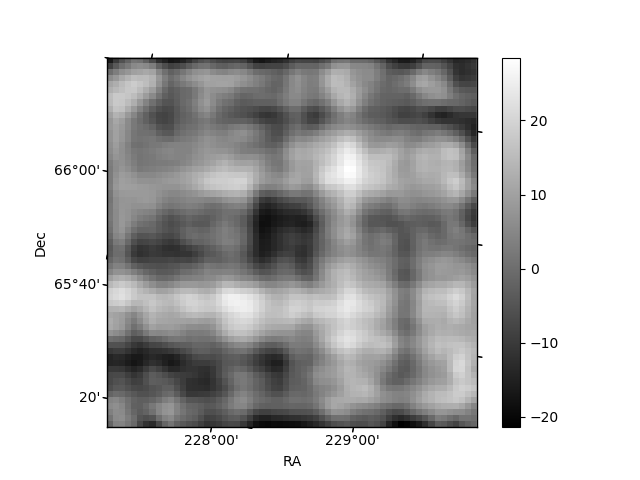
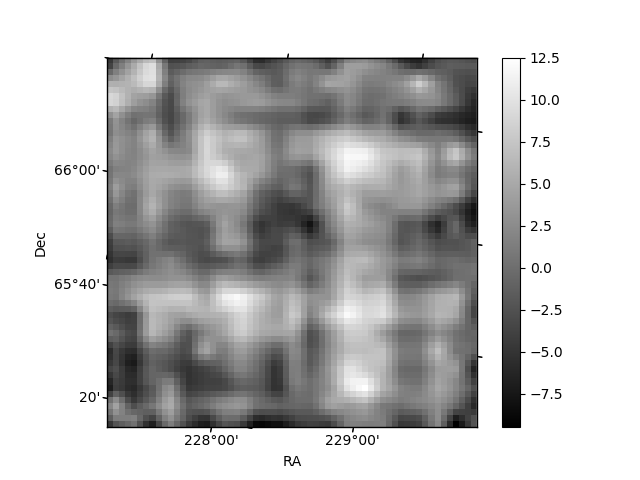
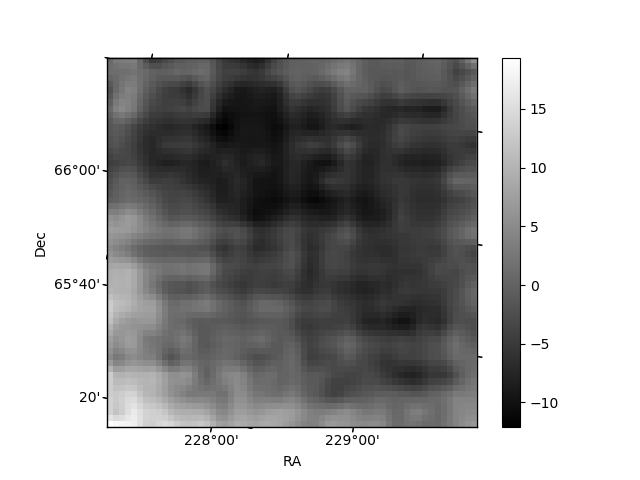
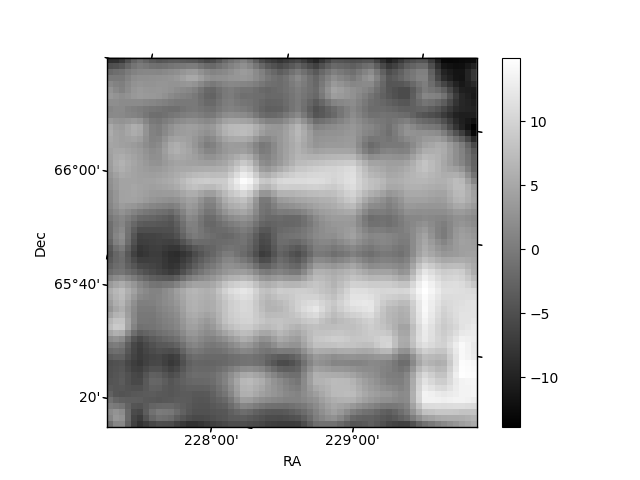
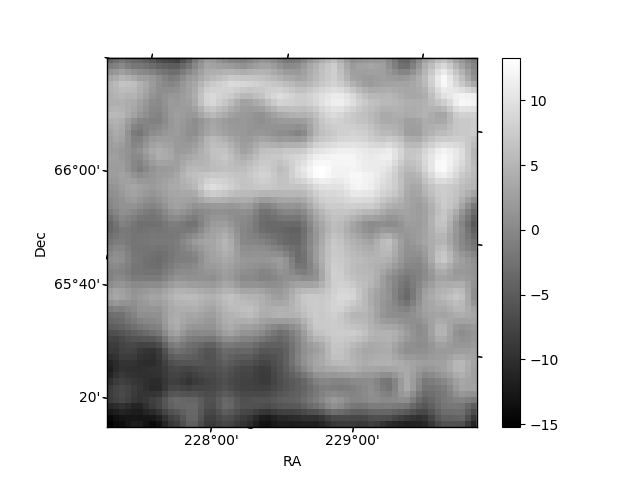
Histogram calculated using DETX and DETY for each event in the final _common_clean file
| Quadrant A | 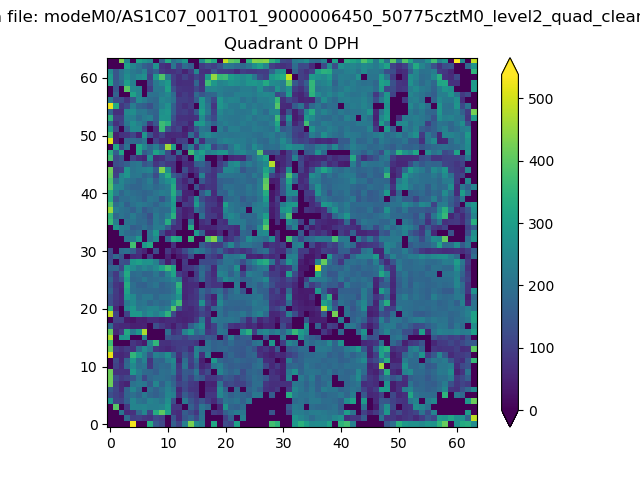 |
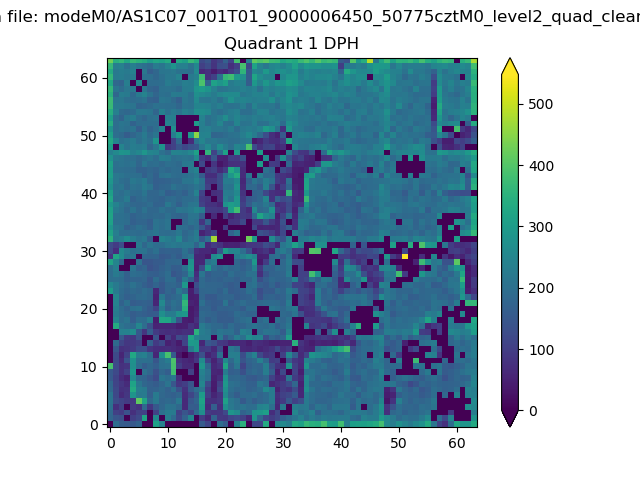 |
Quadrant B |
|---|---|---|---|
| Quadrant D | 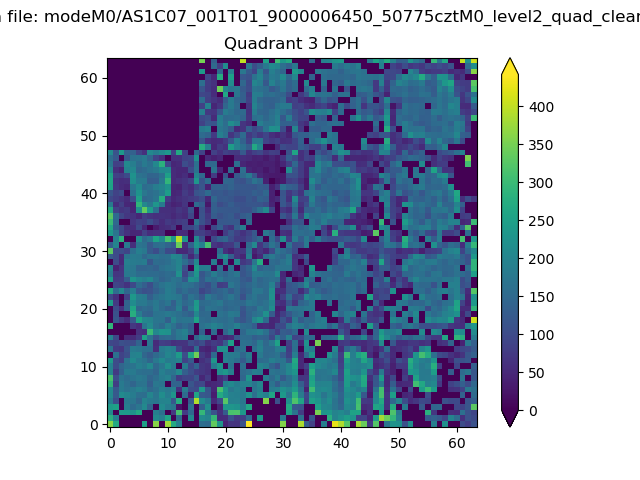 |
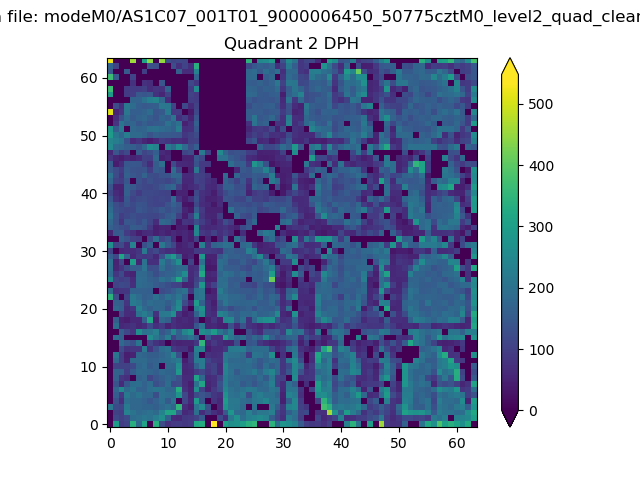 |
Quadrant C |
| Plot type | Count rate plots | Images |
|---|---|---|
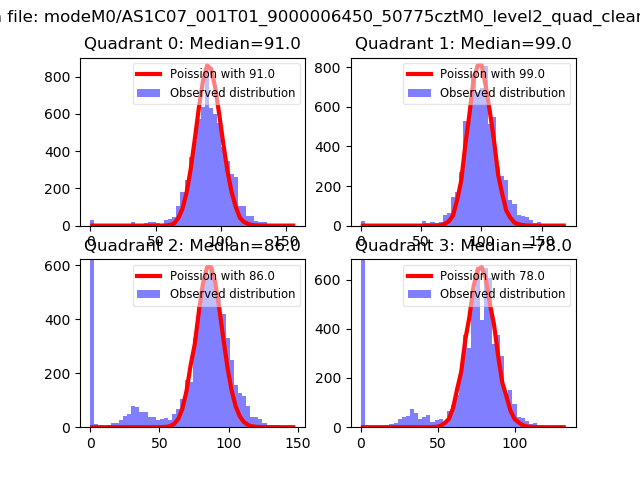
| Comparison with Poisson distribution Blue bars denote a histogram of data divided into 1 sec bins. Red curve is a Poisson curve with rate = median count rate of data. |
 |
 |
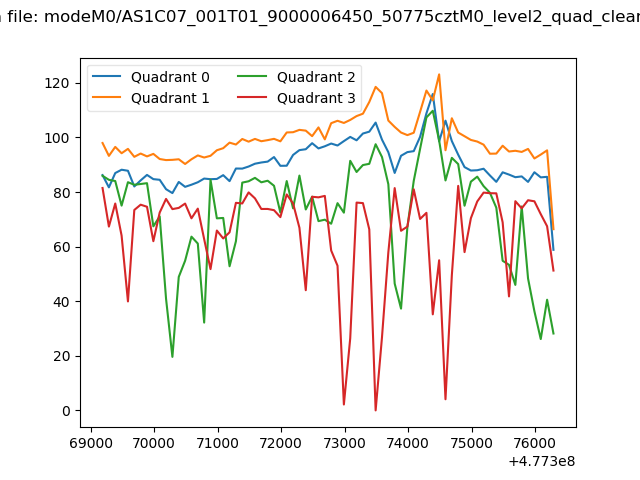
| Quadrant-wise count rates Data is divided into 100 sec bins |
 |
|
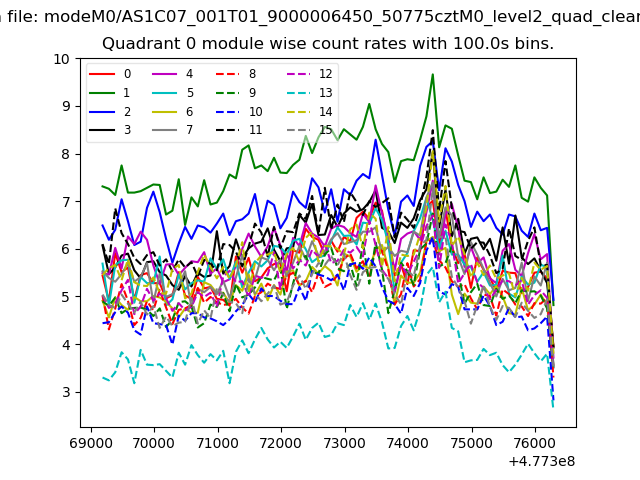
| Module-wise count rates for Quadrant A Data is divided into 100 sec bins |
 |
 |
| Module-wise count rates for Quadrant B Data is divided into 100 sec bins |
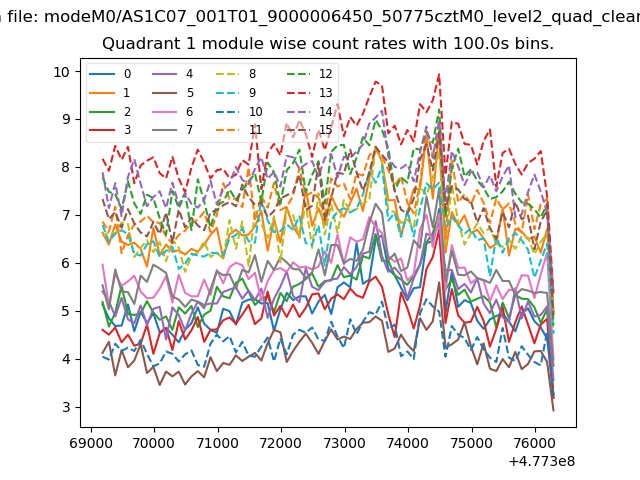 |
 |
| Module-wise count rates for Quadrant C Data is divided into 100 sec bins |
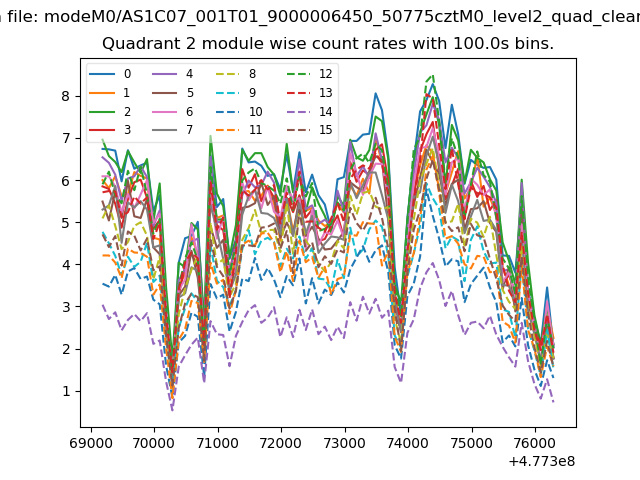 |
 |
| Module-wise count rates for Quadrant D Data is divided into 100 sec bins |
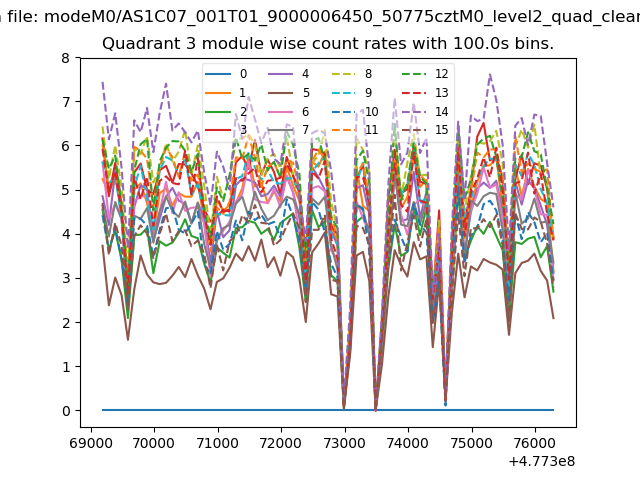 |
 |
| Parameter | Plot |
|---|---|
| CZT HV Monitor | 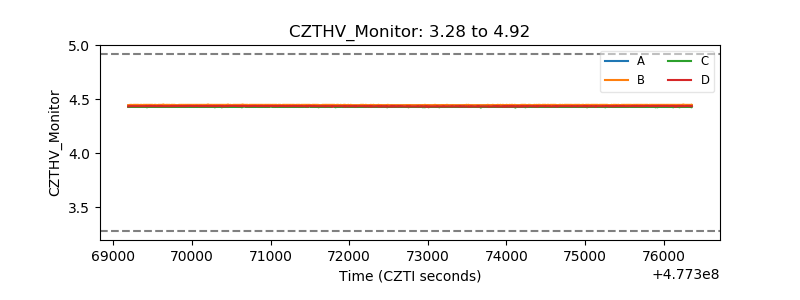 |
| D_VDD | 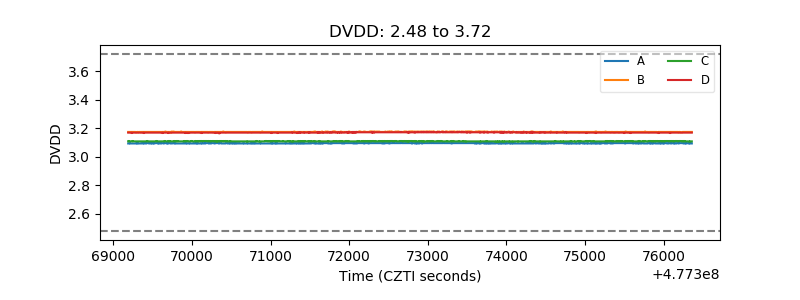 |
| Temperature 1 | 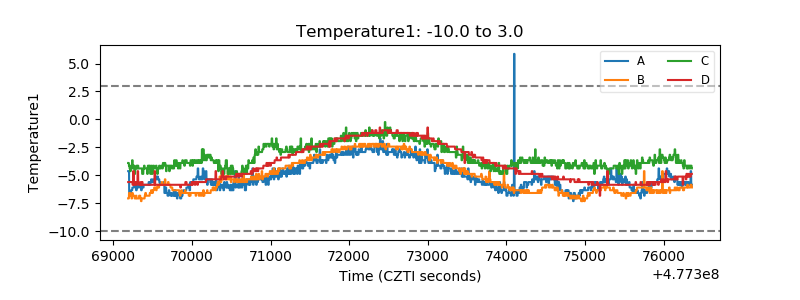 |
| Veto HV Monitor | 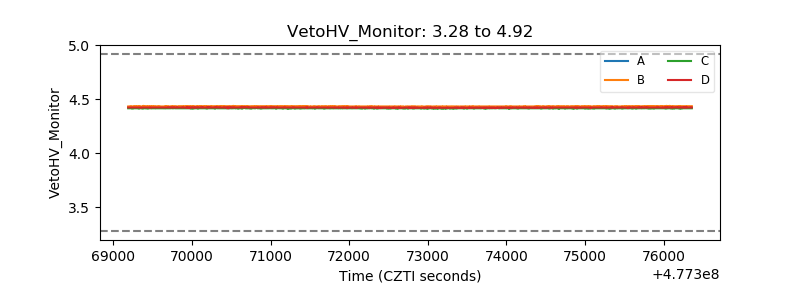 |
| Veto LLD | 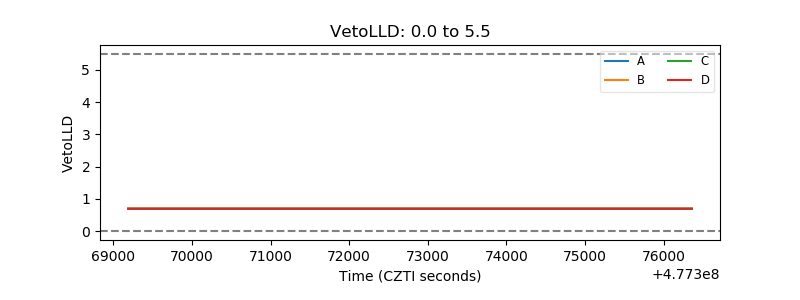 |
| Alpha Counter | 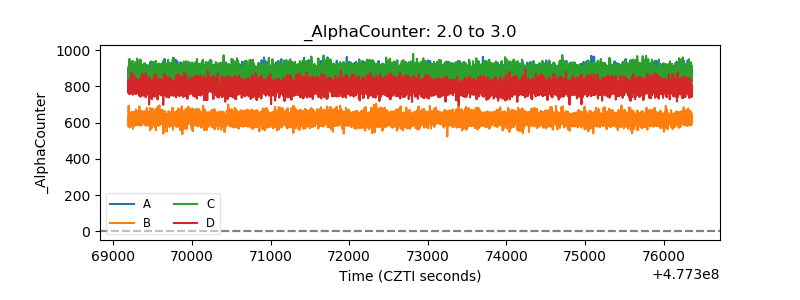 |
| _CPM_Rate | 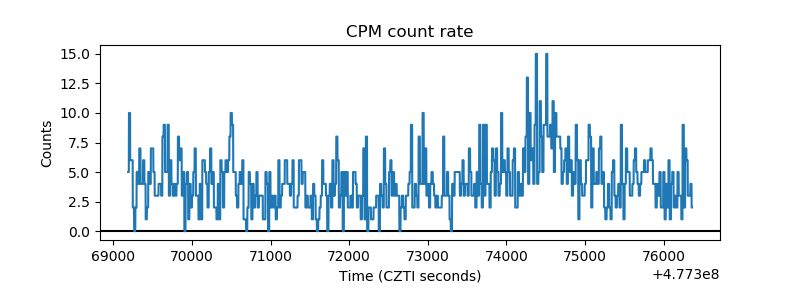 |
| CZT Counter | 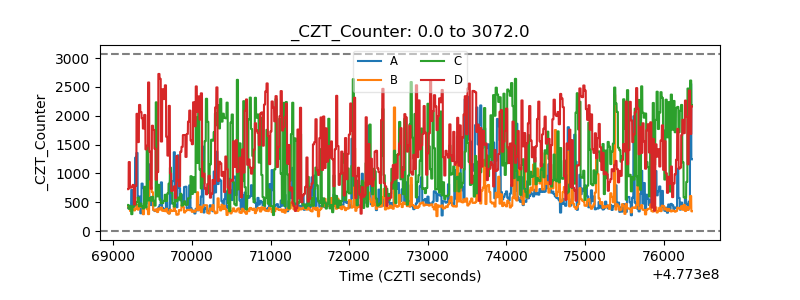 |
| +2.5 Volts monitor | 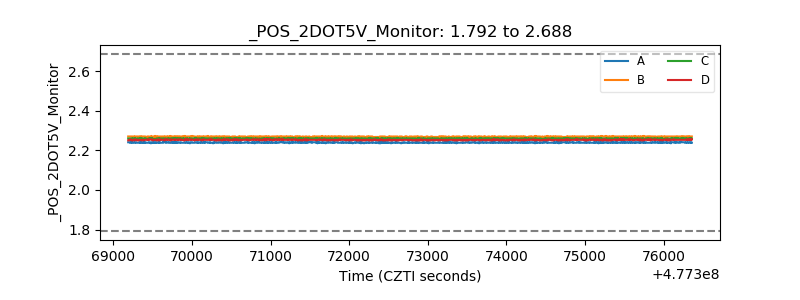 |
| +5 Volts monitor |  |
| _ROLL_ROT | 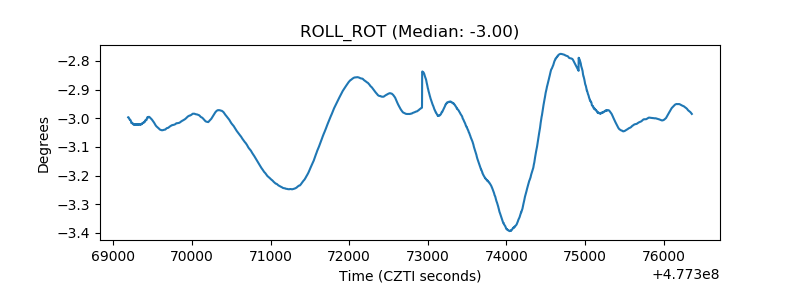 |
| _Roll_DEC | 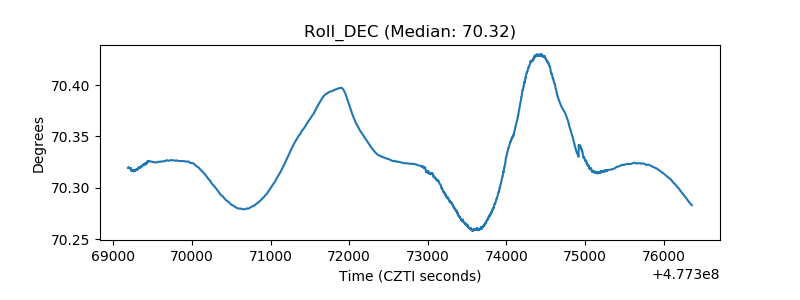 |
| _Roll_RA | 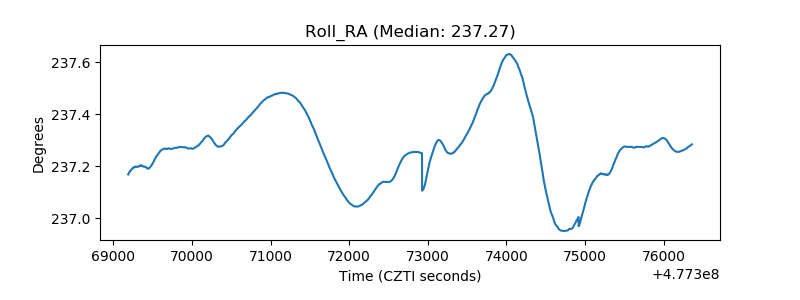 |
| Veto Counter | 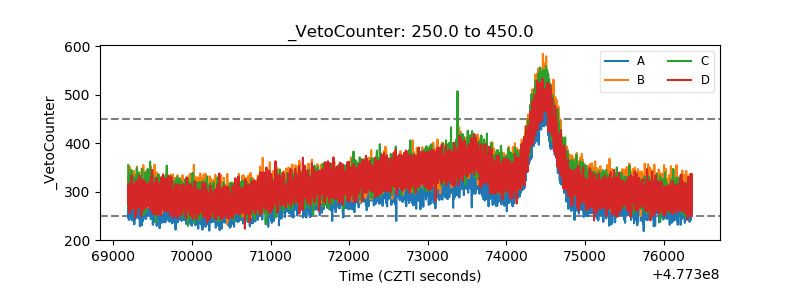 |