| Param | Original file | Final file |
|---|---|---|
| Filename | modeM0/AS1C07_001T01_9000006450_50778cztM0_level2.fits | modeM0/AS1C07_001T01_9000006450_50778cztM0_level2_quad_clean.evt |
| Size (bytes) | 2,292,984,000 | 206,576,640 |
| Size | 2.1 GB | 197.0 MB |
| Events in quadrant A | 15,180,233 | 1,545,536 |
| Events in quadrant B | 9,126,093 | 1,758,789 |
| Events in quadrant C | 34,569,225 | 741,879 |
| Events in quadrant D | 24,603,932 | 955,944 |
| Mode SS | |||
|---|---|---|---|
| Quadrant | BADHDUFLAG | Total packets | Discarded packets |
| A | 0 | 370 | 0 |
| B | 0 | 370 | 0 |
| C | 0 | 370 | 0 |
| D | 0 | 370 | 0 |
| Mode M0 | |||
|---|---|---|---|
| Quadrant | BADHDUFLAG | Total packets | Discarded packets |
| A | 0 | 57413 | 3 |
| B | 0 | 40258 | 3 |
| C | 0 | 115295 | 3 |
| D | 0 | 85676 | 3 |
| Mode M9 | |||
|---|---|---|---|
| Quadrant | BADHDUFLAG | Total packets | Discarded packets |
| A | 0 | 12 | 0 |
| B | 0 | 12 | 0 |
| C | 0 | 12 | 0 |
| D | 0 | 12 | 0 |
| Quadrant | Total seconds | Saturated seconds | Saturation percentage |
|---|---|---|---|
| A | 18147 | 1391 | 7.665179% |
| B | 18147 | 487 | 2.683639% |
| C | 18148 | 10441 | 57.532510% |
| D | 18148 | 6729 | 37.078466% |
Noise dominated data is calculated using 1-second bins in cleaned event files. If a bin has >2000 counts, and if more than 50% of those come from <1% of pixels, then it is considered to be noise-dominated and hence unusable.
| Quadrant | # 1 sec bins | Bins with >0 counts | Bins with >2000 counts | High rate bins dominated by noise | Noise dominated (total time) | Noise dominated (detector-on time) | Marked lightcurve |
|---|---|---|---|---|---|---|---|
| A | 19453 | 18151 | 928 | 928 | 4.77% | 5.11% | 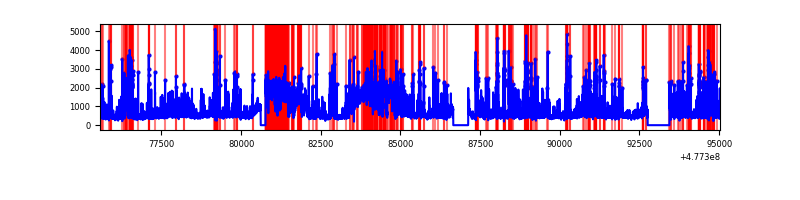 |
| B | 19453 | 18151 | 92 | 92 | 0.47% | 0.51% | 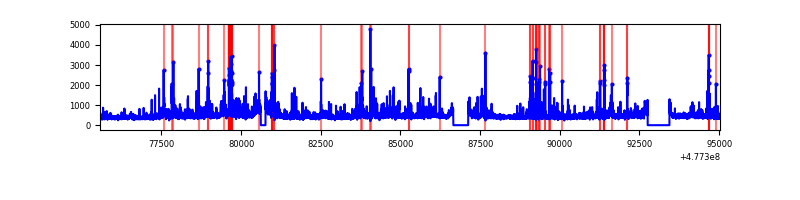 |
| C | 19454 | 18152 | 8471 | 8471 | 43.54% | 46.67% | 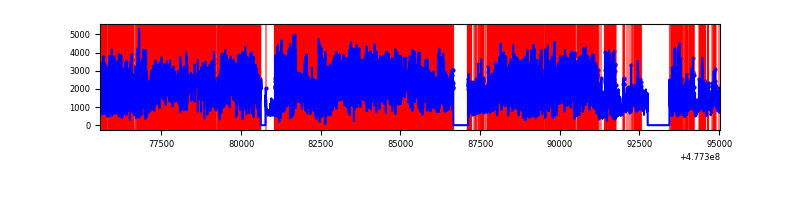 |
| D | 19453 | 18151 | 3565 | 3565 | 18.33% | 19.64% | 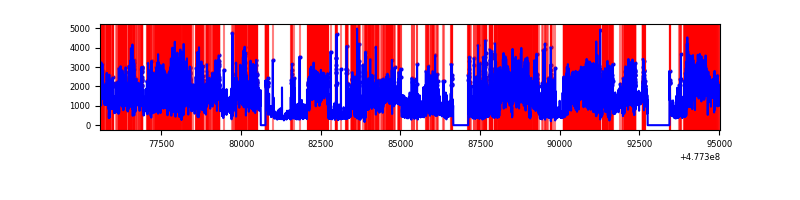 |
Top three noisy pixels from each quadrant. If the there are fewer than three noisy pixels in the level2.evt file, extra rows are filled as -1
| Pixel properties | Quadrant properties | ||||||
|---|---|---|---|---|---|---|---|
| Quadrant | DetID | PixID | Counts | Sigma | Mean | Median | Sigma |
| A | 12 | 80 | 3342726 | 7210.27 | 1885 | 1841 | 463.4 |
| A | 5 | 17 | 807596 | 1738.97 | 1885 | 1841 | 463.4 |
| A | 4 | 249 | 730865 | 1573.37 | 1885 | 1841 | 463.4 |
| B | 4 | 206 | 353507 | 867.69 | 1906 | 1838 | 405.3 |
| B | 5 | 185 | 198353 | 484.87 | 1906 | 1838 | 405.3 |
| B | 7 | 0 | 140081 | 341.09 | 1906 | 1838 | 405.3 |
| C | 15 | 157 | 12656226 | 33070.94 | 1332 | 1313 | 382.7 |
| C | 5 | 10 | 4477023 | 11696.32 | 1332 | 1313 | 382.7 |
| C | 15 | 230 | 2449784 | 6398.56 | 1332 | 1313 | 382.7 |
| D | 8 | 242 | 8086787 | 18638.33 | 1536 | 1482 | 433.8 |
| D | 8 | 241 | 1856028 | 4275.12 | 1536 | 1482 | 433.8 |
| D | 8 | 176 | 1536528 | 3538.61 | 1536 | 1482 | 433.8 |
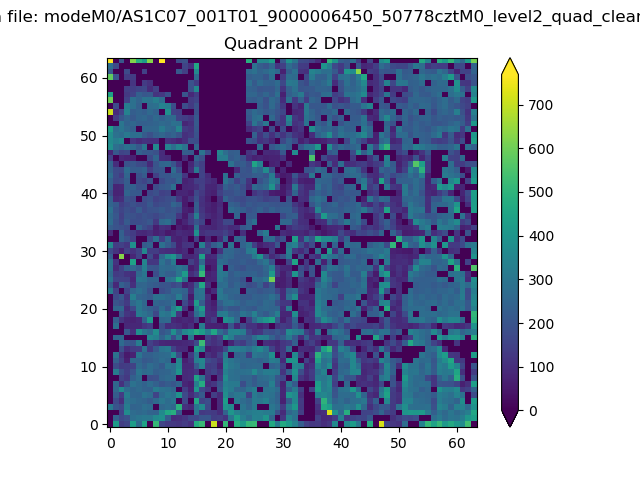
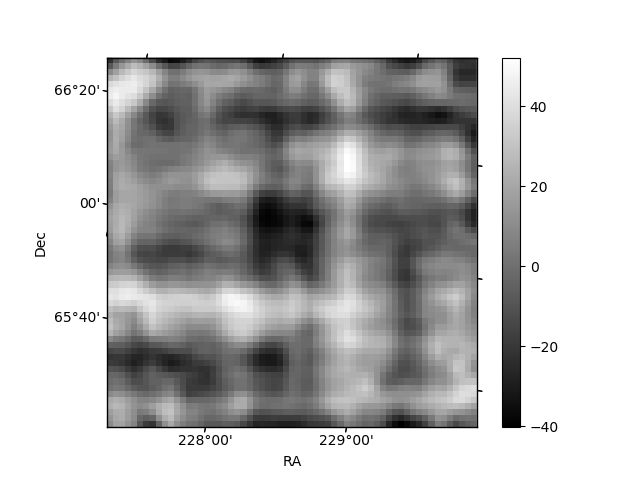
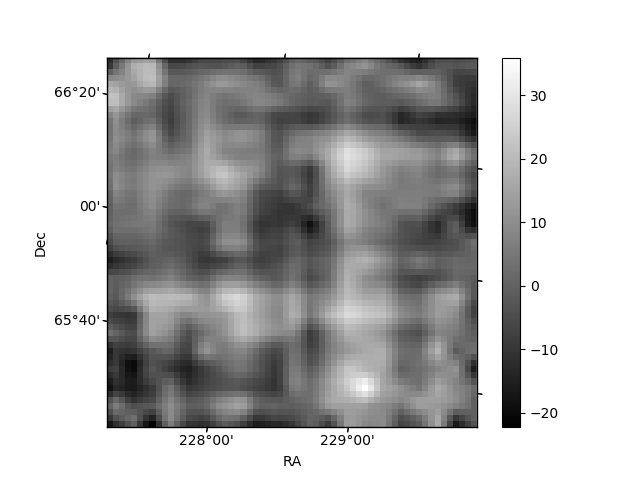
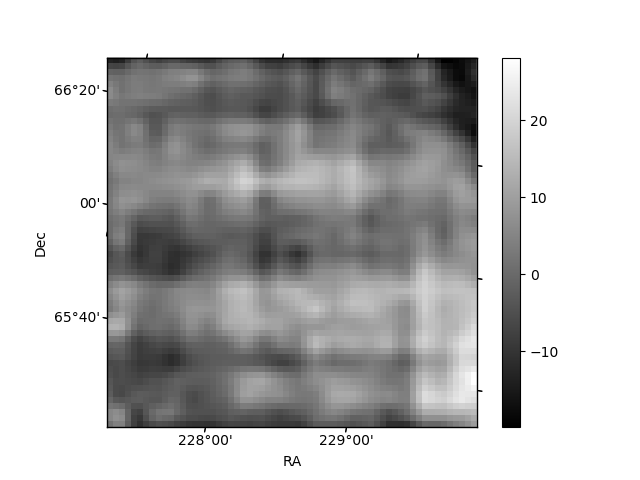
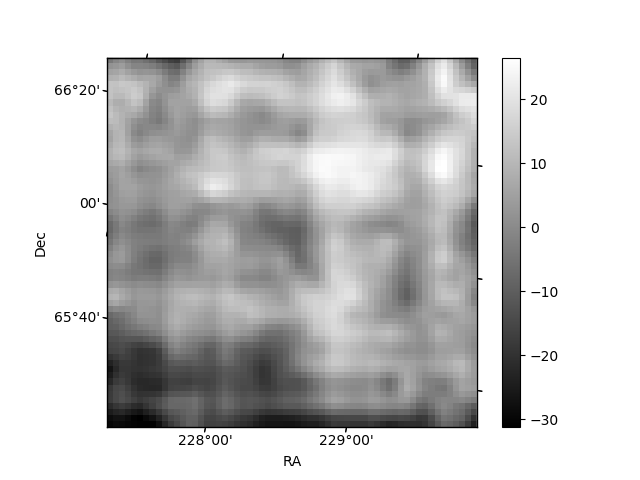
Histogram calculated using DETX and DETY for each event in the final _common_clean file
| Quadrant A | 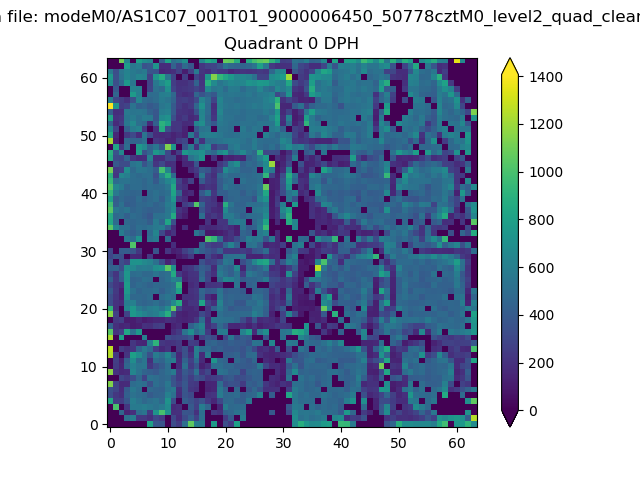 |
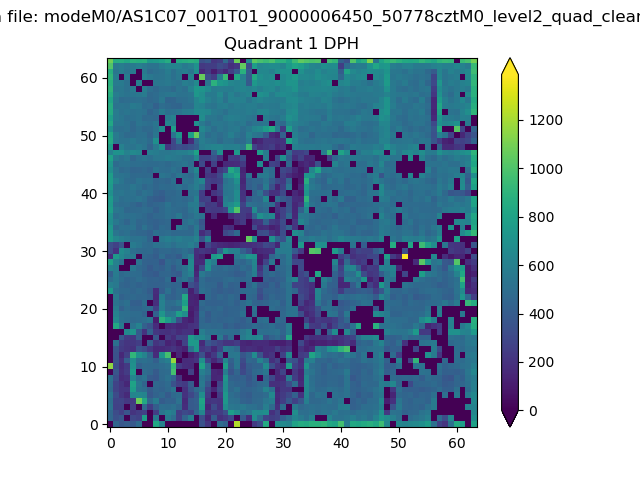 |
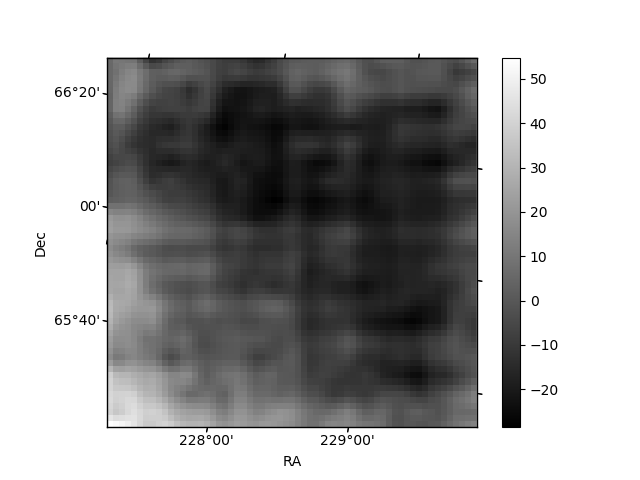
Quadrant B |
|---|---|---|---|
| Quadrant D | 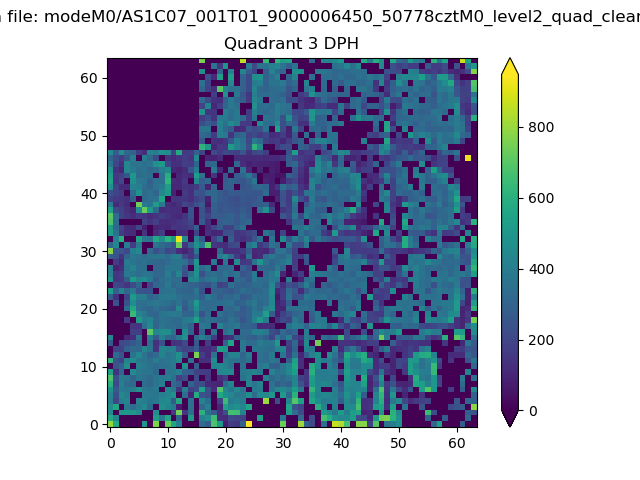 |
 |
Quadrant C |
| Plot type | Count rate plots | Images |
|---|---|---|
| Comparison with Poisson distribution Blue bars denote a histogram of data divided into 1 sec bins. Red curve is a Poisson curve with rate = median count rate of data. |
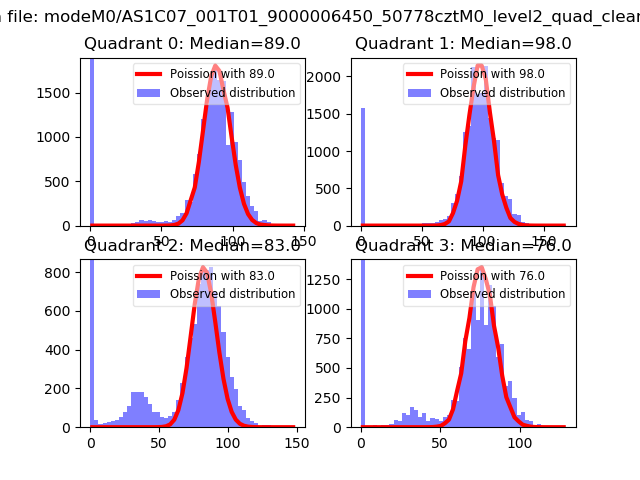 |
 |
| Quadrant-wise count rates Data is divided into 100 sec bins |
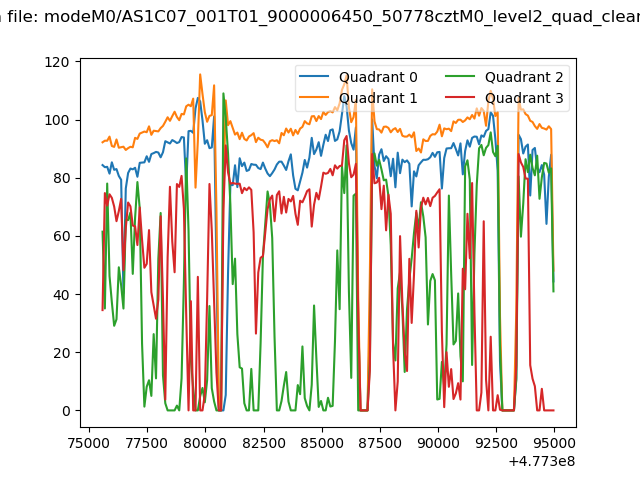 |
|
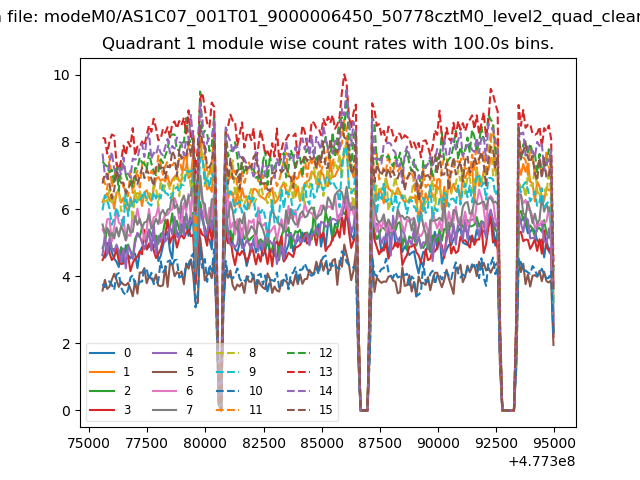
| Module-wise count rates for Quadrant A Data is divided into 100 sec bins |
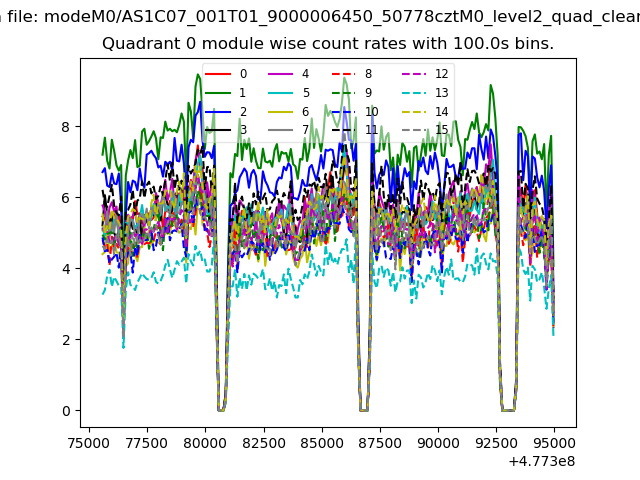 |
 |
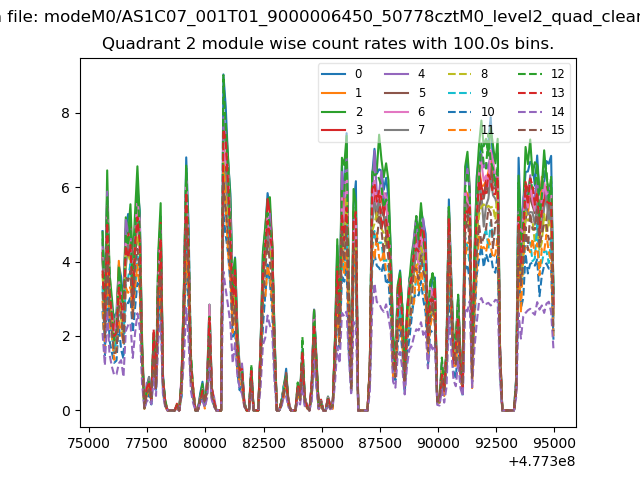
| Module-wise count rates for Quadrant B Data is divided into 100 sec bins |
 |
 |
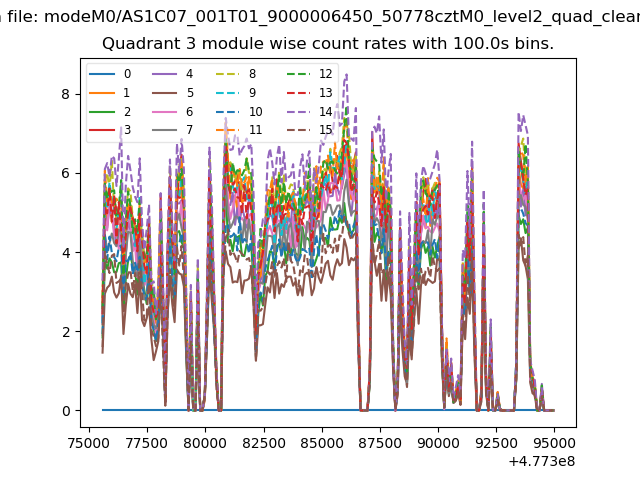
| Module-wise count rates for Quadrant C Data is divided into 100 sec bins |
 |
 |
| Module-wise count rates for Quadrant D Data is divided into 100 sec bins |
 |
 |
| Parameter | Plot |
|---|---|
| CZT HV Monitor | 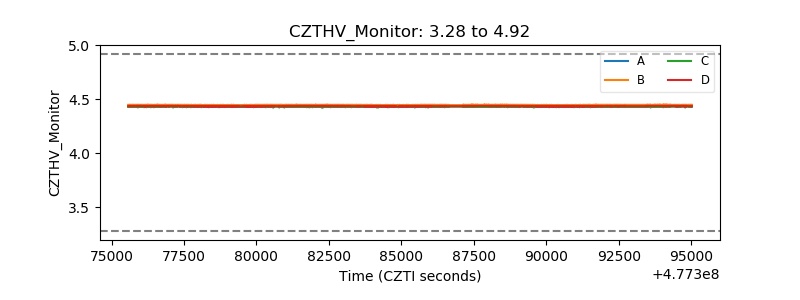 |
| D_VDD | 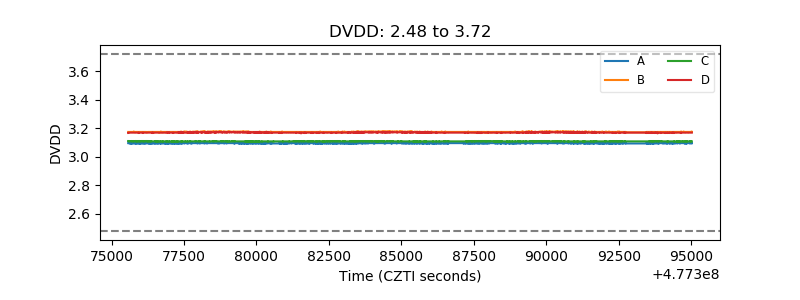 |
| Temperature 1 | 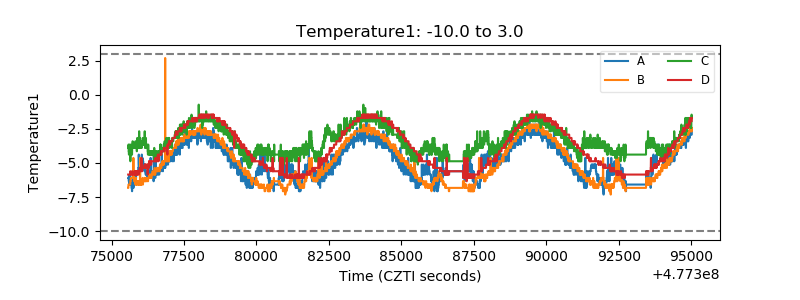 |
| Veto HV Monitor | 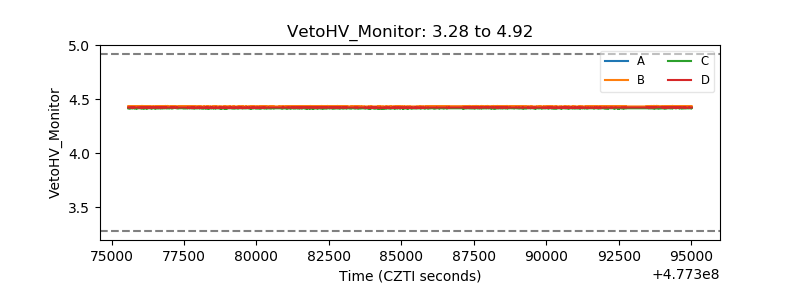 |
| Veto LLD | 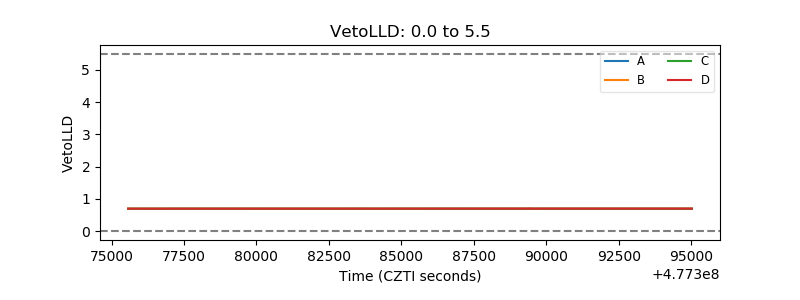 |
| Alpha Counter | 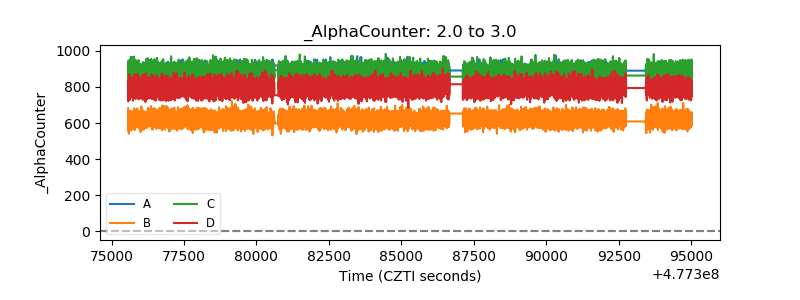 |
| _CPM_Rate | 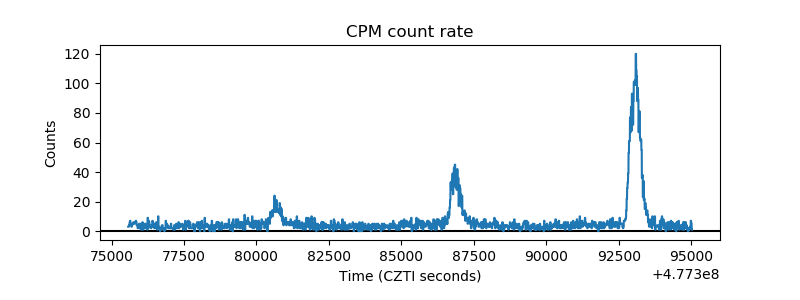 |
| CZT Counter | 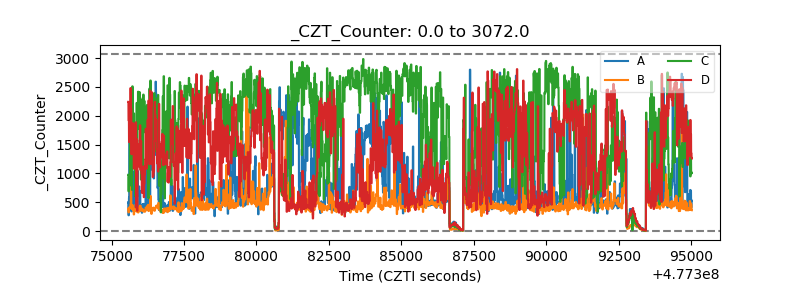 |
| +2.5 Volts monitor | 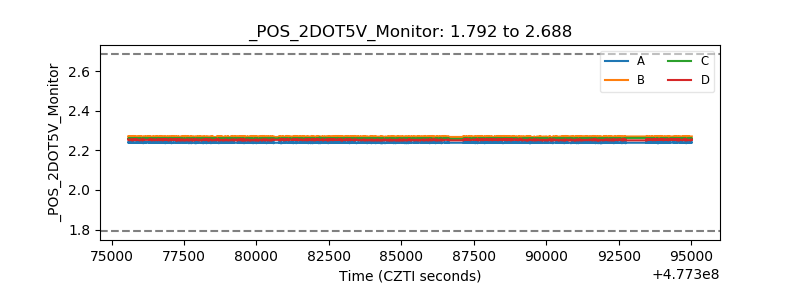 |
| +5 Volts monitor | 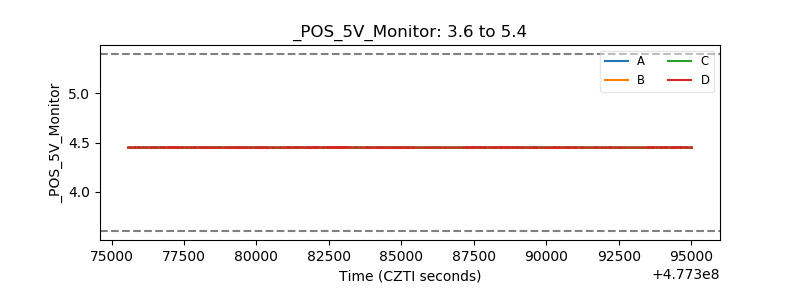 |
| _ROLL_ROT | 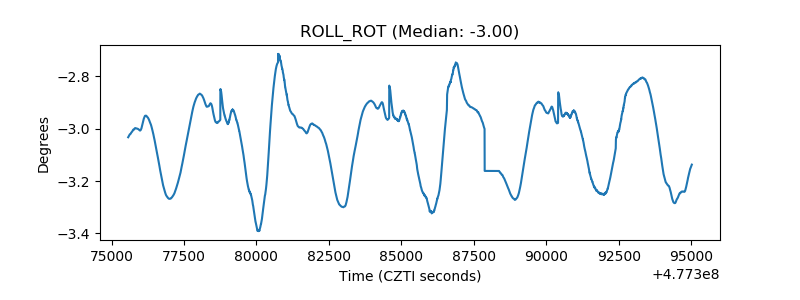 |
| _Roll_DEC | 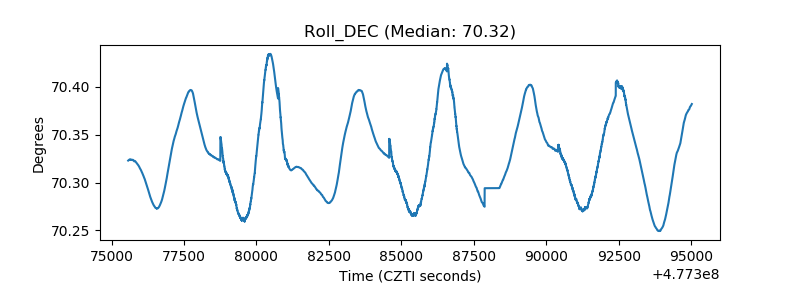 |
| _Roll_RA | 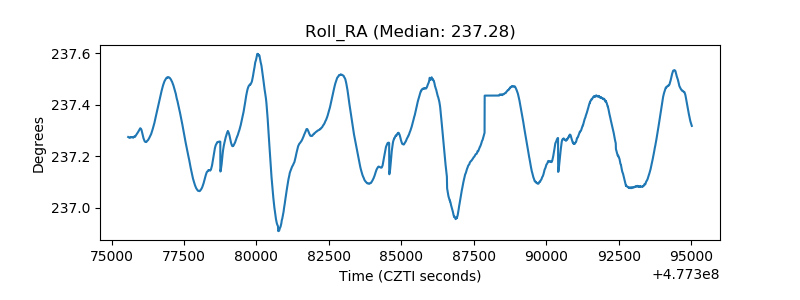 |
| Veto Counter | 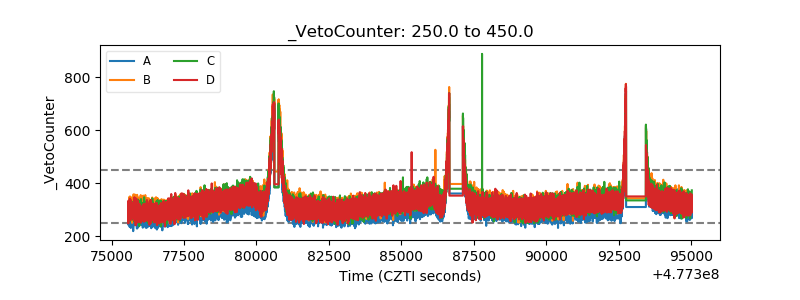 |