| Param | Original file | Final file |
|---|---|---|
| Filename | modeM0/AS1C07_001T01_9000006450_50779cztM0_level2.fits | modeM0/AS1C07_001T01_9000006450_50779cztM0_level2_quad_clean.evt |
| Size (bytes) | 654,500,160 | 88,260,480 |
| Size | 624.2 MB | 84.2 MB |
| Events in quadrant A | 5,469,500 | 577,818 |
| Events in quadrant B | 3,460,845 | 658,879 |
| Events in quadrant C | 6,313,949 | 567,321 |
| Events in quadrant D | 8,477,254 | 412,013 |
| Mode SS | |||
|---|---|---|---|
| Quadrant | BADHDUFLAG | Total packets | Discarded packets |
| A | 0 | 136 | 0 |
| B | 0 | 136 | 0 |
| C | 0 | 136 | 0 |
| D | 0 | 136 | 0 |
| Mode M0 | |||
|---|---|---|---|
| Quadrant | BADHDUFLAG | Total packets | Discarded packets |
| A | 0 | 20573 | 1 |
| B | 0 | 14917 | 1 |
| C | 0 | 23271 | 1 |
| D | 0 | 29693 | 1 |
| Mode M9 | |||
|---|---|---|---|
| Quadrant | BADHDUFLAG | Total packets | Discarded packets |
| A | 0 | 8 | 0 |
| B | 0 | 8 | 0 |
| C | 0 | 8 | 0 |
| D | 0 | 8 | 0 |
| Quadrant | Total seconds | Saturated seconds | Saturation percentage |
|---|---|---|---|
| A | 6531 | 600 | 9.186955% |
| B | 6531 | 141 | 2.158934% |
| C | 6531 | 324 | 4.960955% |
| D | 6531 | 1959 | 29.995407% |
Noise dominated data is calculated using 1-second bins in cleaned event files. If a bin has >2000 counts, and if more than 50% of those come from <1% of pixels, then it is considered to be noise-dominated and hence unusable.
| Quadrant | # 1 sec bins | Bins with >0 counts | Bins with >2000 counts | High rate bins dominated by noise | Noise dominated (total time) | Noise dominated (detector-on time) | Marked lightcurve |
|---|---|---|---|---|---|---|---|
| A | 7416 | 6532 | 415 | 415 | 5.60% | 6.35% | 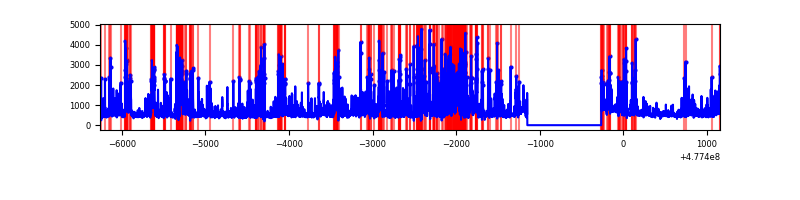 |
| B | 7416 | 6532 | 26 | 26 | 0.35% | 0.40% | 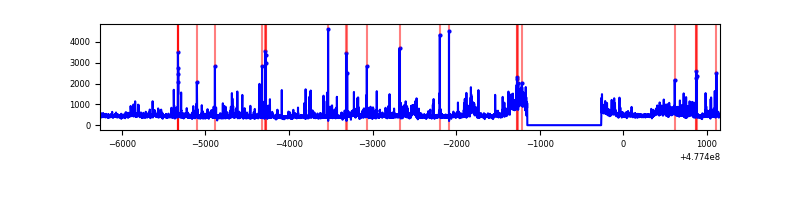 |
| C | 7416 | 6532 | 289 | 289 | 3.90% | 4.42% | 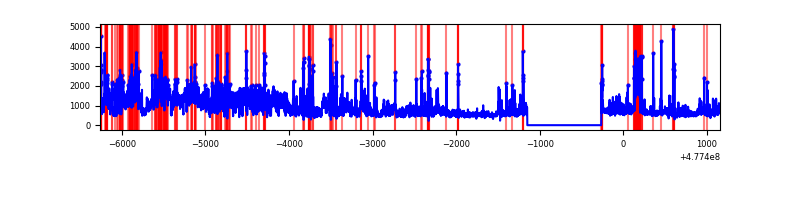 |
| D | 7416 | 6531 | 1300 | 1300 | 17.53% | 19.91% | 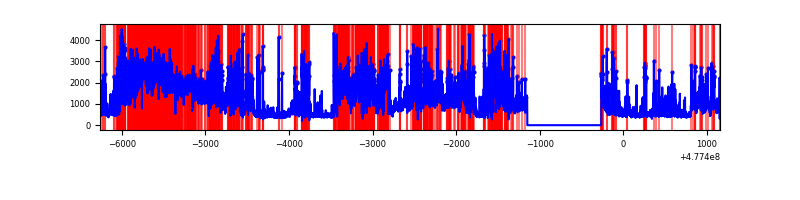 |
Top three noisy pixels from each quadrant. If the there are fewer than three noisy pixels in the level2.evt file, extra rows are filled as -1
| Pixel properties | Quadrant properties | ||||||
|---|---|---|---|---|---|---|---|
| Quadrant | DetID | PixID | Counts | Sigma | Mean | Median | Sigma |
| A | 4 | 249 | 1414028 | 8282.95 | 677 | 659 | 170.6 |
| A | 5 | 17 | 426258 | 2494.19 | 677 | 659 | 170.6 |
| A | 3 | 130 | 154244 | 900.07 | 677 | 659 | 170.6 |
| B | 3 | 249 | 193113 | 1316.25 | 682 | 658 | 146.2 |
| B | 4 | 170 | 89962 | 610.77 | 682 | 658 | 146.2 |
| B | 5 | 185 | 82705 | 561.14 | 682 | 658 | 146.2 |
| C | 5 | 10 | 2450931 | 13594.61 | 653 | 647 | 180.2 |
| C | 13 | 3 | 407000 | 2254.52 | 653 | 647 | 180.2 |
| C | 4 | 5 | 222386 | 1230.25 | 653 | 647 | 180.2 |
| D | 8 | 176 | 1505844 | 9118.42 | 583 | 563 | 165.1 |
| D | 8 | 242 | 1345944 | 8149.8 | 583 | 563 | 165.1 |
| D | 2 | 216 | 696992 | 4218.7 | 583 | 563 | 165.1 |
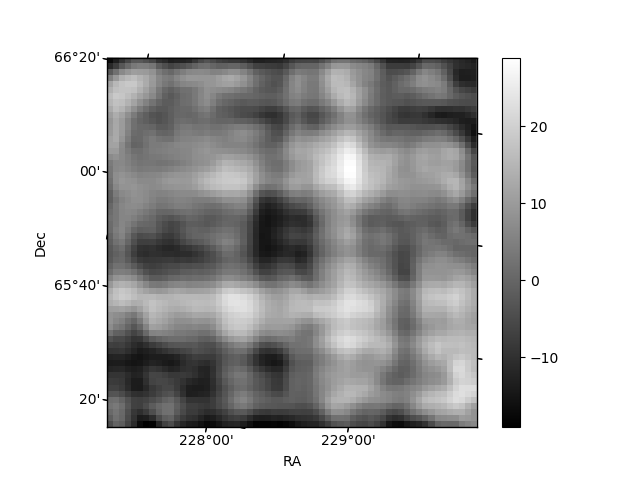
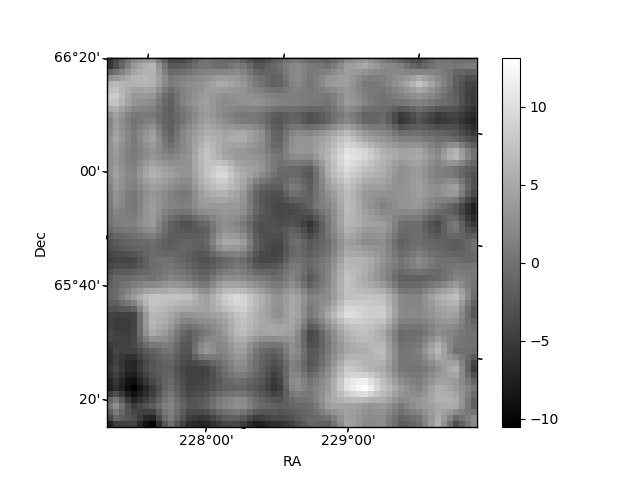
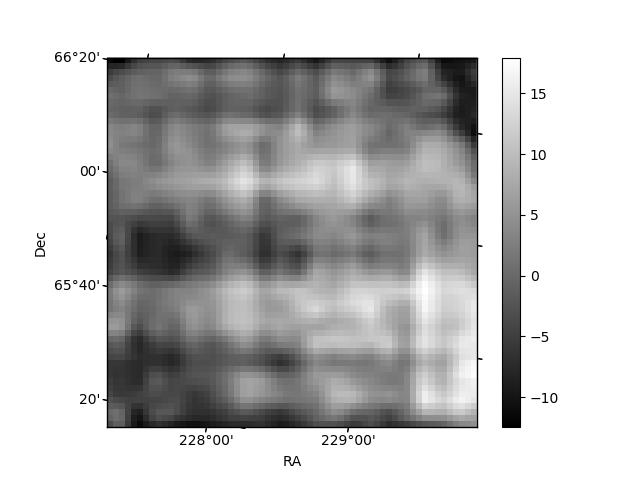
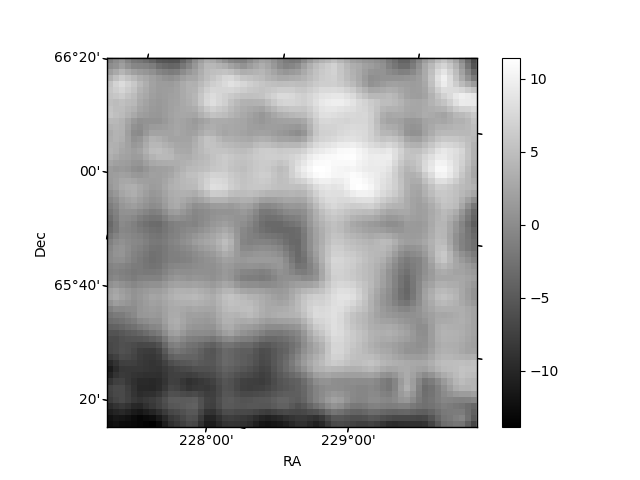
Histogram calculated using DETX and DETY for each event in the final _common_clean file
| Quadrant A | 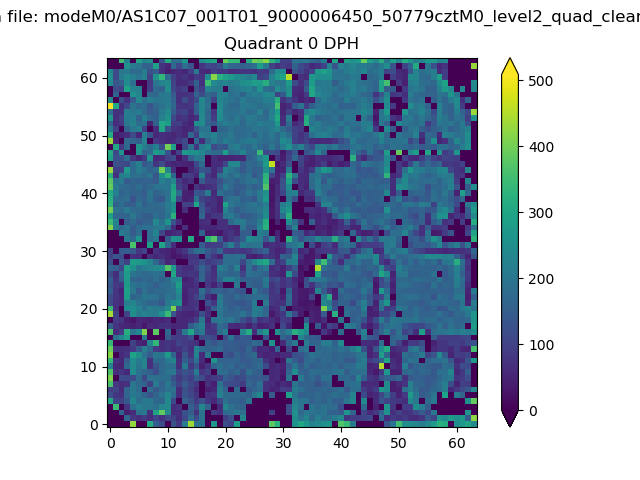 |
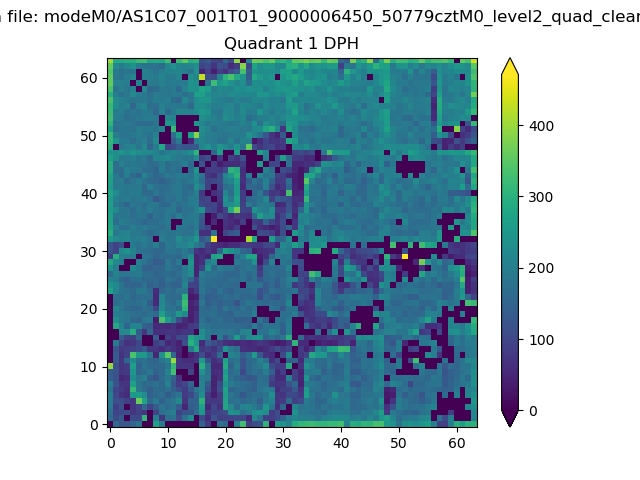 |
Quadrant B |
|---|---|---|---|
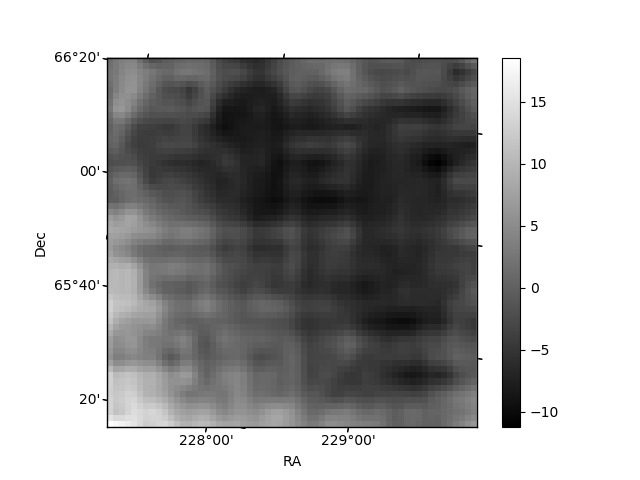
| Quadrant D | 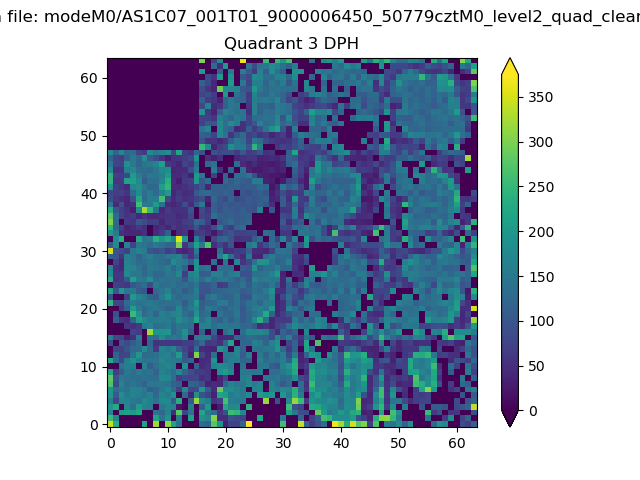 |
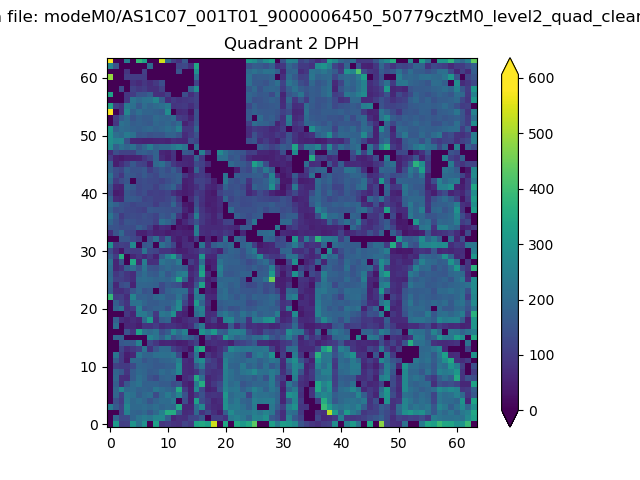 |
Quadrant C |
| Plot type | Count rate plots | Images |
|---|---|---|
| Comparison with Poisson distribution Blue bars denote a histogram of data divided into 1 sec bins. Red curve is a Poisson curve with rate = median count rate of data. |
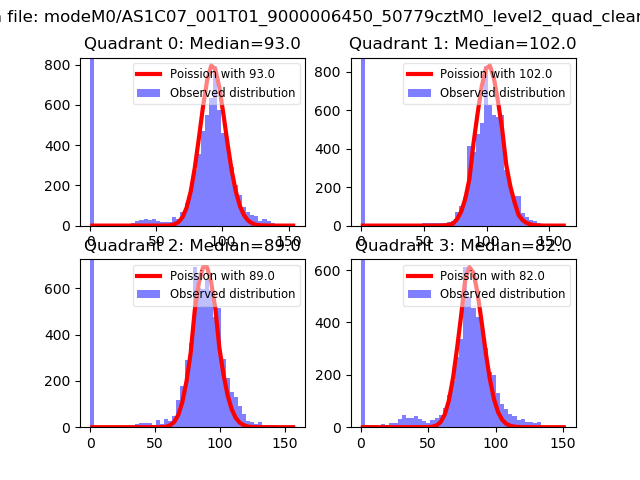 |
 |
| Quadrant-wise count rates Data is divided into 100 sec bins |
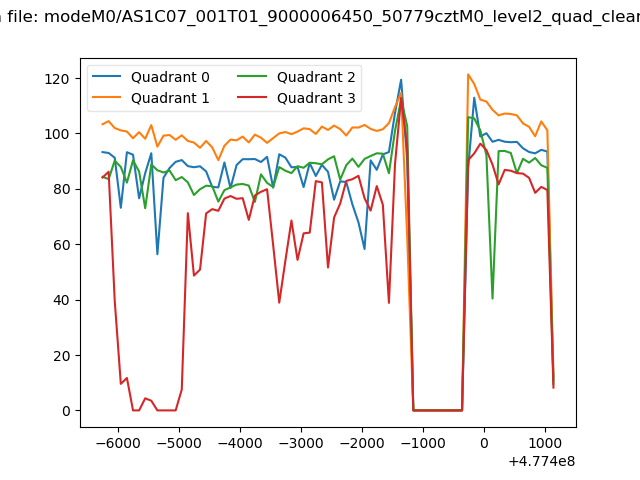 |
|
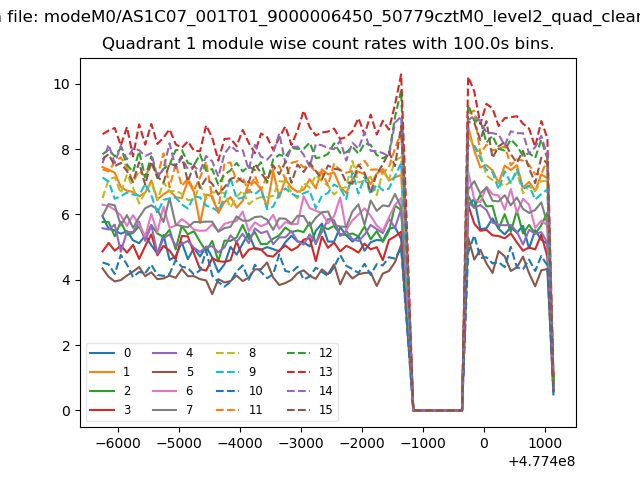
| Module-wise count rates for Quadrant A Data is divided into 100 sec bins |
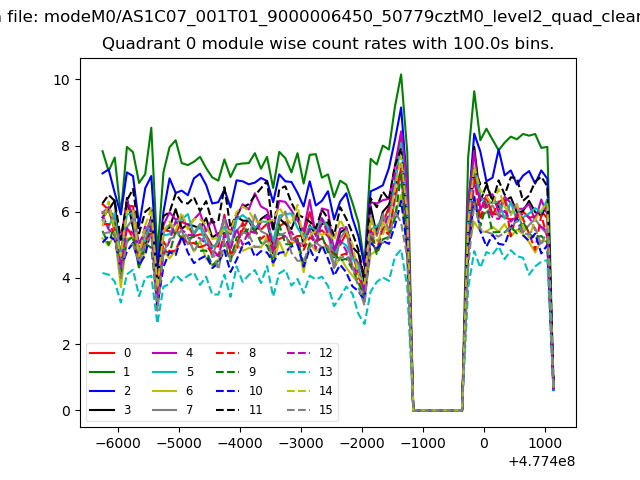 |
 |
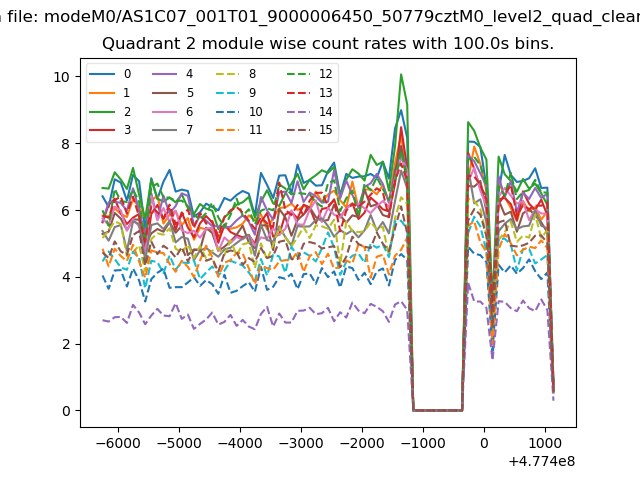
| Module-wise count rates for Quadrant B Data is divided into 100 sec bins |
 |
 |
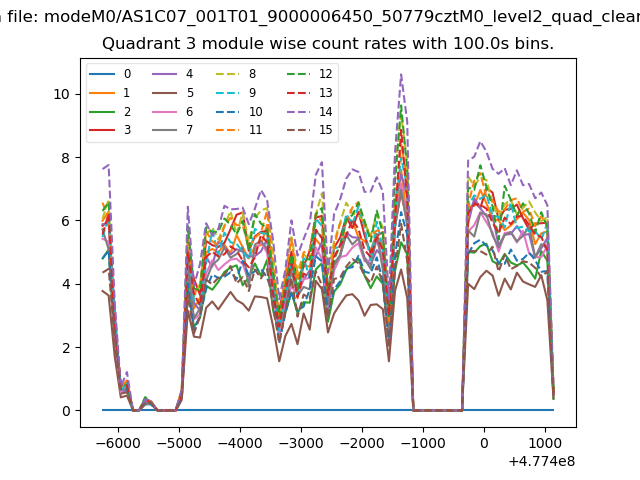
| Module-wise count rates for Quadrant C Data is divided into 100 sec bins |
 |
 |
| Module-wise count rates for Quadrant D Data is divided into 100 sec bins |
 |
 |
| Parameter | Plot |
|---|---|
| CZT HV Monitor | 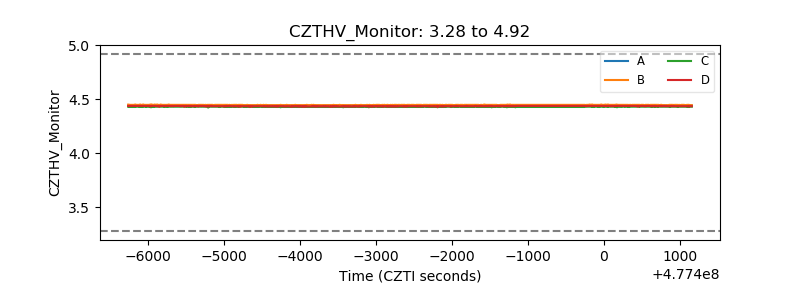 |
| D_VDD | 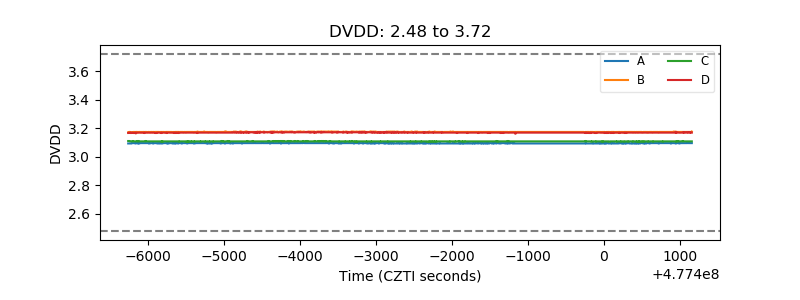 |
| Temperature 1 | 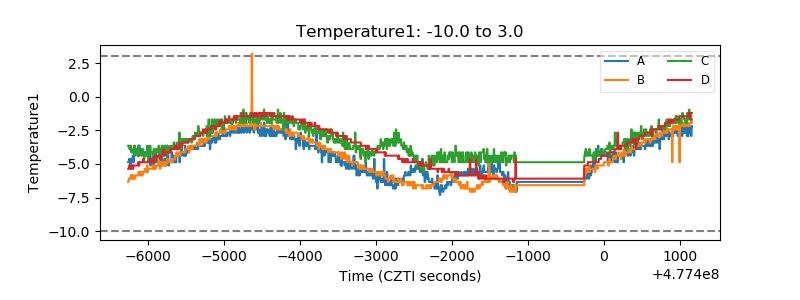 |
| Veto HV Monitor | 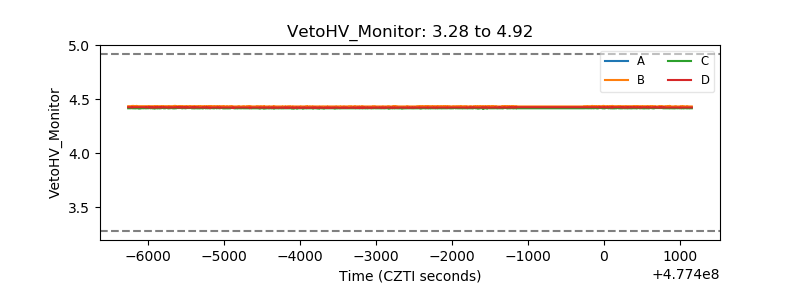 |
| Veto LLD | 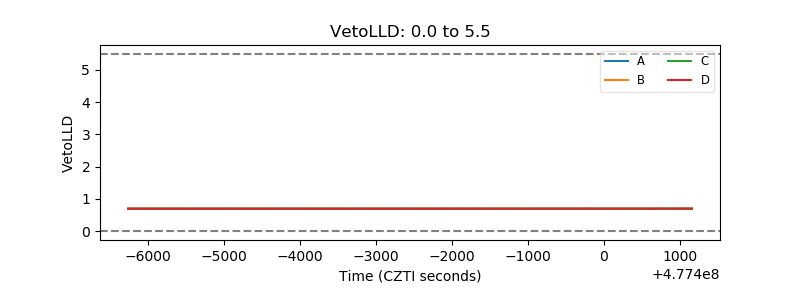 |
| Alpha Counter | 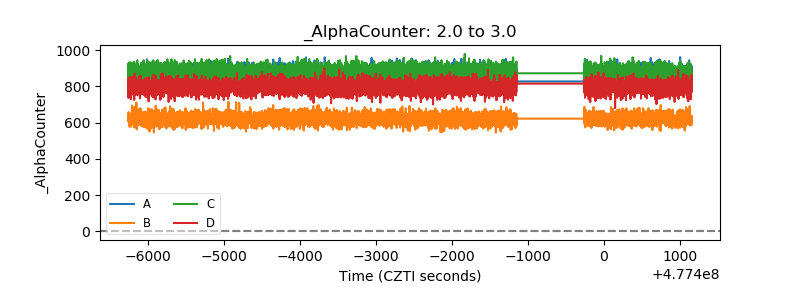 |
| _CPM_Rate | 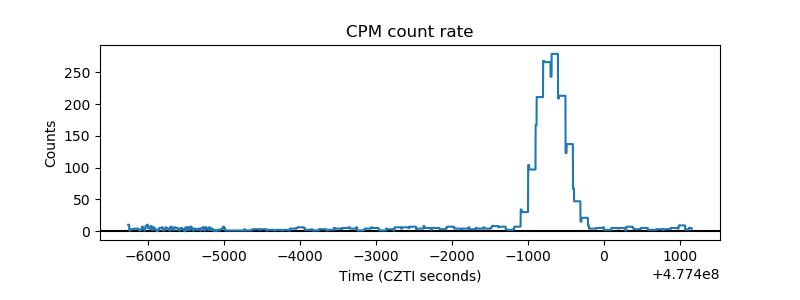 |
| CZT Counter | 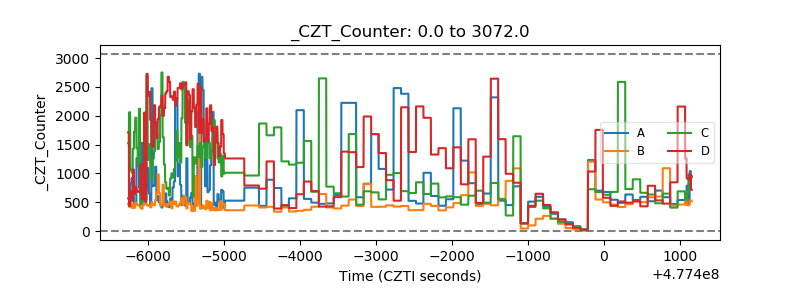 |
| +2.5 Volts monitor |  |
| +5 Volts monitor |  |
| _ROLL_ROT | 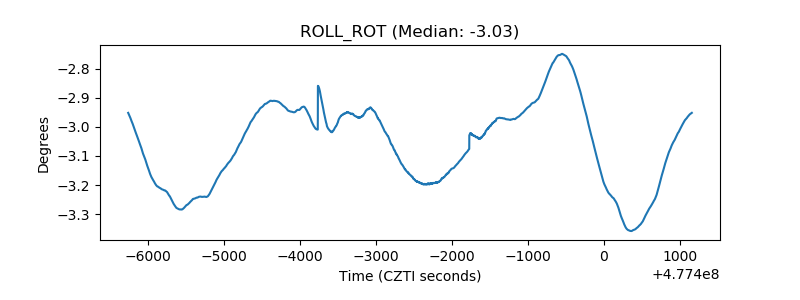 |
| _Roll_DEC | 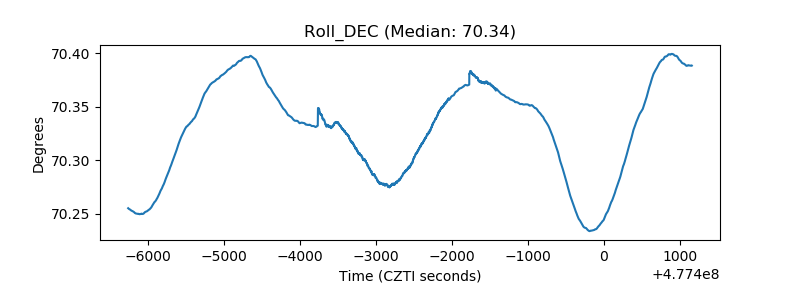 |
| _Roll_RA | 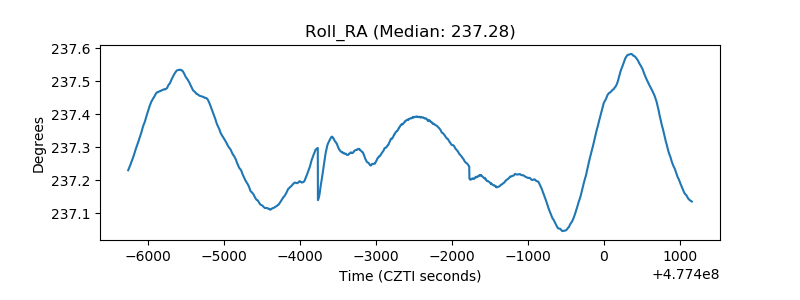 |
| Veto Counter | 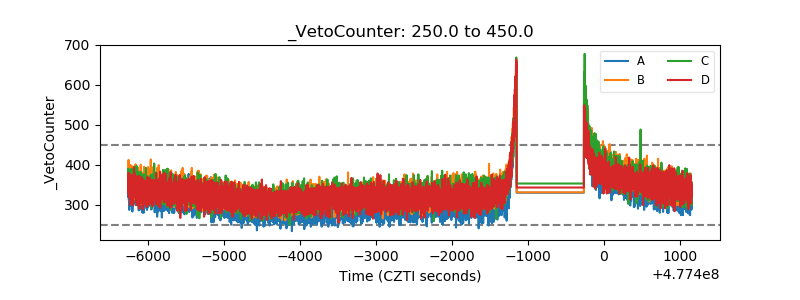 |