| Param | Original file | Final file |
|---|---|---|
| Filename | modeM0/AS1C07_001T01_9000006450_50782cztM0_level2.fits | modeM0/AS1C07_001T01_9000006450_50782cztM0_level2_quad_clean.evt |
| Size (bytes) | 601,729,920 | 94,089,600 |
| Size | 573.9 MB | 89.7 MB |
| Events in quadrant A | 3,835,242 | 630,362 |
| Events in quadrant B | 3,782,817 | 690,689 |
| Events in quadrant C | 6,811,107 | 574,365 |
| Events in quadrant D | 7,337,400 | 496,220 |
| Mode SS | |||
|---|---|---|---|
| Quadrant | BADHDUFLAG | Total packets | Discarded packets |
| A | 0 | 134 | 0 |
| B | 0 | 134 | 0 |
| C | 0 | 134 | 0 |
| D | 0 | 134 | 0 |
| Mode M0 | |||
|---|---|---|---|
| Quadrant | BADHDUFLAG | Total packets | Discarded packets |
| A | 0 | 15726 | 1 |
| B | 0 | 15735 | 1 |
| C | 0 | 24886 | 1 |
| D | 0 | 26329 | 1 |
| Mode M9 | |||
|---|---|---|---|
| Quadrant | BADHDUFLAG | Total packets | Discarded packets |
| A | 0 | 10 | 0 |
| B | 0 | 10 | 0 |
| C | 0 | 10 | 0 |
| D | 0 | 10 | 0 |
| Quadrant | Total seconds | Saturated seconds | Saturation percentage |
|---|---|---|---|
| A | 6553 | 231 | 3.525103% |
| B | 6553 | 163 | 2.487410% |
| C | 6554 | 623 | 9.505645% |
| D | 6554 | 998 | 15.227342% |
Noise dominated data is calculated using 1-second bins in cleaned event files. If a bin has >2000 counts, and if more than 50% of those come from <1% of pixels, then it is considered to be noise-dominated and hence unusable.
| Quadrant | # 1 sec bins | Bins with >0 counts | Bins with >2000 counts | High rate bins dominated by noise | Noise dominated (total time) | Noise dominated (detector-on time) | Marked lightcurve |
|---|---|---|---|---|---|---|---|
| A | 7608 | 6553 | 108 | 108 | 1.42% | 1.65% | 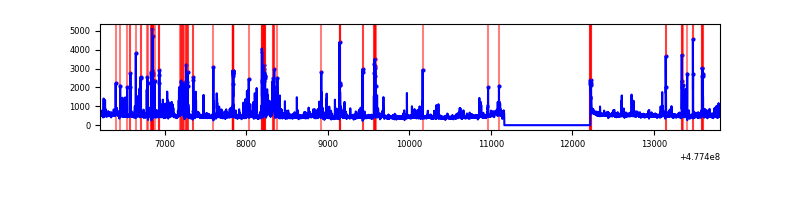 |
| B | 7608 | 6553 | 28 | 28 | 0.37% | 0.43% | 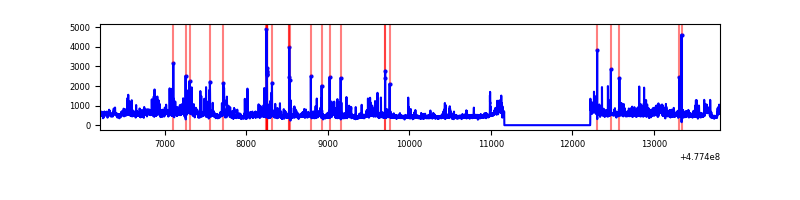 |
| C | 7609 | 6554 | 507 | 507 | 6.66% | 7.74% | 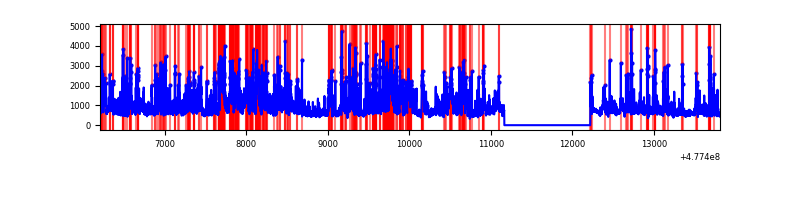 |
| D | 7609 | 6554 | 928 | 928 | 12.20% | 14.16% | 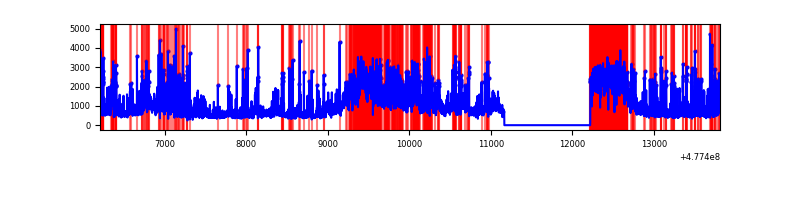 |
Top three noisy pixels from each quadrant. If the there are fewer than three noisy pixels in the level2.evt file, extra rows are filled as -1
| Pixel properties | Quadrant properties | ||||||
|---|---|---|---|---|---|---|---|
| Quadrant | DetID | PixID | Counts | Sigma | Mean | Median | Sigma |
| A | 4 | 249 | 267648 | 1507.77 | 711 | 695 | 177.1 |
| A | 5 | 17 | 139227 | 782.44 | 711 | 695 | 177.1 |
| A | 4 | 3 | 101415 | 568.87 | 711 | 695 | 177.1 |
| B | 4 | 170 | 405239 | 2677.31 | 707 | 682 | 151.1 |
| B | 5 | 185 | 112937 | 742.89 | 707 | 682 | 151.1 |
| B | 10 | 247 | 63901 | 418.37 | 707 | 682 | 151.1 |
| C | 5 | 10 | 1938905 | 10379.18 | 678 | 671 | 186.7 |
| C | 15 | 230 | 1266176 | 6776.74 | 678 | 671 | 186.7 |
| C | 4 | 5 | 217293 | 1160.0 | 678 | 671 | 186.7 |
| D | 8 | 176 | 2461933 | 13501.03 | 655 | 632 | 182.3 |
| D | 15 | 174 | 499860 | 2738.43 | 655 | 632 | 182.3 |
| D | 2 | 216 | 455528 | 2495.25 | 655 | 632 | 182.3 |
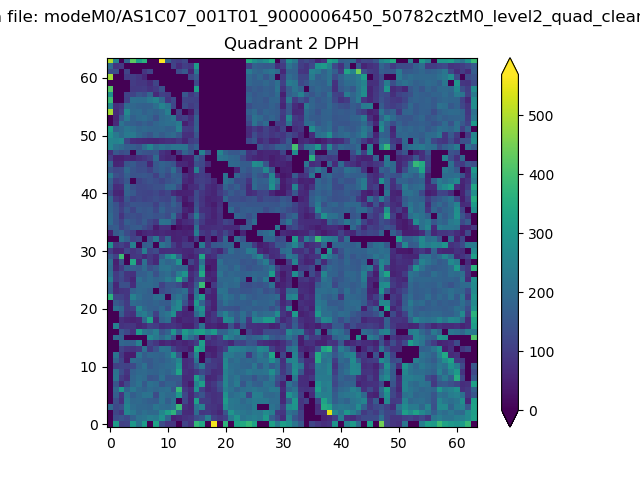
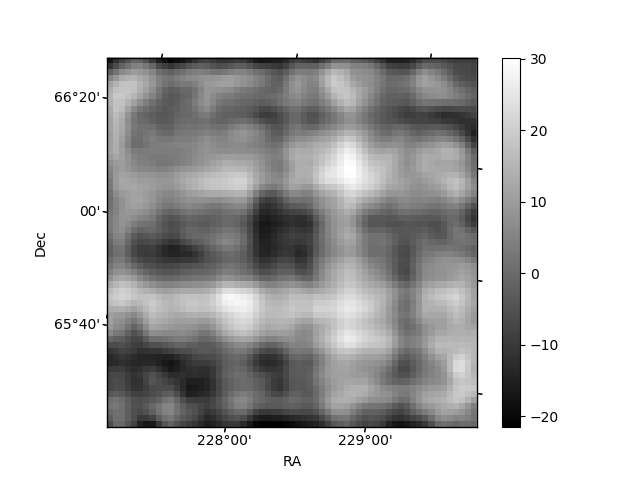
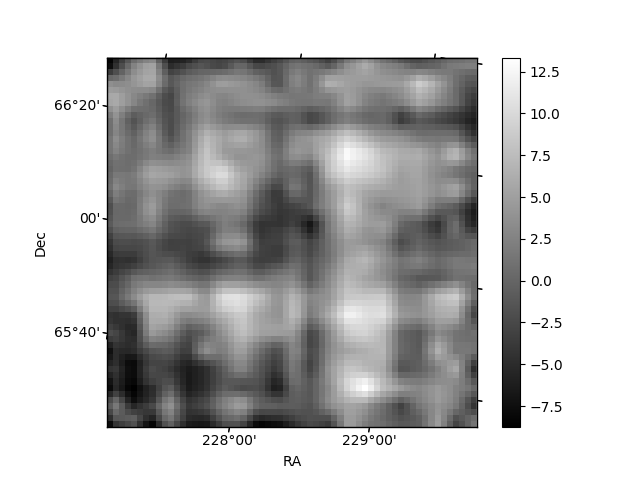
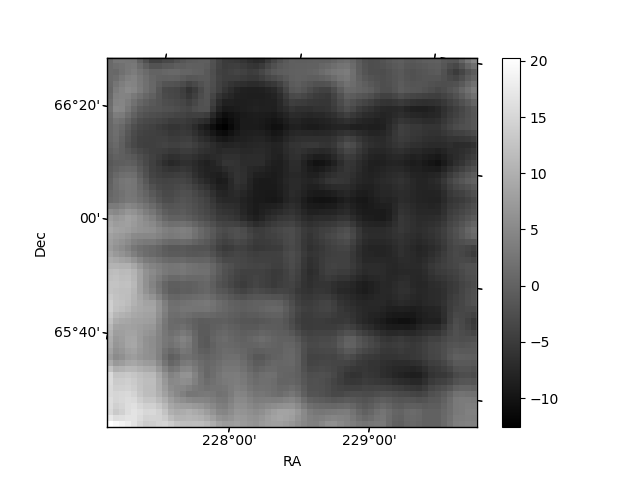
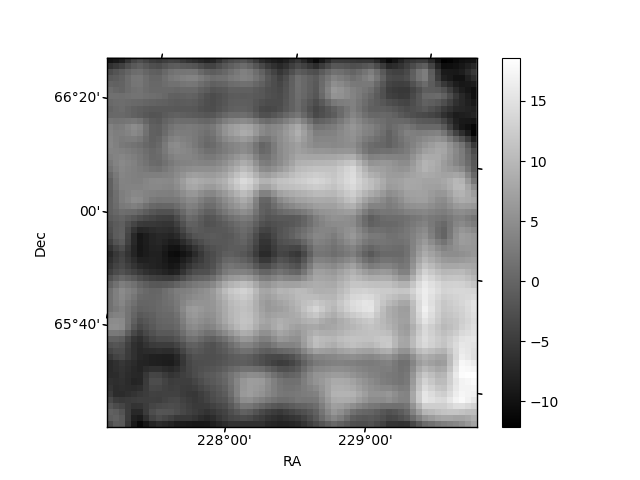
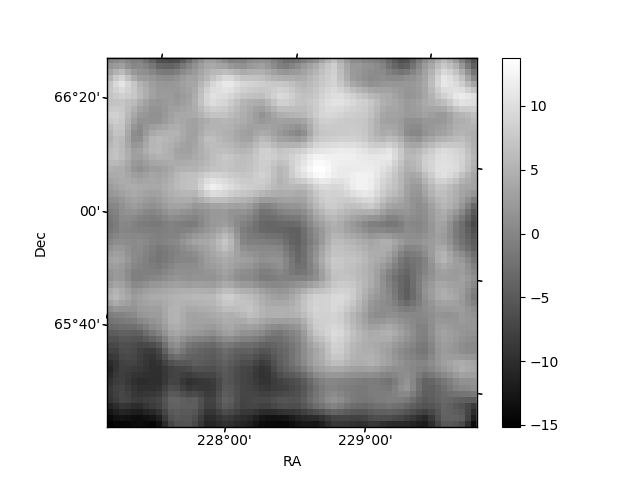
Histogram calculated using DETX and DETY for each event in the final _common_clean file
| Quadrant A | 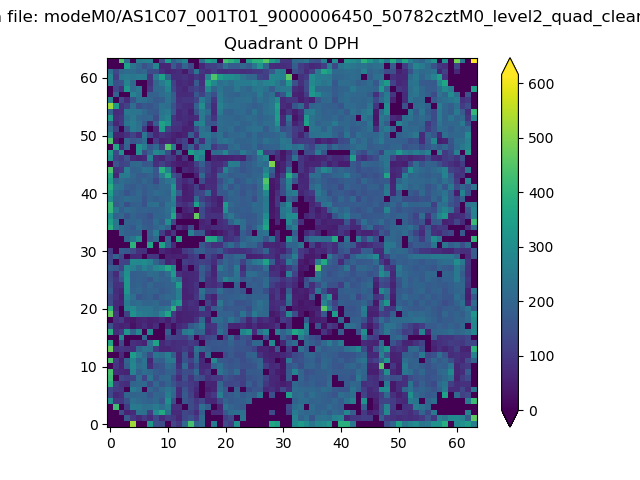 |
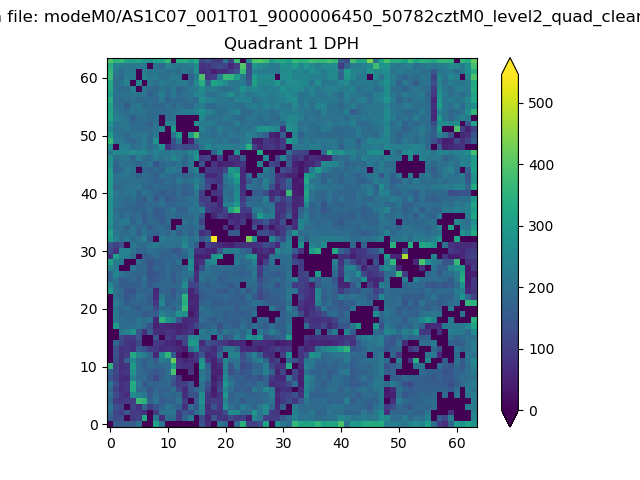 |
Quadrant B |
|---|---|---|---|
| Quadrant D | 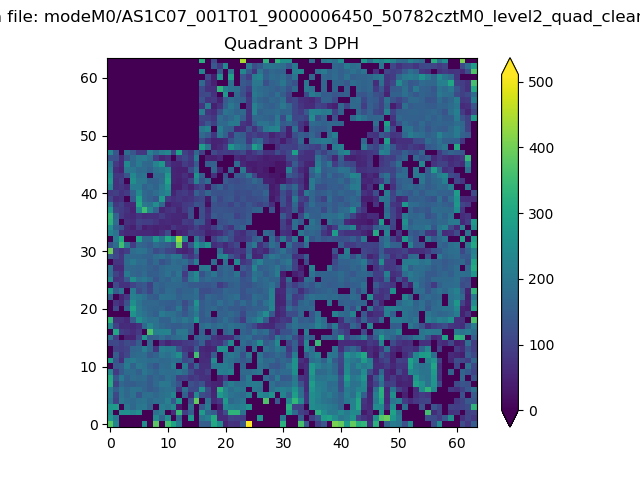 |
 |
Quadrant C |
| Plot type | Count rate plots | Images |
|---|---|---|
| Comparison with Poisson distribution Blue bars denote a histogram of data divided into 1 sec bins. Red curve is a Poisson curve with rate = median count rate of data. |
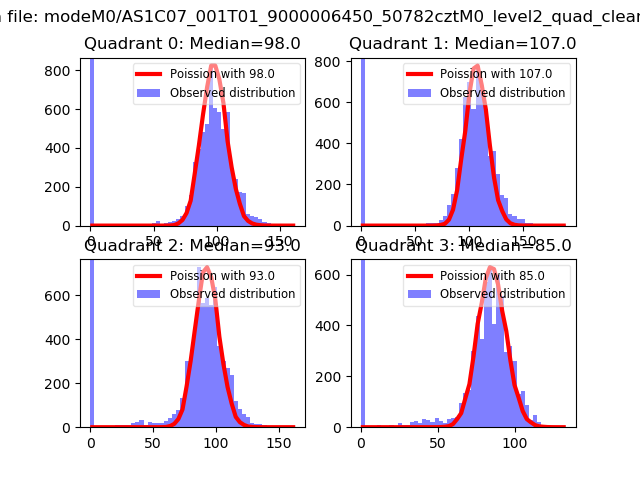 |
 |
| Quadrant-wise count rates Data is divided into 100 sec bins |
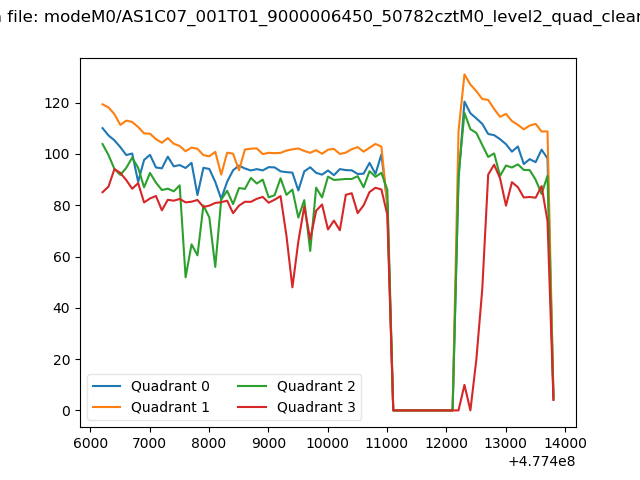 |
|
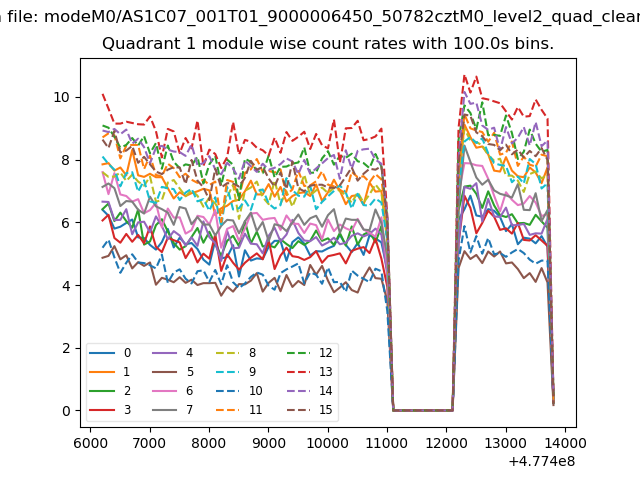
| Module-wise count rates for Quadrant A Data is divided into 100 sec bins |
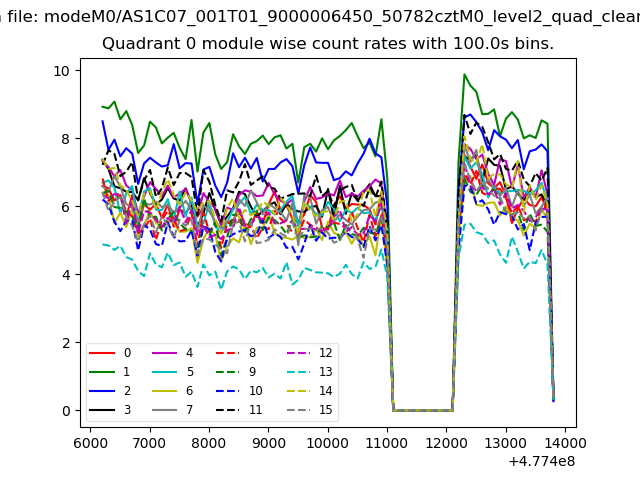 |
 |
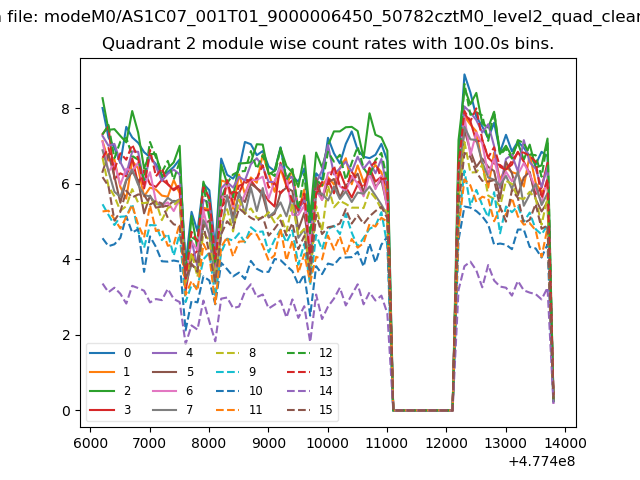
| Module-wise count rates for Quadrant B Data is divided into 100 sec bins |
 |
 |
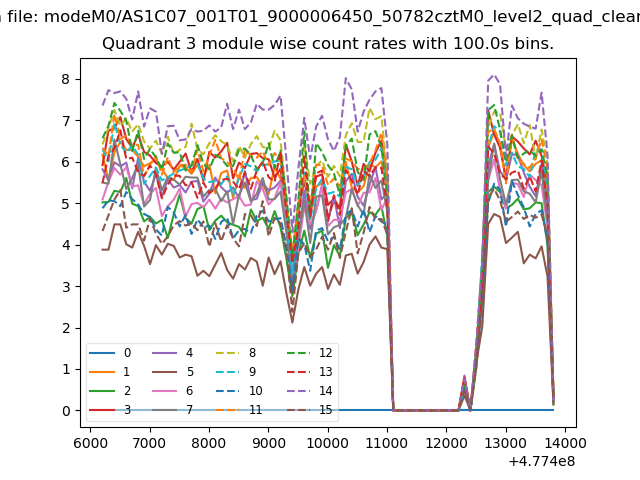
| Module-wise count rates for Quadrant C Data is divided into 100 sec bins |
 |
 |
| Module-wise count rates for Quadrant D Data is divided into 100 sec bins |
 |
 |
| Parameter | Plot |
|---|---|
| CZT HV Monitor | 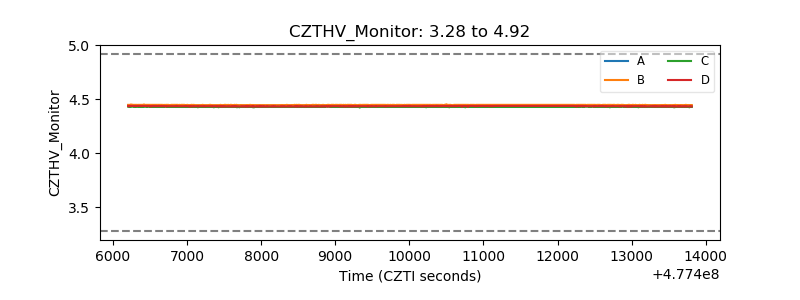 |
| D_VDD |  |
| Temperature 1 | 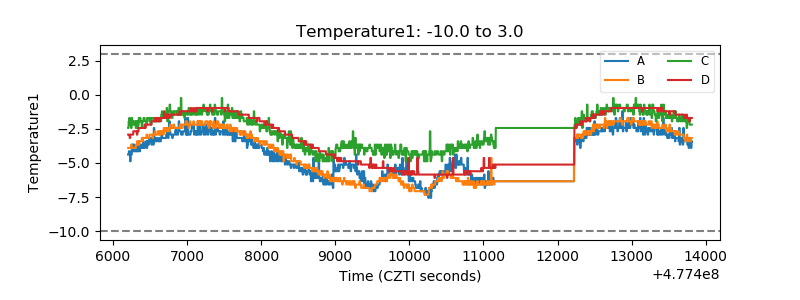 |
| Veto HV Monitor | 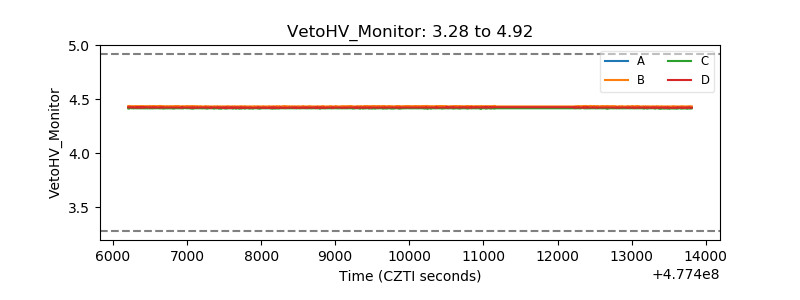 |
| Veto LLD | 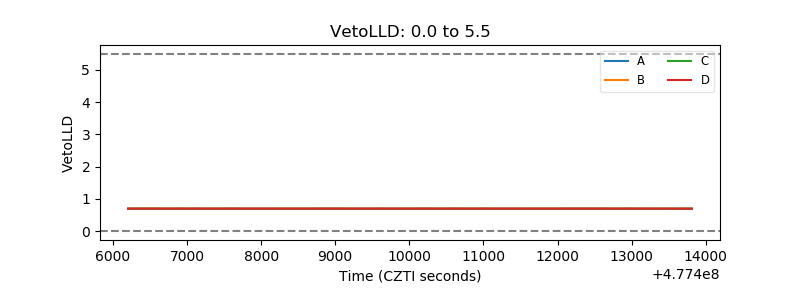 |
| Alpha Counter | 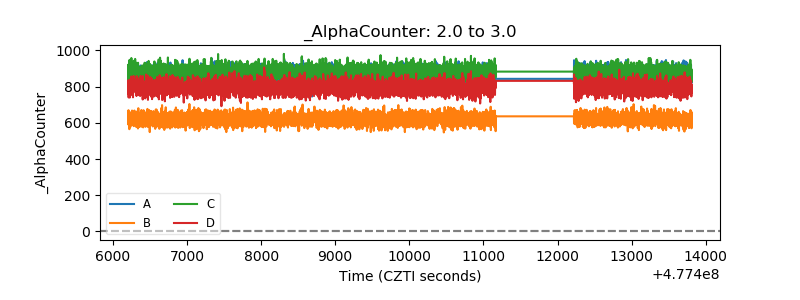 |
| _CPM_Rate | 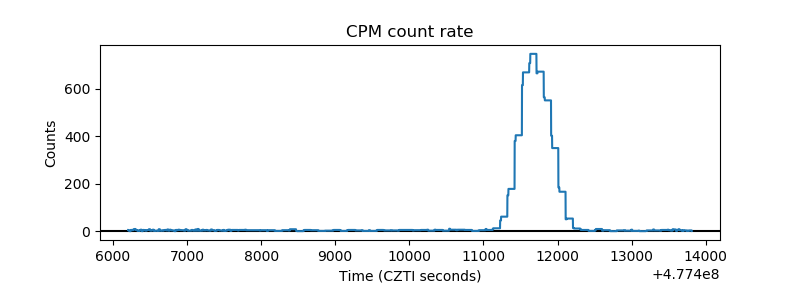 |
| CZT Counter | 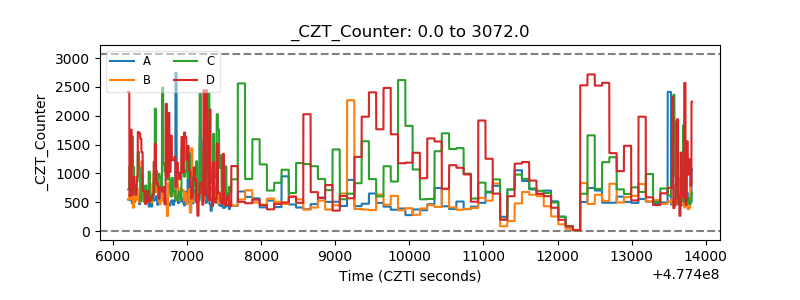 |
| +2.5 Volts monitor | 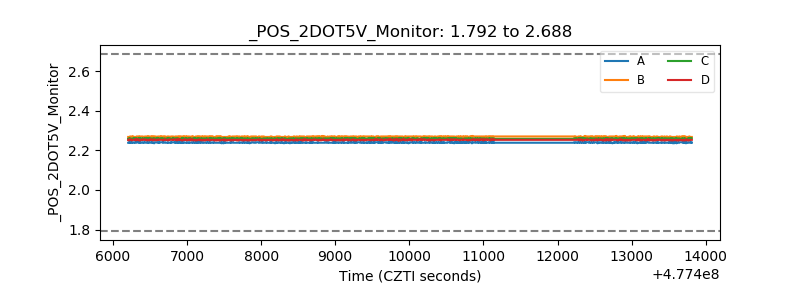 |
| +5 Volts monitor | 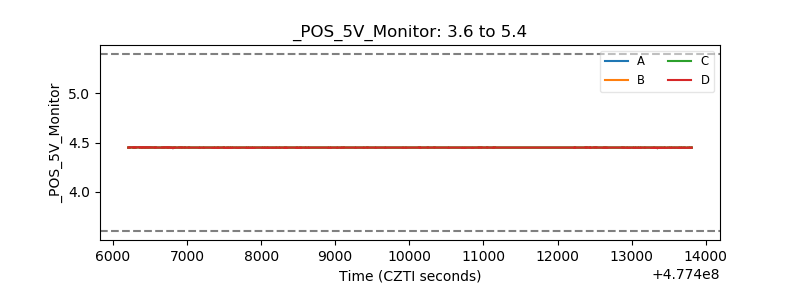 |
| _ROLL_ROT | 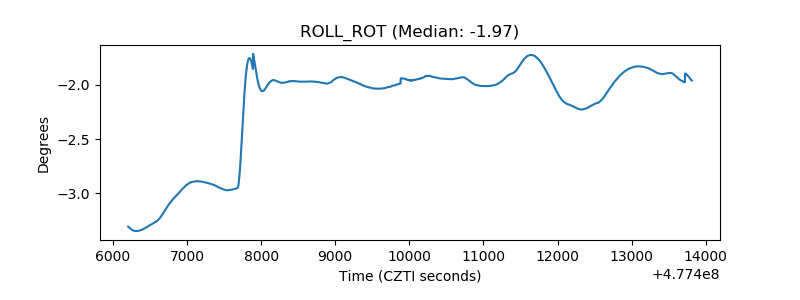 |
| _Roll_DEC | 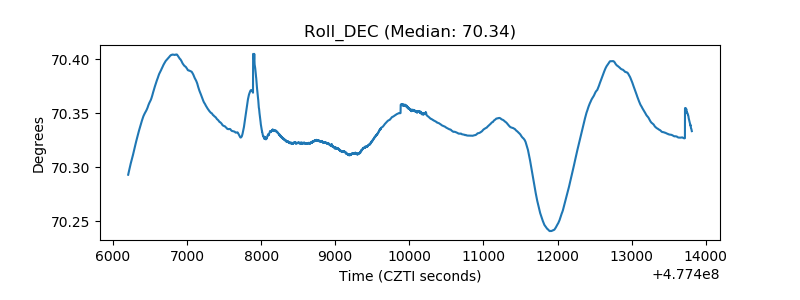 |
| _Roll_RA | 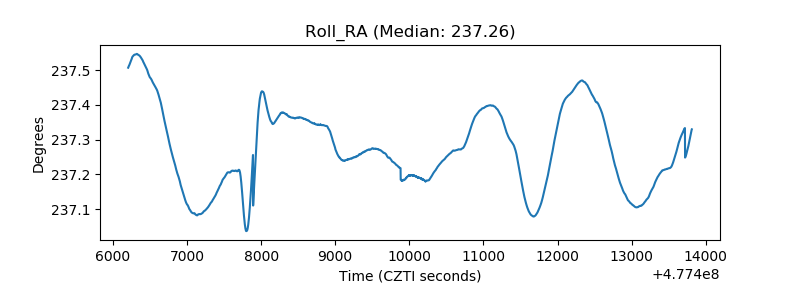 |
| Veto Counter | 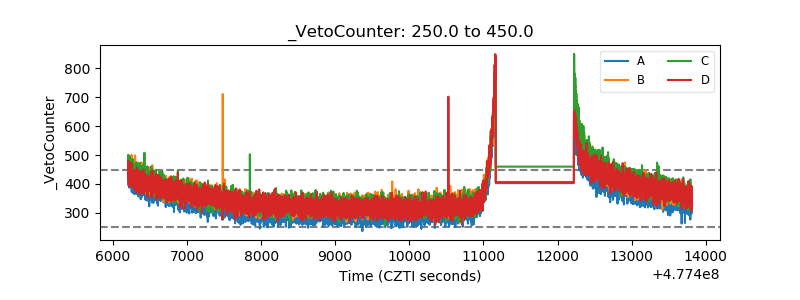 |