| Param | Original file | Final file |
|---|---|---|
| Filename | modeM0/AS1C07_001T01_9000006450_50783cztM0_level2.fits | modeM0/AS1C07_001T01_9000006450_50783cztM0_level2_quad_clean.evt |
| Size (bytes) | 567,596,160 | 81,178,560 |
| Size | 541.3 MB | 77.4 MB |
| Events in quadrant A | 3,441,664 | 558,848 |
| Events in quadrant B | 3,239,080 | 617,172 |
| Events in quadrant C | 5,511,769 | 503,372 |
| Events in quadrant D | 8,372,401 | 376,830 |
| Mode SS | |||
|---|---|---|---|
| Quadrant | BADHDUFLAG | Total packets | Discarded packets |
| A | 0 | 116 | 0 |
| B | 0 | 116 | 0 |
| C | 0 | 116 | 0 |
| D | 0 | 116 | 0 |
| Mode M0 | |||
|---|---|---|---|
| Quadrant | BADHDUFLAG | Total packets | Discarded packets |
| A | 0 | 14081 | 1 |
| B | 0 | 13559 | 1 |
| C | 0 | 20346 | 2 |
| D | 0 | 28795 | 1 |
| Mode M9 | |||
|---|---|---|---|
| Quadrant | BADHDUFLAG | Total packets | Discarded packets |
| A | 0 | 12 | 0 |
| B | 0 | 12 | 0 |
| C | 0 | 12 | 0 |
| D | 0 | 12 | 0 |
| Quadrant | Total seconds | Saturated seconds | Saturation percentage |
|---|---|---|---|
| A | 5748 | 190 | 3.305498% |
| B | 5748 | 106 | 1.844120% |
| C | 5748 | 627 | 10.908142% |
| D | 5748 | 1748 | 30.410578% |
Noise dominated data is calculated using 1-second bins in cleaned event files. If a bin has >2000 counts, and if more than 50% of those come from <1% of pixels, then it is considered to be noise-dominated and hence unusable.
| Quadrant | # 1 sec bins | Bins with >0 counts | Bins with >2000 counts | High rate bins dominated by noise | Noise dominated (total time) | Noise dominated (detector-on time) | Marked lightcurve |
|---|---|---|---|---|---|---|---|
| A | 6928 | 5749 | 100 | 100 | 1.44% | 1.74% | 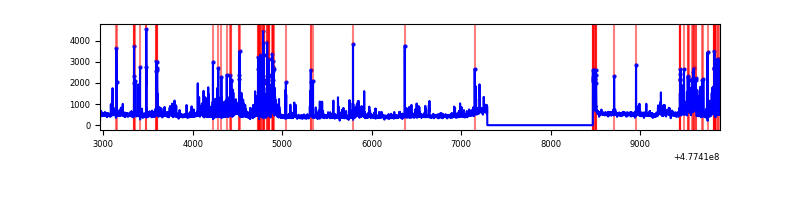 |
| B | 6928 | 5749 | 26 | 26 | 0.38% | 0.45% | 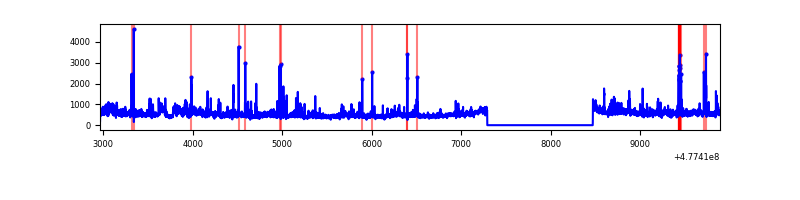 |
| C | 6928 | 5749 | 497 | 497 | 7.17% | 8.64% | 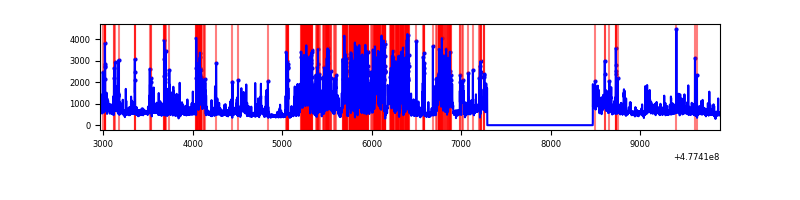 |
| D | 6928 | 5749 | 1706 | 1706 | 24.62% | 29.67% | 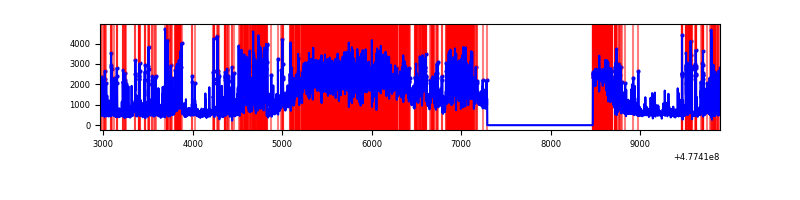 |
Top three noisy pixels from each quadrant. If the there are fewer than three noisy pixels in the level2.evt file, extra rows are filled as -1
| Pixel properties | Quadrant properties | ||||||
|---|---|---|---|---|---|---|---|
| Quadrant | DetID | PixID | Counts | Sigma | Mean | Median | Sigma |
| A | 8 | 248 | 171602 | 1115.85 | 618 | 603 | 153.2 |
| A | 3 | 114 | 78999 | 511.57 | 618 | 603 | 153.2 |
| A | 4 | 3 | 75011 | 485.55 | 618 | 603 | 153.2 |
| B | 4 | 170 | 420939 | 3209.38 | 618 | 597 | 131.0 |
| B | 8 | 128 | 60804 | 459.69 | 618 | 597 | 131.0 |
| B | 5 | 185 | 51814 | 391.05 | 618 | 597 | 131.0 |
| C | 1 | 44 | 1393790 | 8632.24 | 589 | 584 | 161.4 |
| C | 5 | 10 | 648494 | 4014.42 | 589 | 584 | 161.4 |
| C | 4 | 5 | 267110 | 1651.38 | 589 | 584 | 161.4 |
| D | 8 | 176 | 3406233 | 22389.56 | 541 | 520 | 152.1 |
| D | 2 | 216 | 777315 | 5106.74 | 541 | 520 | 152.1 |
| D | 2 | 249 | 446857 | 2934.27 | 541 | 520 | 152.1 |
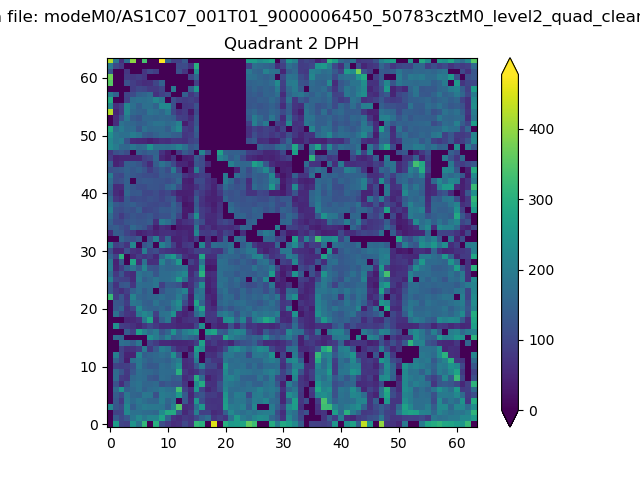
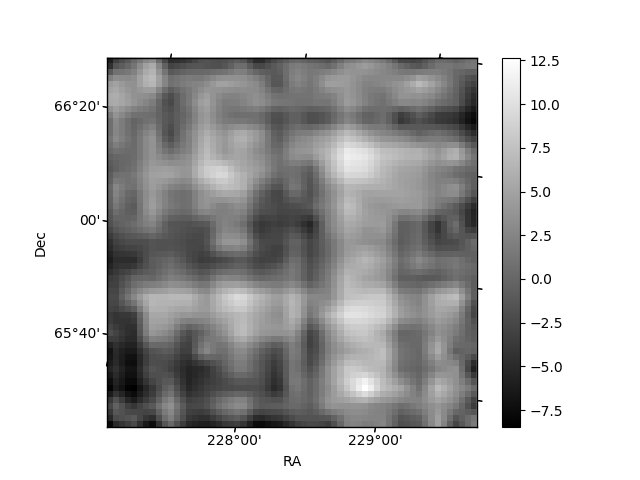
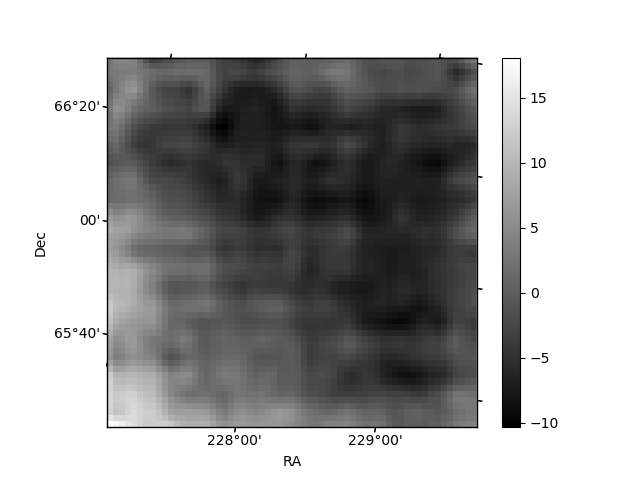
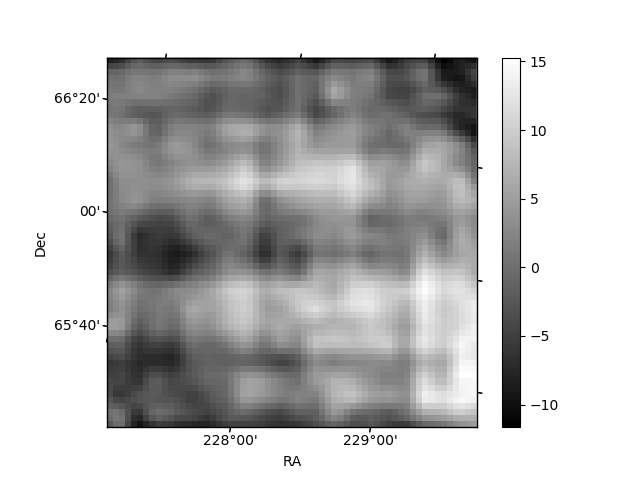
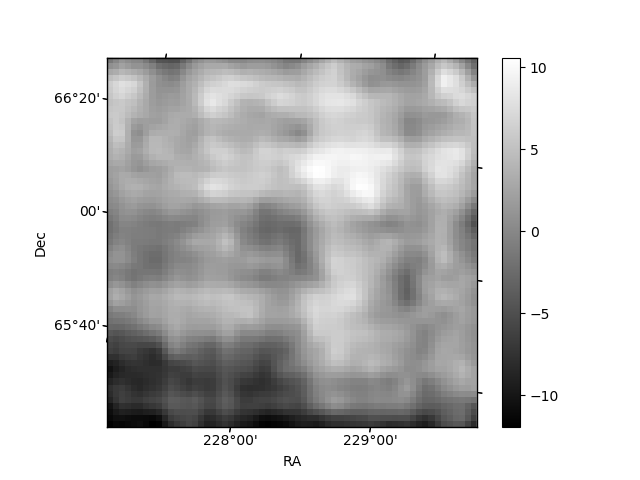
Histogram calculated using DETX and DETY for each event in the final _common_clean file
| Quadrant A | 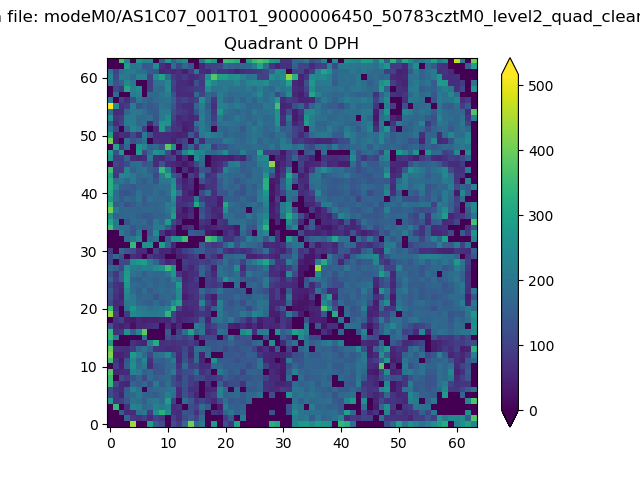 |
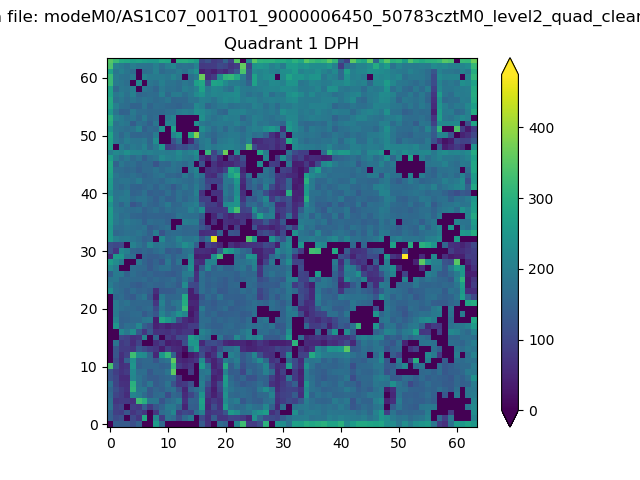 |
Quadrant B |
|---|---|---|---|
| Quadrant D | 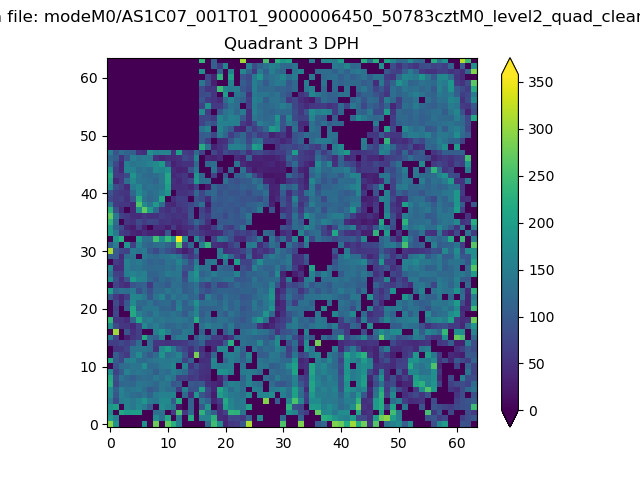 |
 |
Quadrant C |
| Plot type | Count rate plots | Images |
|---|---|---|
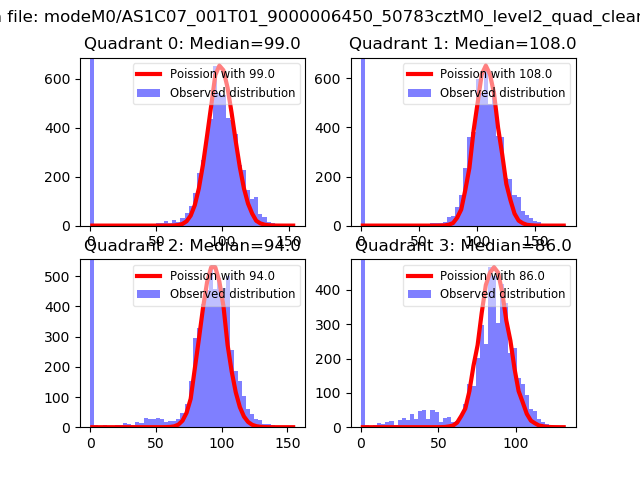
| Comparison with Poisson distribution Blue bars denote a histogram of data divided into 1 sec bins. Red curve is a Poisson curve with rate = median count rate of data. |
 |
 |
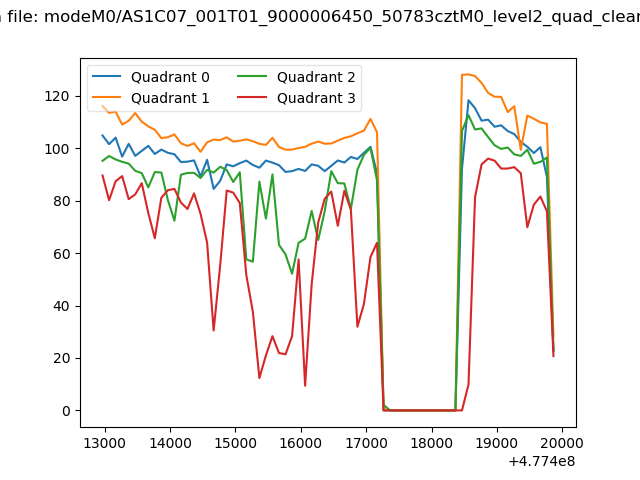
| Quadrant-wise count rates Data is divided into 100 sec bins |
 |
|
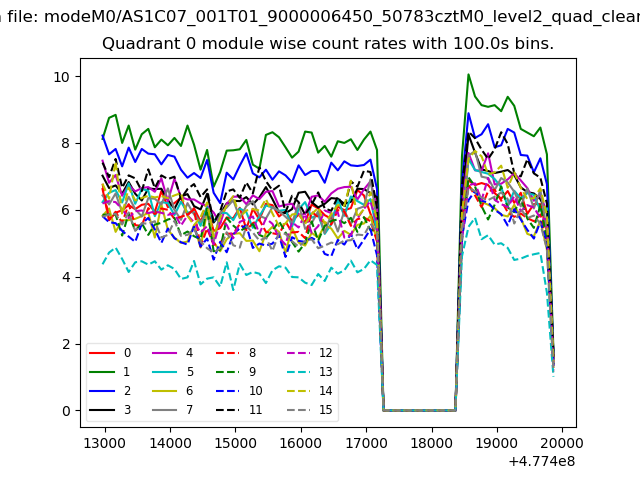
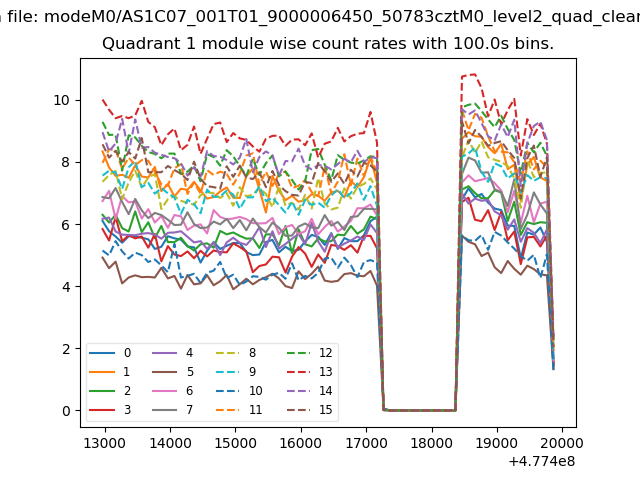
| Module-wise count rates for Quadrant A Data is divided into 100 sec bins |
 |
 |
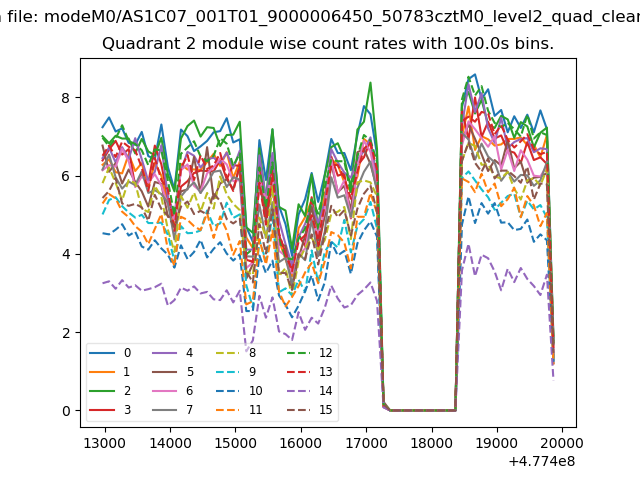
| Module-wise count rates for Quadrant B Data is divided into 100 sec bins |
 |
 |
| Module-wise count rates for Quadrant C Data is divided into 100 sec bins |
 |
 |
| Module-wise count rates for Quadrant D Data is divided into 100 sec bins |
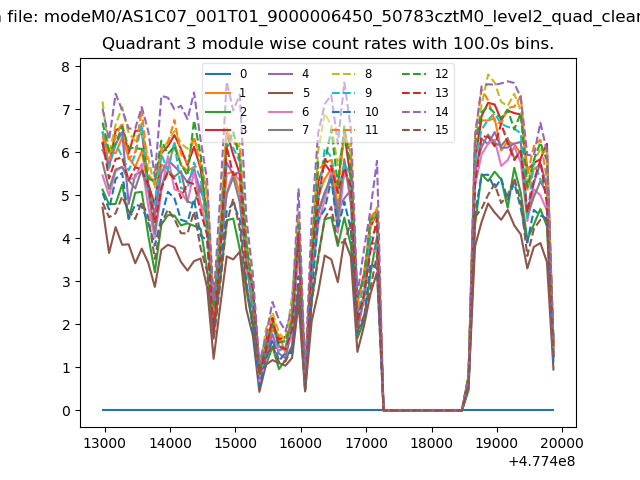 |
 |
| Parameter | Plot |
|---|---|
| CZT HV Monitor | 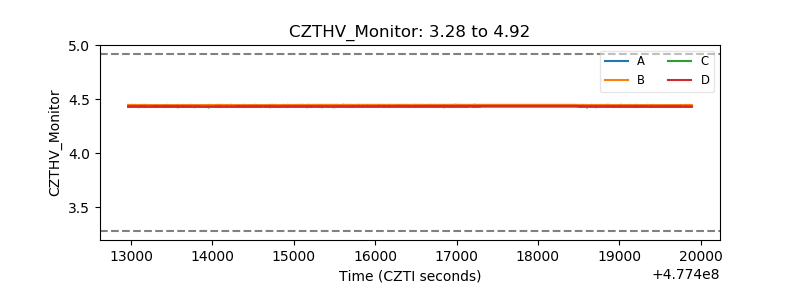 |
| D_VDD | 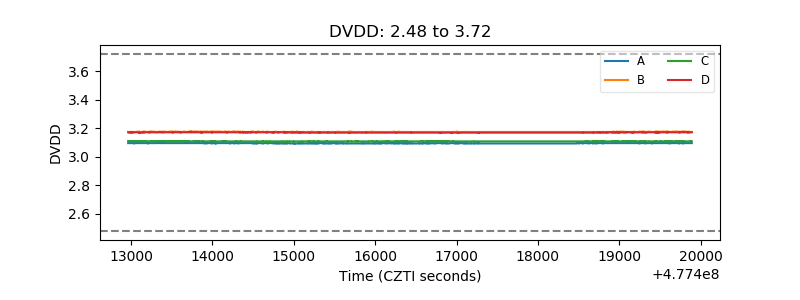 |
| Temperature 1 | 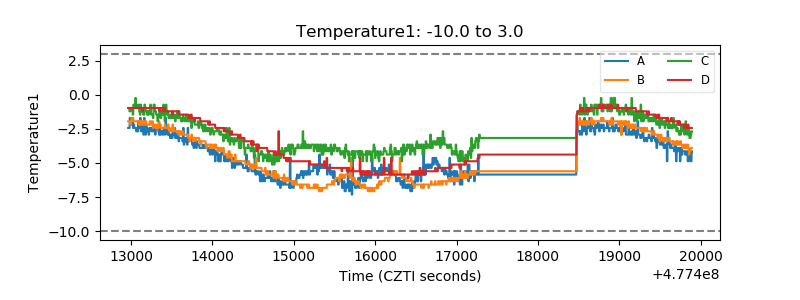 |
| Veto HV Monitor | 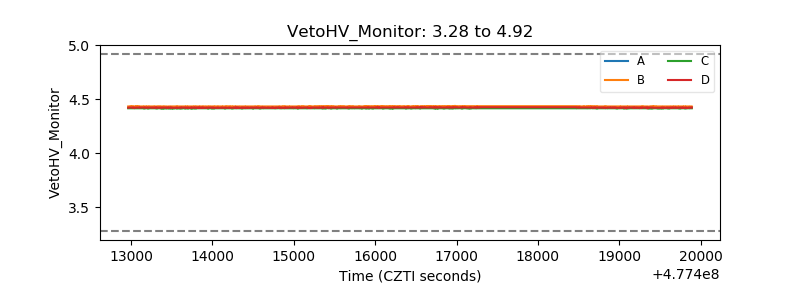 |
| Veto LLD | 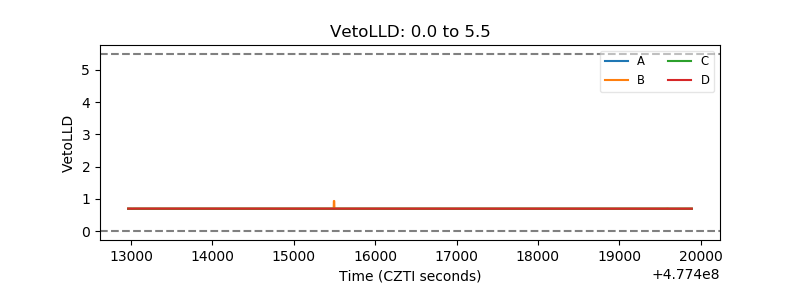 |
| Alpha Counter | 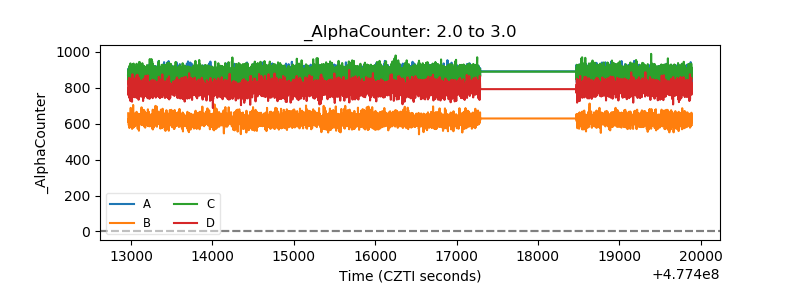 |
| _CPM_Rate | 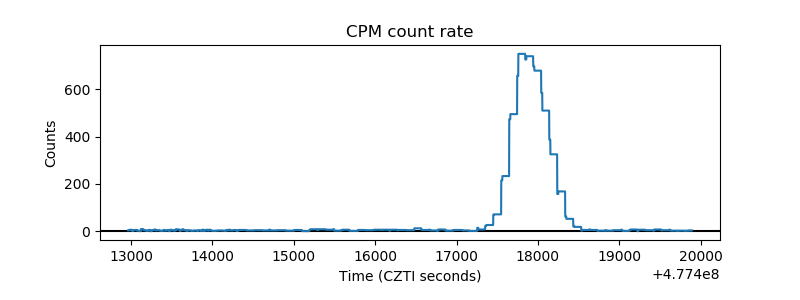 |
| CZT Counter | 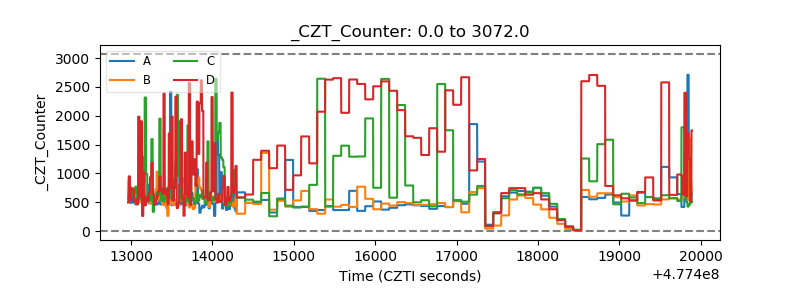 |
| +2.5 Volts monitor |  |
| +5 Volts monitor | 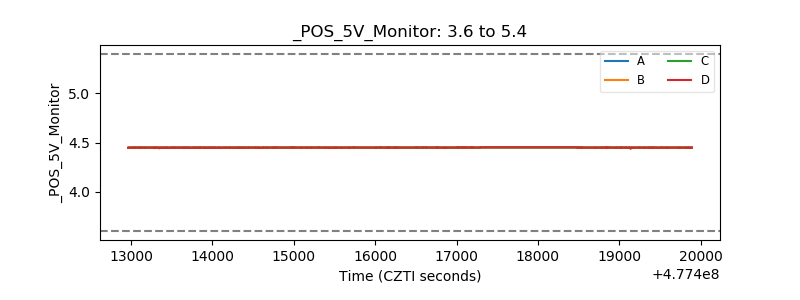 |
| _ROLL_ROT | 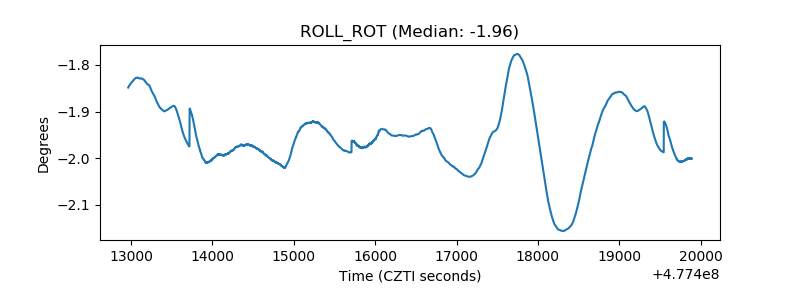 |
| _Roll_DEC | 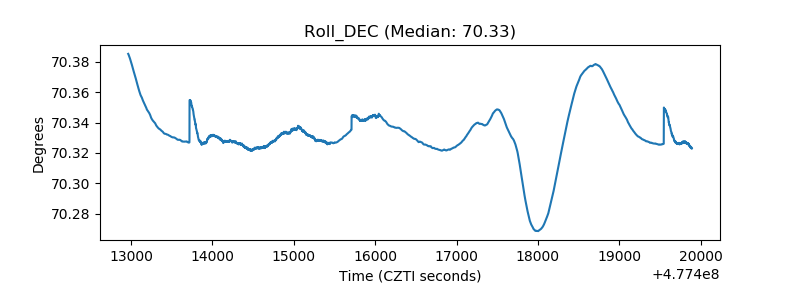 |
| _Roll_RA | 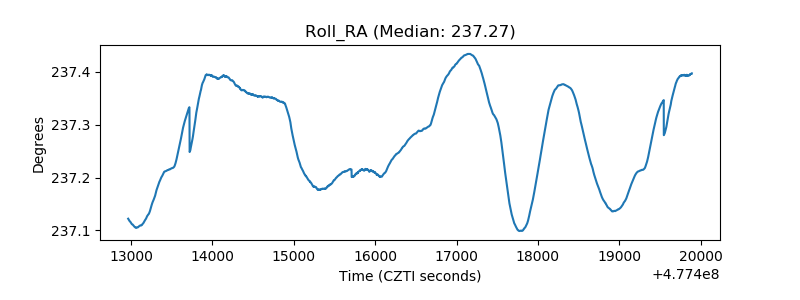 |
| Veto Counter | 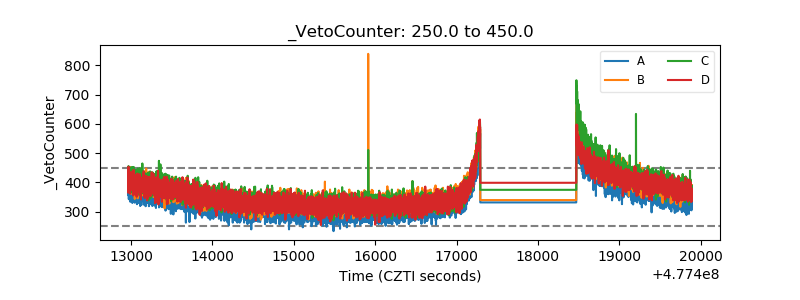 |