| Param | Original file | Final file |
|---|---|---|
| Filename | modeM0/AS1C07_001T01_9000006450_50784cztM0_level2.fits | modeM0/AS1C07_001T01_9000006450_50784cztM0_level2_quad_clean.evt |
| Size (bytes) | 578,511,360 | 84,888,000 |
| Size | 551.7 MB | 81.0 MB |
| Events in quadrant A | 3,636,635 | 574,627 |
| Events in quadrant B | 3,393,500 | 626,723 |
| Events in quadrant C | 5,588,980 | 509,498 |
| Events in quadrant D | 8,336,617 | 445,566 |
| Mode SS | |||
|---|---|---|---|
| Quadrant | BADHDUFLAG | Total packets | Discarded packets |
| A | 0 | 120 | 0 |
| B | 0 | 120 | 0 |
| C | 0 | 120 | 0 |
| D | 0 | 120 | 0 |
| Mode M0 | |||
|---|---|---|---|
| Quadrant | BADHDUFLAG | Total packets | Discarded packets |
| A | 0 | 14800 | 1 |
| B | 0 | 14058 | 1 |
| C | 0 | 20722 | 2 |
| D | 0 | 28813 | 1 |
| Mode M9 | |||
|---|---|---|---|
| Quadrant | BADHDUFLAG | Total packets | Discarded packets |
| A | 0 | 12 | 0 |
| B | 0 | 12 | 0 |
| C | 0 | 12 | 0 |
| D | 0 | 12 | 0 |
| Quadrant | Total seconds | Saturated seconds | Saturation percentage |
|---|---|---|---|
| A | 5924 | 216 | 3.646185% |
| B | 5924 | 214 | 3.612424% |
| C | 5924 | 671 | 11.326806% |
| D | 5924 | 1212 | 20.459149% |
Noise dominated data is calculated using 1-second bins in cleaned event files. If a bin has >2000 counts, and if more than 50% of those come from <1% of pixels, then it is considered to be noise-dominated and hence unusable.
| Quadrant | # 1 sec bins | Bins with >0 counts | Bins with >2000 counts | High rate bins dominated by noise | Noise dominated (total time) | Noise dominated (detector-on time) | Marked lightcurve |
|---|---|---|---|---|---|---|---|
| A | 7044 | 5925 | 106 | 106 | 1.50% | 1.79% | 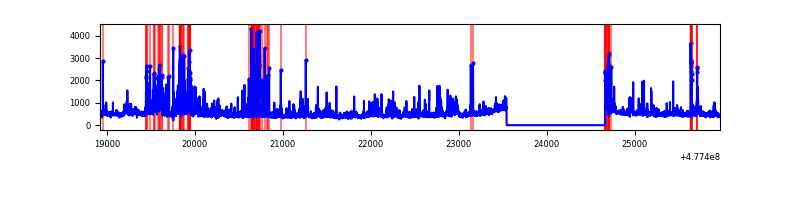 |
| B | 7044 | 5925 | 79 | 79 | 1.12% | 1.33% | 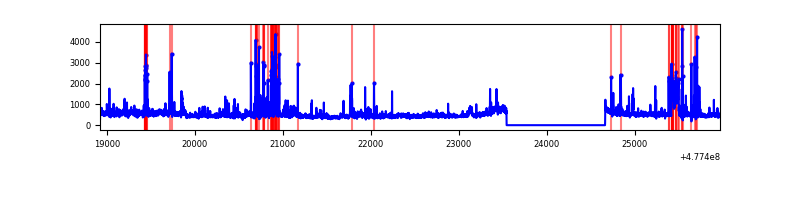 |
| C | 7044 | 5925 | 521 | 521 | 7.40% | 8.79% | 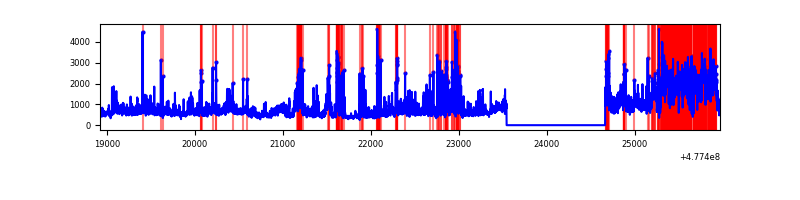 |
| D | 7044 | 5924 | 1275 | 1275 | 18.10% | 21.52% | 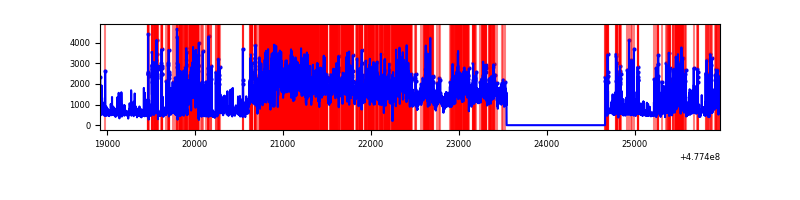 |
Top three noisy pixels from each quadrant. If the there are fewer than three noisy pixels in the level2.evt file, extra rows are filled as -1
| Pixel properties | Quadrant properties | ||||||
|---|---|---|---|---|---|---|---|
| Quadrant | DetID | PixID | Counts | Sigma | Mean | Median | Sigma |
| A | 4 | 249 | 208430 | 1299.0 | 639 | 622 | 160.0 |
| A | 8 | 248 | 173178 | 1078.64 | 639 | 622 | 160.0 |
| A | 5 | 17 | 157020 | 977.64 | 639 | 622 | 160.0 |
| B | 4 | 170 | 209498 | 1544.55 | 639 | 617 | 135.2 |
| B | 10 | 247 | 154809 | 1140.16 | 639 | 617 | 135.2 |
| B | 4 | 206 | 146816 | 1081.05 | 639 | 617 | 135.2 |
| C | 5 | 10 | 2343232 | 14095.04 | 609 | 604 | 166.2 |
| C | 13 | 3 | 366011 | 2198.57 | 609 | 604 | 166.2 |
| C | 1 | 124 | 94260 | 563.51 | 609 | 604 | 166.2 |
| D | 8 | 176 | 3389009 | 20783.46 | 586 | 565 | 163.0 |
| D | 2 | 216 | 634723 | 3889.69 | 586 | 565 | 163.0 |
| D | 2 | 249 | 562994 | 3449.73 | 586 | 565 | 163.0 |
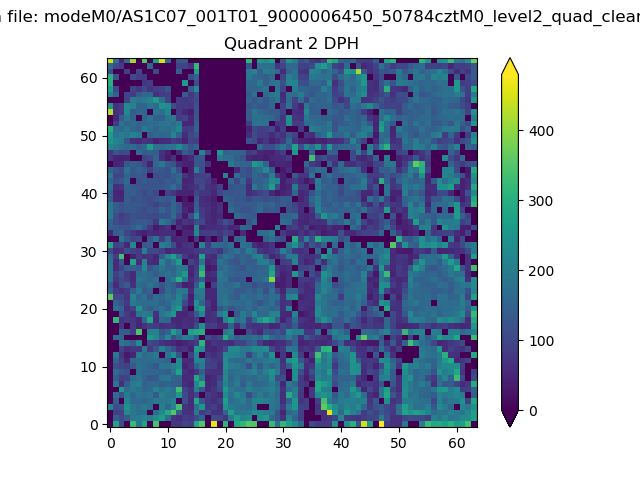
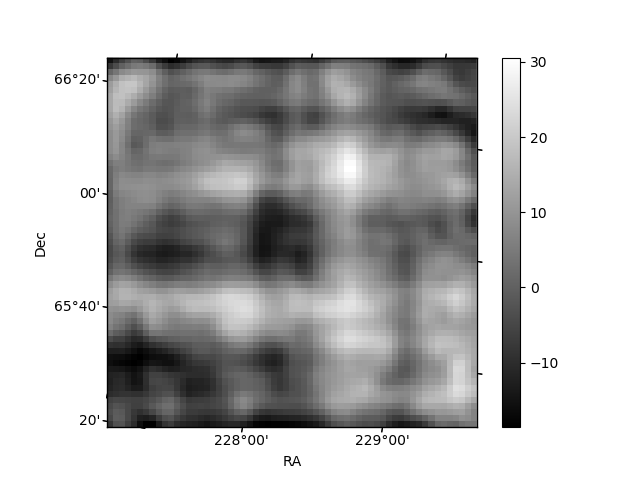
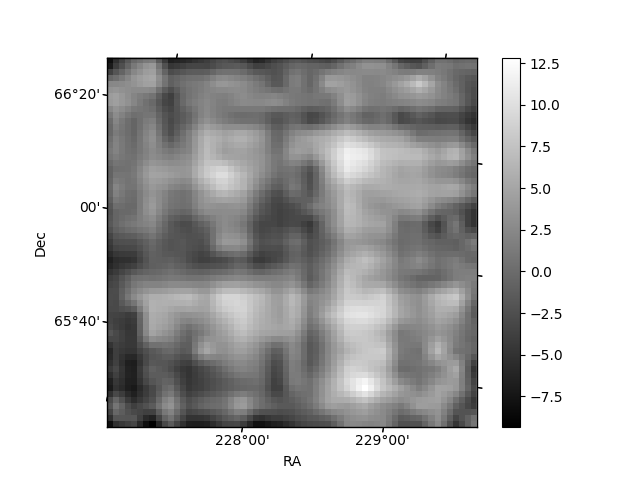
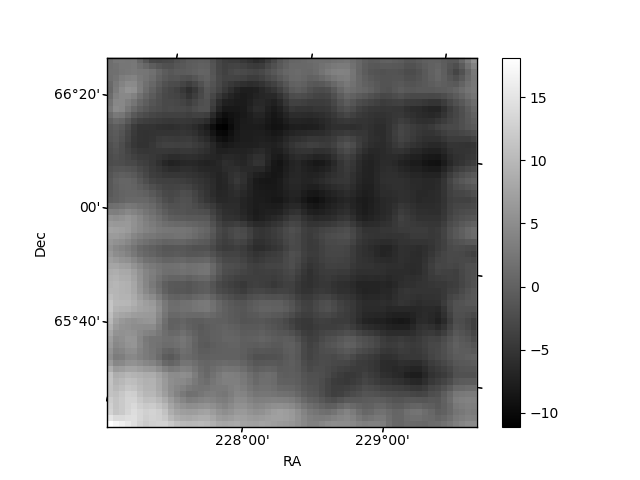
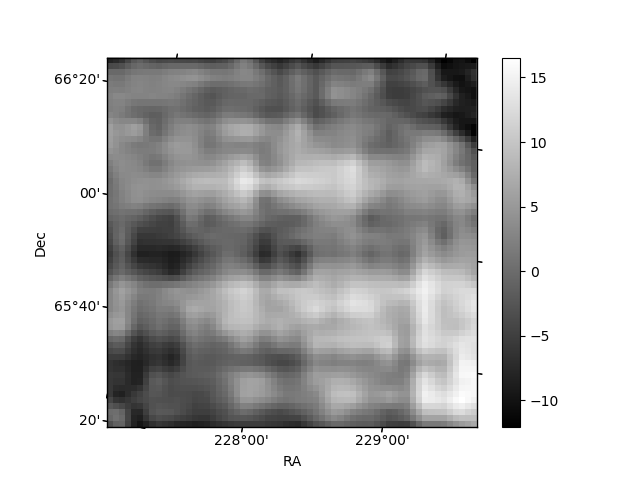
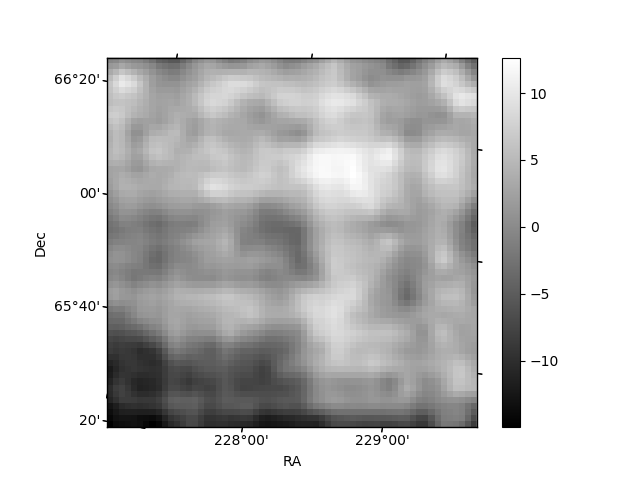
Histogram calculated using DETX and DETY for each event in the final _common_clean file
| Quadrant A | 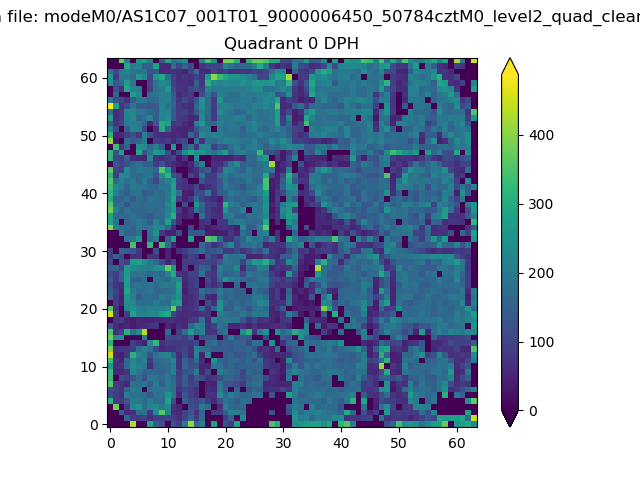 |
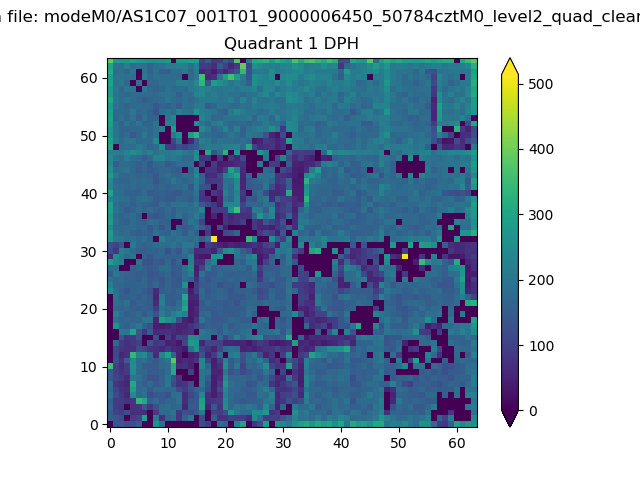 |
Quadrant B |
|---|---|---|---|
| Quadrant D | 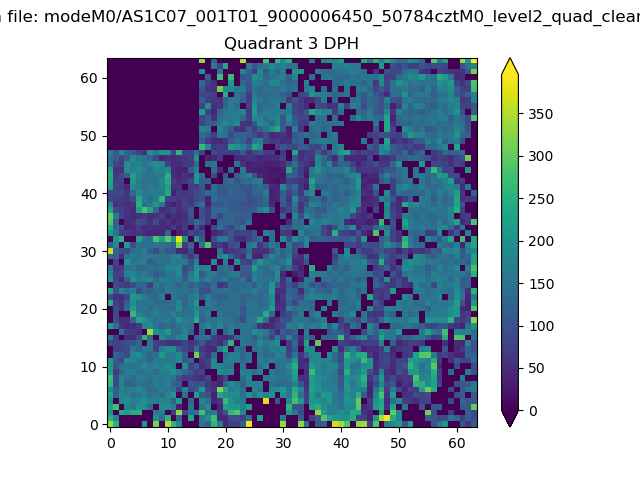 |
 |
Quadrant C |
| Plot type | Count rate plots | Images |
|---|---|---|
| Comparison with Poisson distribution Blue bars denote a histogram of data divided into 1 sec bins. Red curve is a Poisson curve with rate = median count rate of data. |
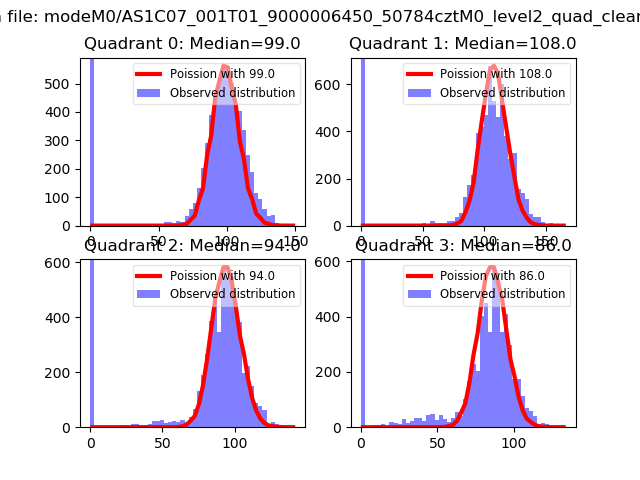 |
 |
| Quadrant-wise count rates Data is divided into 100 sec bins |
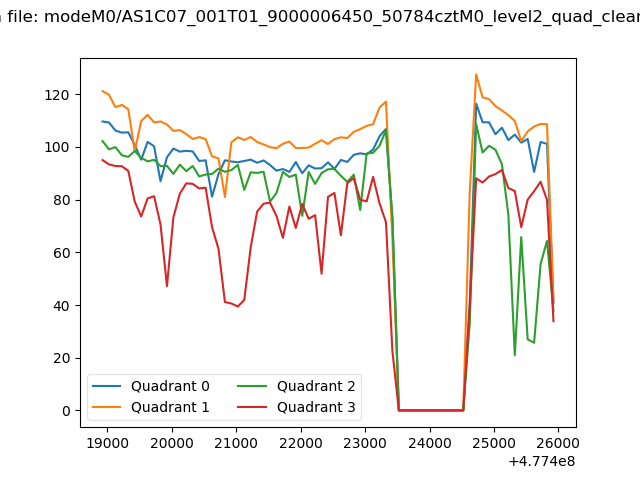 |
|
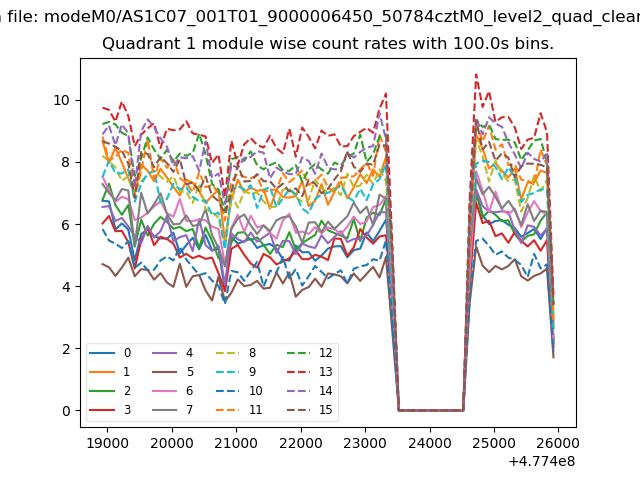
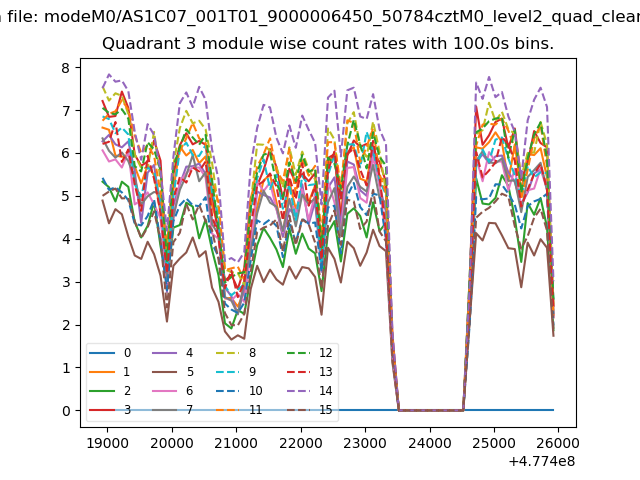
| Module-wise count rates for Quadrant A Data is divided into 100 sec bins |
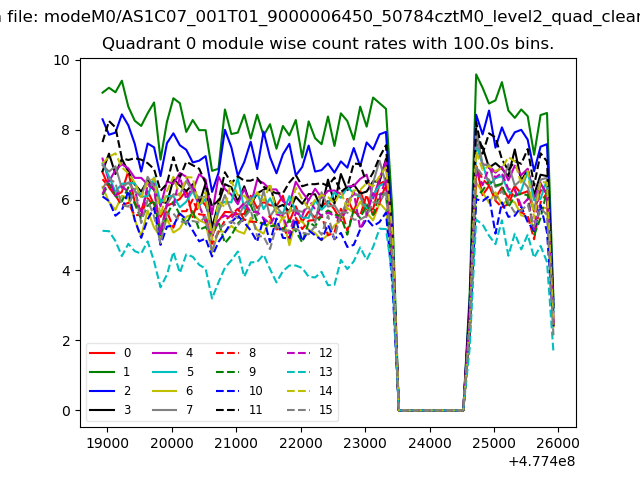 |
 |
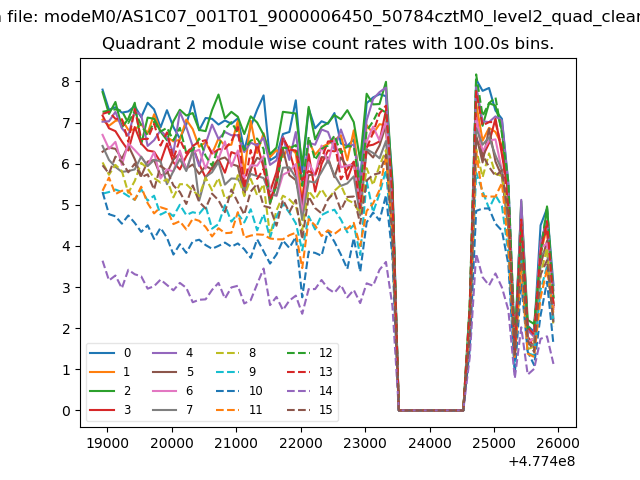
| Module-wise count rates for Quadrant B Data is divided into 100 sec bins |
 |
 |
| Module-wise count rates for Quadrant C Data is divided into 100 sec bins |
 |
 |
| Module-wise count rates for Quadrant D Data is divided into 100 sec bins |
 |
 |
| Parameter | Plot |
|---|---|
| CZT HV Monitor | 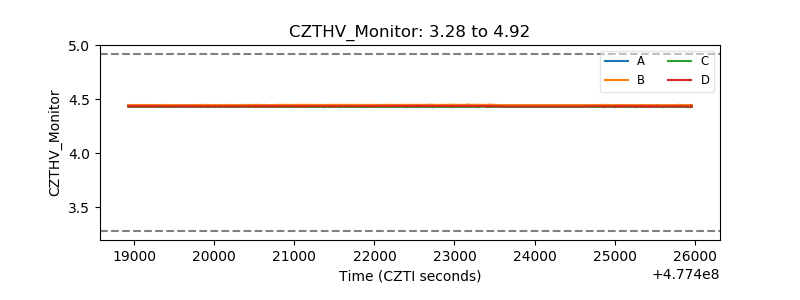 |
| D_VDD | 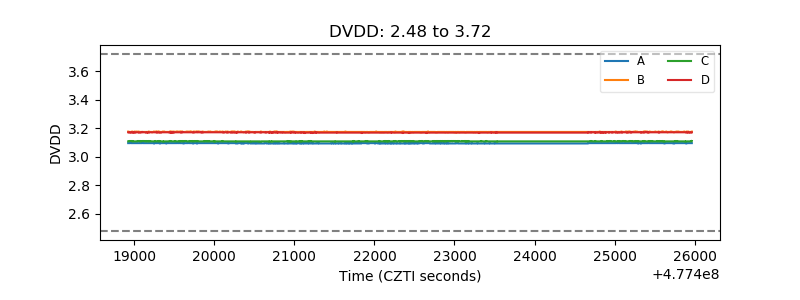 |
| Temperature 1 | 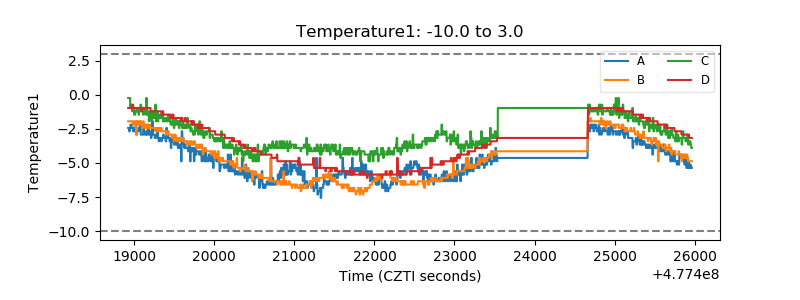 |
| Veto HV Monitor | 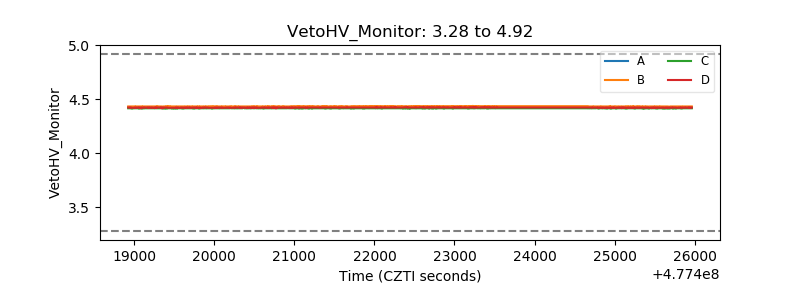 |
| Veto LLD | 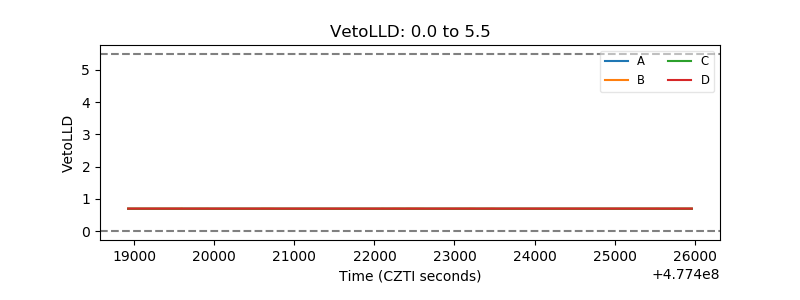 |
| Alpha Counter | 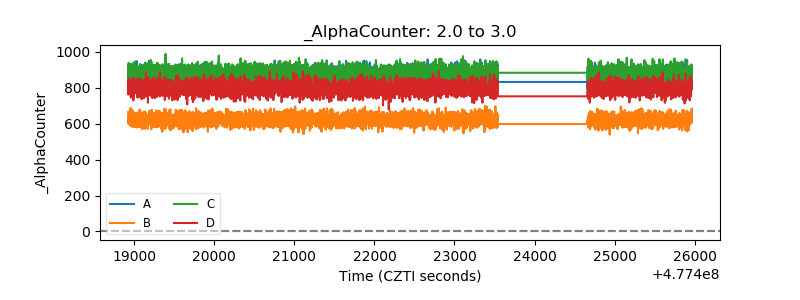 |
| _CPM_Rate | 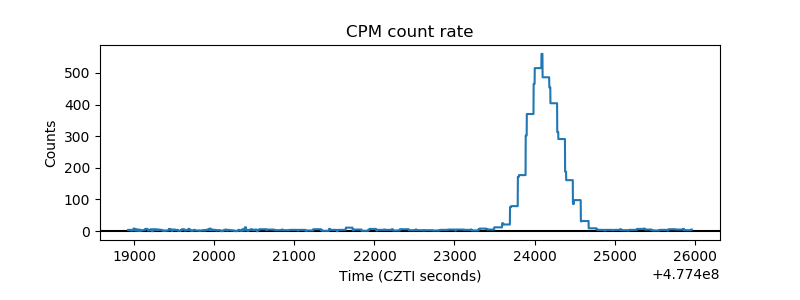 |
| CZT Counter | 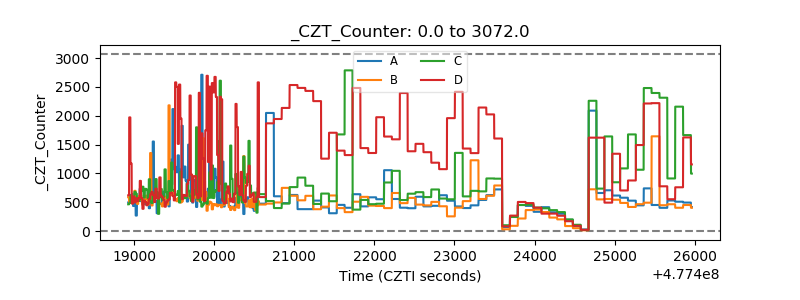 |
| +2.5 Volts monitor | 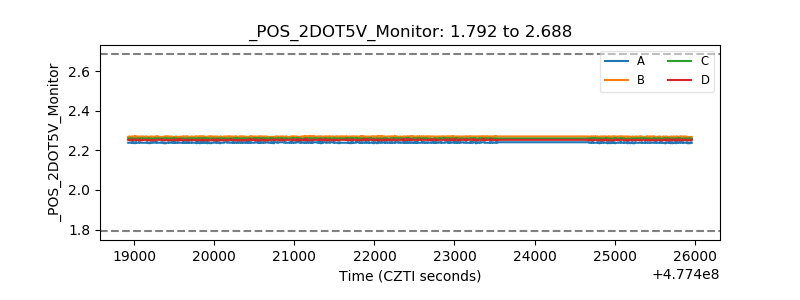 |
| +5 Volts monitor | 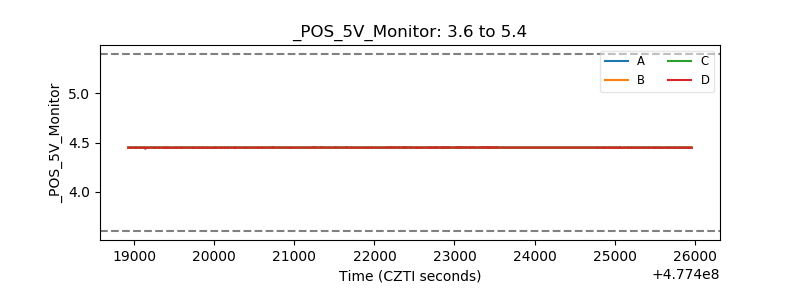 |
| _ROLL_ROT | 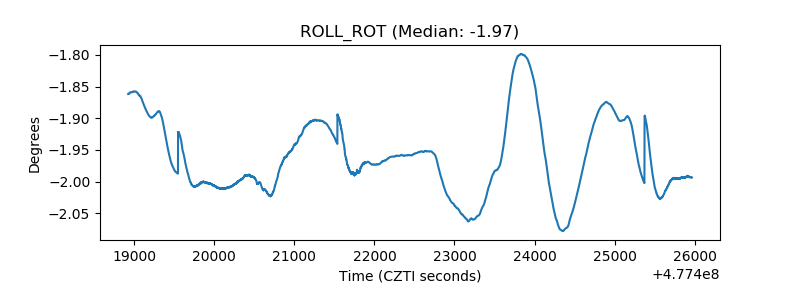 |
| _Roll_DEC | 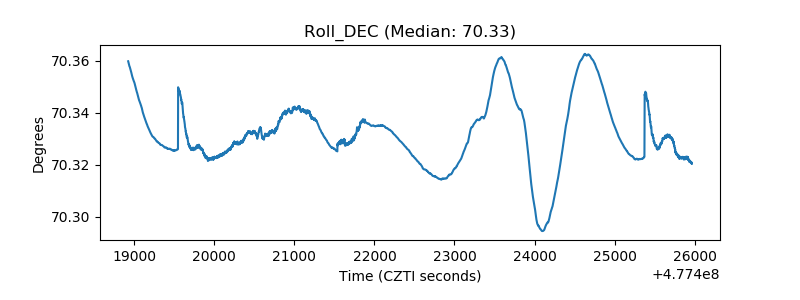 |
| _Roll_RA | 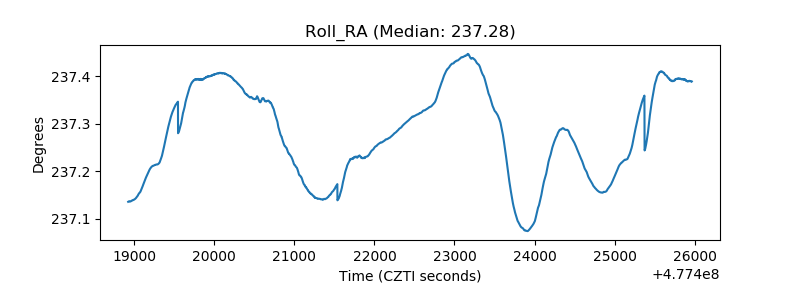 |
| Veto Counter | 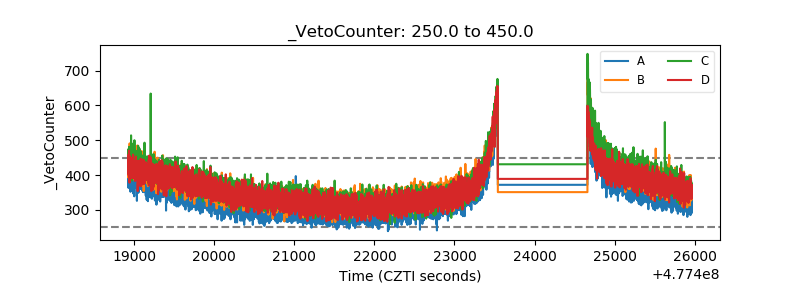 |