| Param | Original file | Final file |
|---|---|---|
| Filename | modeM0/AS1C07_001T01_9000006450_50785cztM0_level2.fits | modeM0/AS1C07_001T01_9000006450_50785cztM0_level2_quad_clean.evt |
| Size (bytes) | 649,952,640 | 87,652,800 |
| Size | 619.8 MB | 83.6 MB |
| Events in quadrant A | 3,535,185 | 603,969 |
| Events in quadrant B | 3,601,613 | 654,521 |
| Events in quadrant C | 8,018,599 | 521,805 |
| Events in quadrant D | 8,414,759 | 432,350 |
| Mode SS | |||
|---|---|---|---|
| Quadrant | BADHDUFLAG | Total packets | Discarded packets |
| A | 0 | 130 | 0 |
| B | 0 | 130 | 0 |
| C | 0 | 130 | 0 |
| D | 0 | 130 | 0 |
| Mode M0 | |||
|---|---|---|---|
| Quadrant | BADHDUFLAG | Total packets | Discarded packets |
| A | 0 | 14879 | 1 |
| B | 0 | 15158 | 1 |
| C | 0 | 28286 | 4 |
| D | 0 | 29302 | 1 |
| Mode M9 | |||
|---|---|---|---|
| Quadrant | BADHDUFLAG | Total packets | Discarded packets |
| A | 0 | 10 | 0 |
| B | 0 | 10 | 0 |
| C | 0 | 10 | 0 |
| D | 0 | 10 | 0 |
| Quadrant | Total seconds | Saturated seconds | Saturation percentage |
|---|---|---|---|
| A | 6316 | 147 | 2.327422% |
| B | 6317 | 200 | 3.166060% |
| C | 6316 | 951 | 15.056998% |
| D | 6316 | 1597 | 25.284991% |
Noise dominated data is calculated using 1-second bins in cleaned event files. If a bin has >2000 counts, and if more than 50% of those come from <1% of pixels, then it is considered to be noise-dominated and hence unusable.
| Quadrant | # 1 sec bins | Bins with >0 counts | Bins with >2000 counts | High rate bins dominated by noise | Noise dominated (total time) | Noise dominated (detector-on time) | Marked lightcurve |
|---|---|---|---|---|---|---|---|
| A | 7326 | 6317 | 60 | 60 | 0.82% | 0.95% | 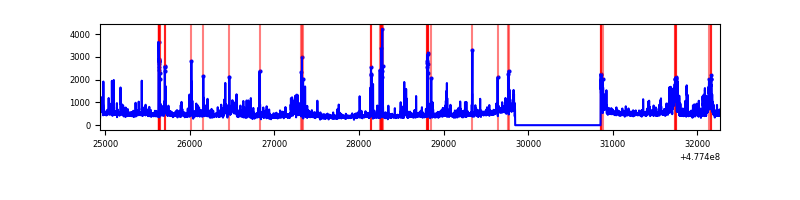 |
| B | 7327 | 6318 | 64 | 64 | 0.87% | 1.01% | 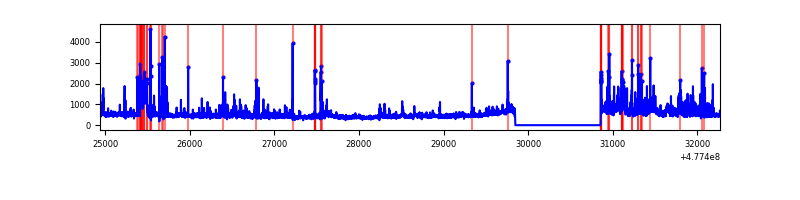 |
| C | 7326 | 6317 | 890 | 890 | 12.15% | 14.09% | 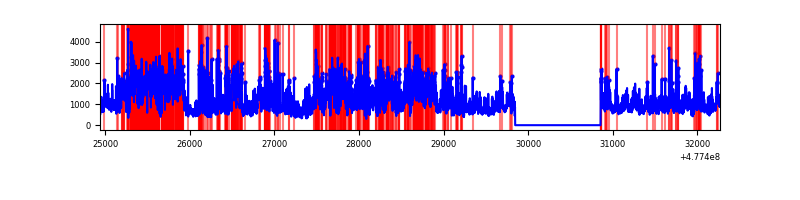 |
| D | 7326 | 6317 | 1529 | 1529 | 20.87% | 24.20% | 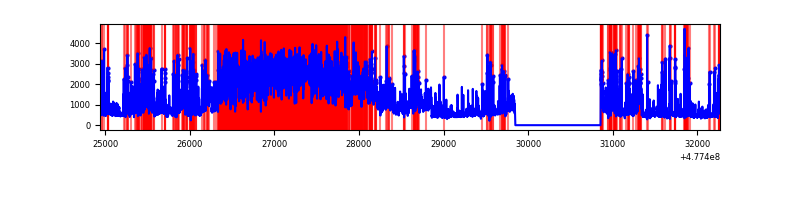 |
Top three noisy pixels from each quadrant. If the there are fewer than three noisy pixels in the level2.evt file, extra rows are filled as -1
| Pixel properties | Quadrant properties | ||||||
|---|---|---|---|---|---|---|---|
| Quadrant | DetID | PixID | Counts | Sigma | Mean | Median | Sigma |
| A | 12 | 80 | 195567 | 1158.34 | 672 | 655 | 168.3 |
| A | 10 | 253 | 187550 | 1110.7 | 672 | 655 | 168.3 |
| A | 5 | 240 | 119264 | 704.88 | 672 | 655 | 168.3 |
| B | 4 | 206 | 234624 | 1647.77 | 673 | 650 | 142.0 |
| B | 4 | 170 | 144018 | 1009.67 | 673 | 650 | 142.0 |
| B | 10 | 246 | 120335 | 842.88 | 673 | 650 | 142.0 |
| C | 5 | 10 | 4257050 | 24561.18 | 635 | 628 | 173.3 |
| C | 13 | 3 | 239601 | 1378.97 | 635 | 628 | 173.3 |
| C | 4 | 5 | 219492 | 1262.93 | 635 | 628 | 173.3 |
| D | 8 | 176 | 2708734 | 16169.94 | 605 | 582 | 167.5 |
| D | 2 | 216 | 938911 | 5602.61 | 605 | 582 | 167.5 |
| D | 15 | 174 | 859996 | 5131.42 | 605 | 582 | 167.5 |
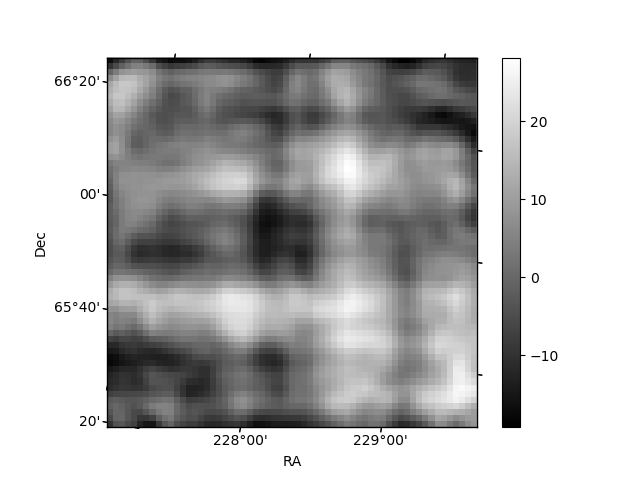
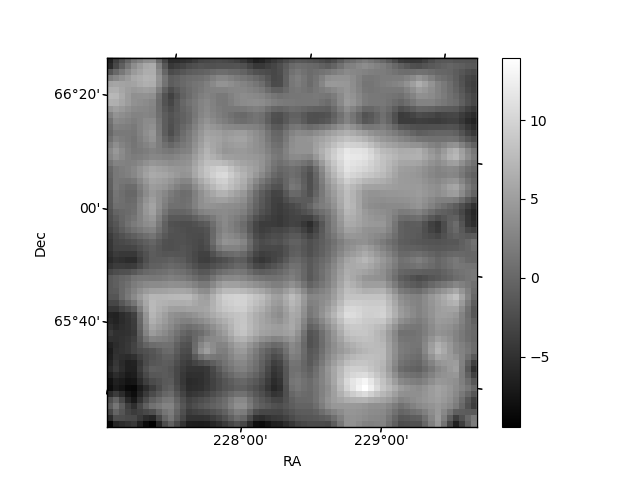
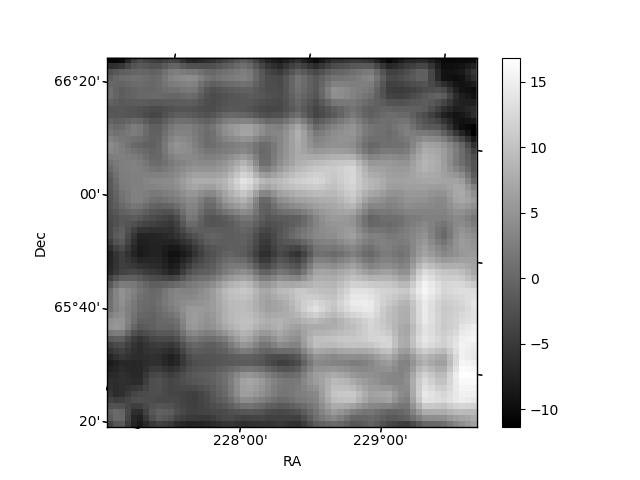
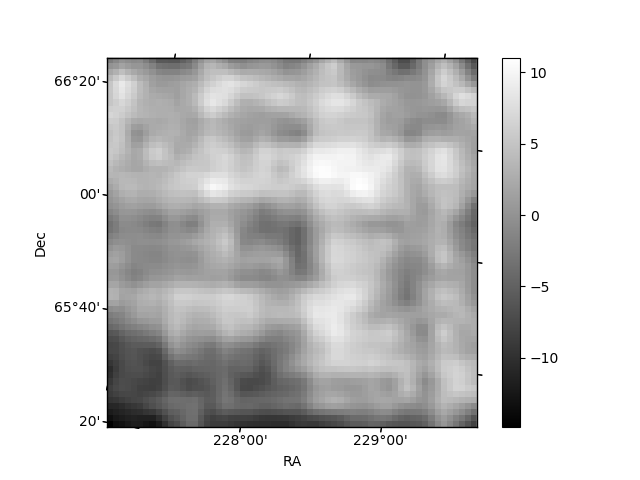
Histogram calculated using DETX and DETY for each event in the final _common_clean file
| Quadrant A | 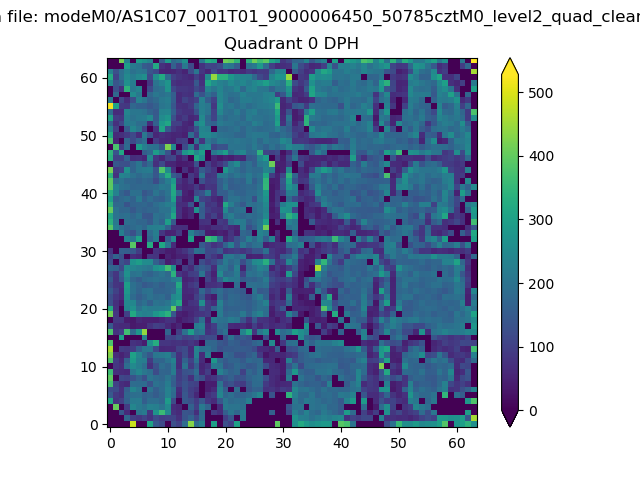 |
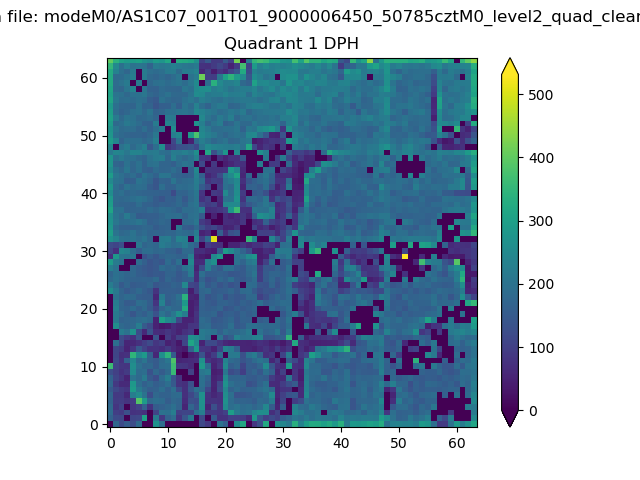 |
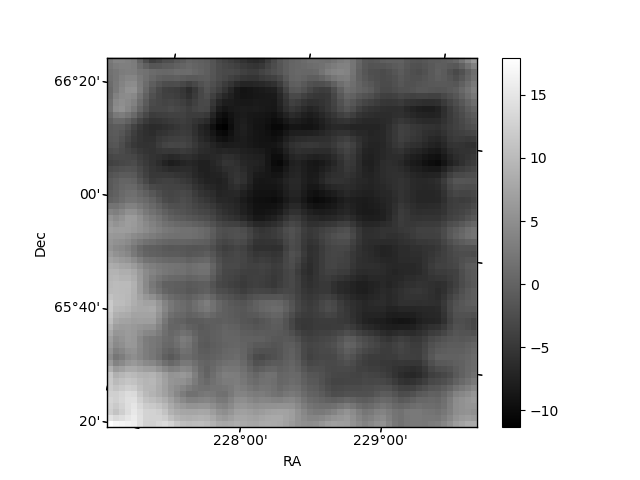
Quadrant B |
|---|---|---|---|
| Quadrant D | 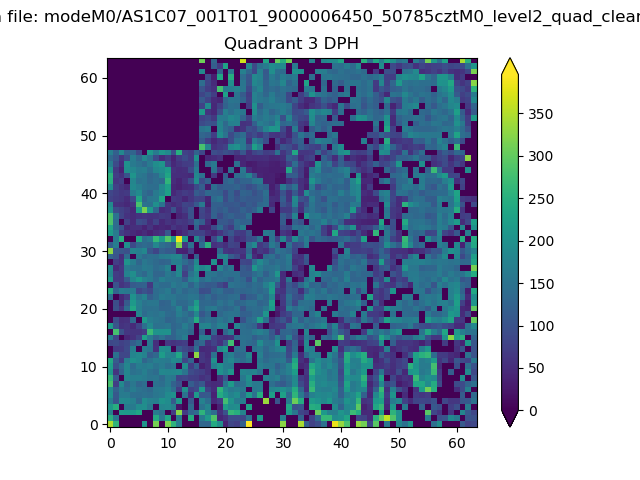 |
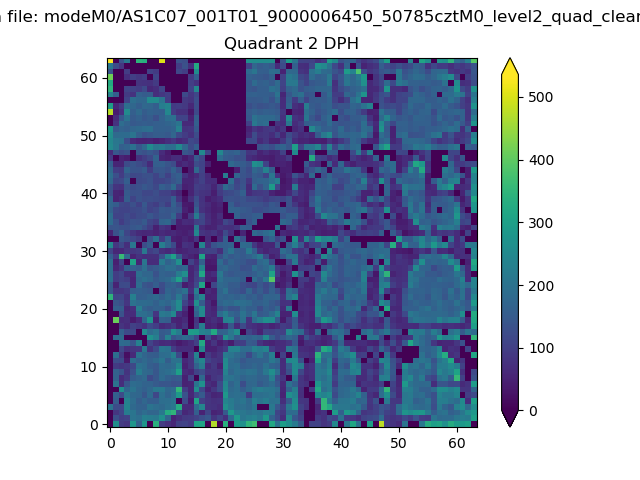 |
Quadrant C |
| Plot type | Count rate plots | Images |
|---|---|---|
| Comparison with Poisson distribution Blue bars denote a histogram of data divided into 1 sec bins. Red curve is a Poisson curve with rate = median count rate of data. |
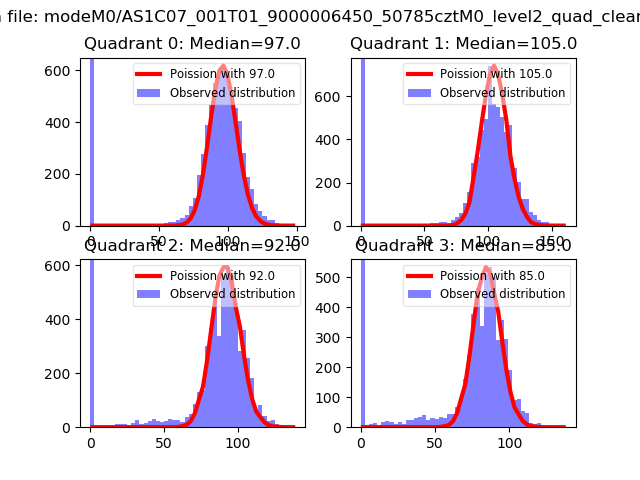 |
 |
| Quadrant-wise count rates Data is divided into 100 sec bins |
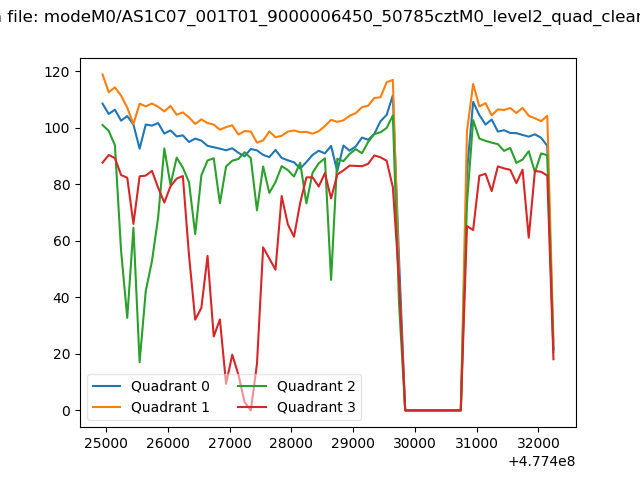 |
|
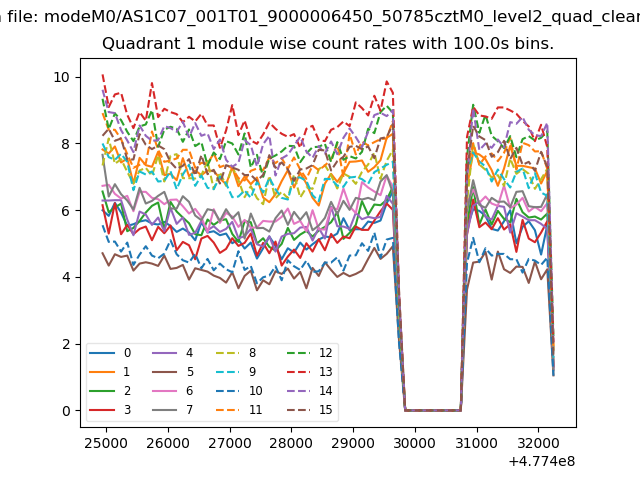
| Module-wise count rates for Quadrant A Data is divided into 100 sec bins |
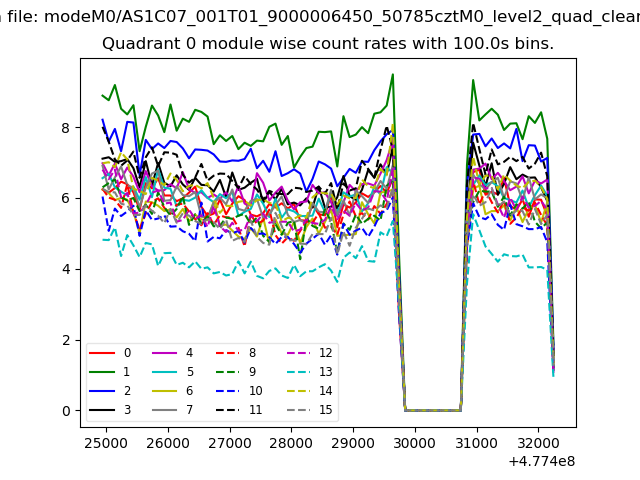 |
 |
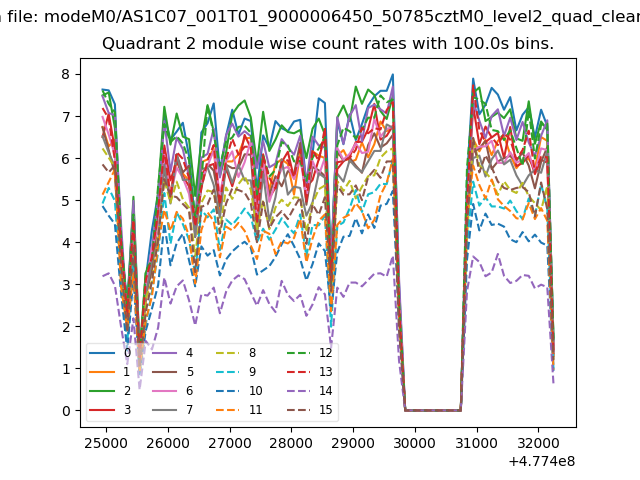
| Module-wise count rates for Quadrant B Data is divided into 100 sec bins |
 |
 |
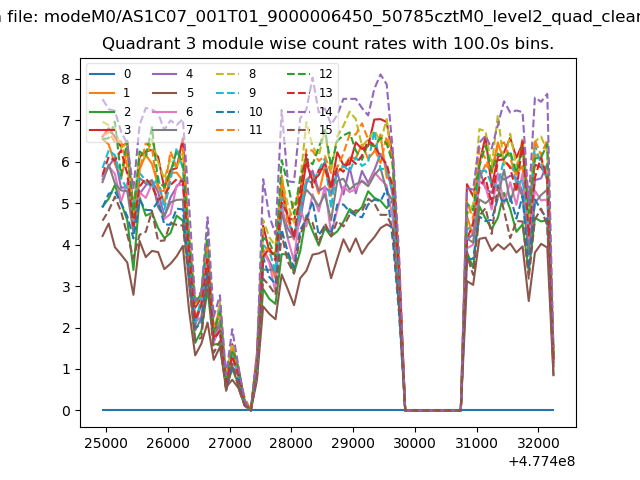
| Module-wise count rates for Quadrant C Data is divided into 100 sec bins |
 |
 |
| Module-wise count rates for Quadrant D Data is divided into 100 sec bins |
 |
 |
| Parameter | Plot |
|---|---|
| CZT HV Monitor | 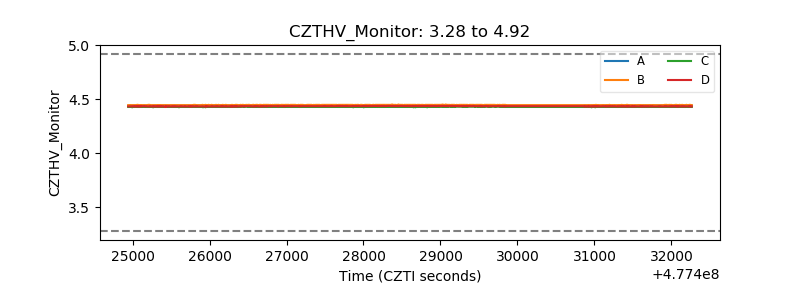 |
| D_VDD |  |
| Temperature 1 | 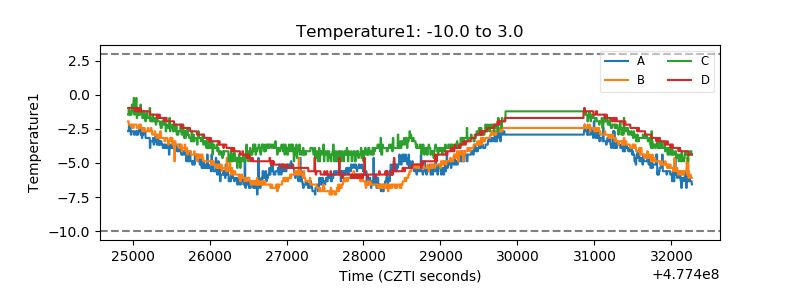 |
| Veto HV Monitor | 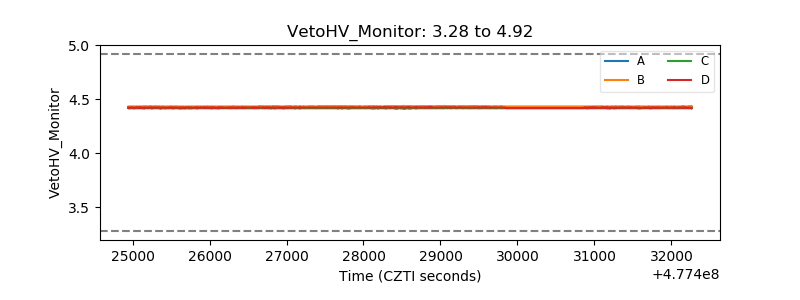 |
| Veto LLD | 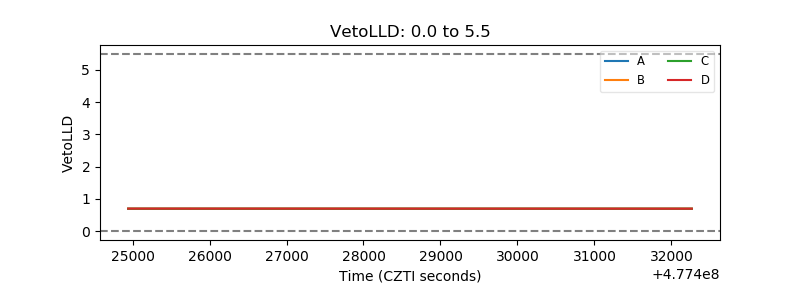 |
| Alpha Counter | 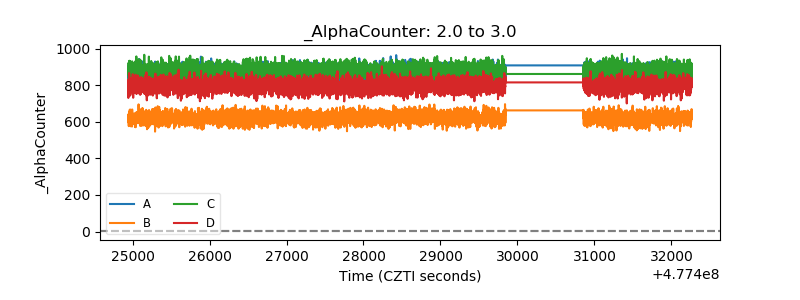 |
| _CPM_Rate | 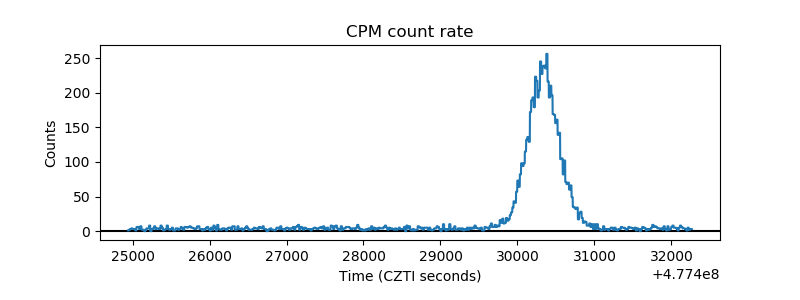 |
| CZT Counter | 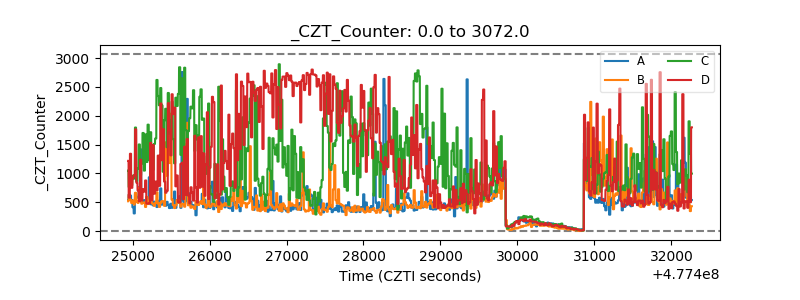 |
| +2.5 Volts monitor | 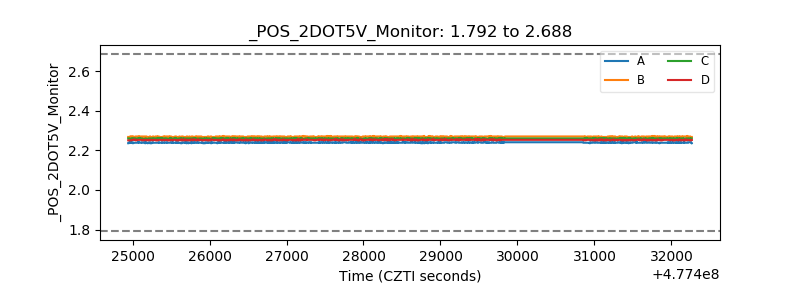 |
| +5 Volts monitor | 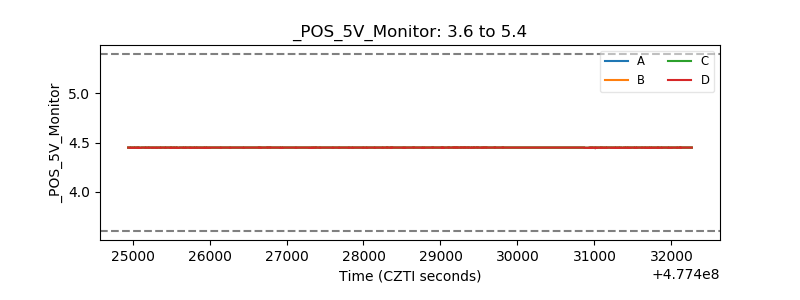 |
| _ROLL_ROT | 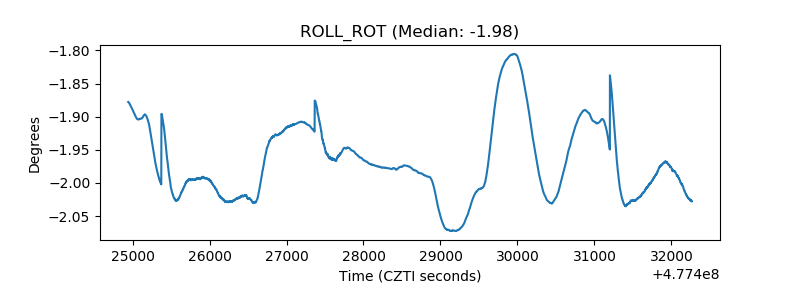 |
| _Roll_DEC | 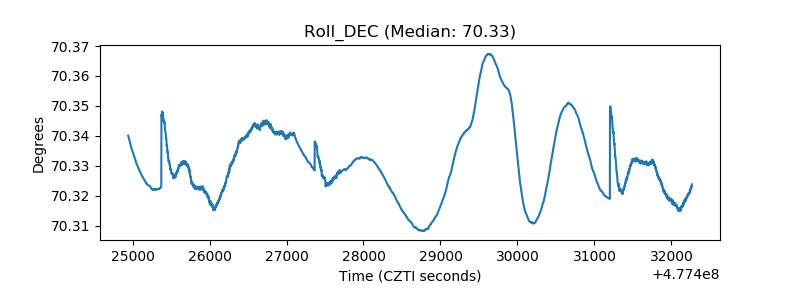 |
| _Roll_RA | 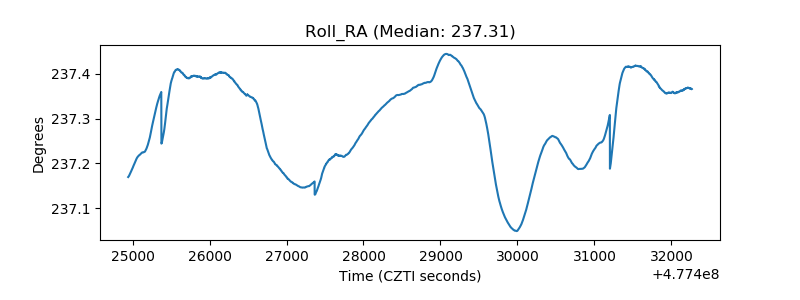 |
| Veto Counter | 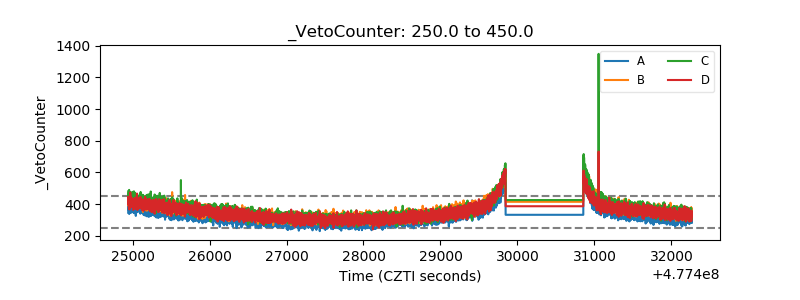 |