| Param | Original file | Final file |
|---|---|---|
| Filename | modeM0/AS1C07_001T01_9000006450_50786cztM0_level2.fits | modeM0/AS1C07_001T01_9000006450_50786cztM0_level2_quad_clean.evt |
| Size (bytes) | 595,143,360 | 97,447,680 |
| Size | 567.6 MB | 92.9 MB |
| Events in quadrant A | 3,989,065 | 646,062 |
| Events in quadrant B | 4,340,986 | 697,464 |
| Events in quadrant C | 6,631,438 | 586,675 |
| Events in quadrant D | 6,533,554 | 538,504 |
| Mode SS | |||
|---|---|---|---|
| Quadrant | BADHDUFLAG | Total packets | Discarded packets |
| A | 0 | 142 | 0 |
| B | 0 | 142 | 0 |
| C | 0 | 142 | 0 |
| D | 0 | 142 | 0 |
| Mode M0 | |||
|---|---|---|---|
| Quadrant | BADHDUFLAG | Total packets | Discarded packets |
| A | 0 | 16858 | 3 |
| B | 0 | 17799 | 3 |
| C | 0 | 24529 | 6 |
| D | 0 | 24166 | 3 |
| Mode M9 | |||
|---|---|---|---|
| Quadrant | BADHDUFLAG | Total packets | Discarded packets |
| A | 0 | 8 | 0 |
| B | 0 | 8 | 0 |
| C | 0 | 9 | 0 |
| D | 0 | 9 | 0 |
| Quadrant | Total seconds | Saturated seconds | Saturation percentage |
|---|---|---|---|
| A | 6910 | 189 | 2.735166% |
| B | 6910 | 238 | 3.444284% |
| C | 6909 | 654 | 9.465914% |
| D | 6909 | 809 | 11.709365% |
Noise dominated data is calculated using 1-second bins in cleaned event files. If a bin has >2000 counts, and if more than 50% of those come from <1% of pixels, then it is considered to be noise-dominated and hence unusable.
| Quadrant | # 1 sec bins | Bins with >0 counts | Bins with >2000 counts | High rate bins dominated by noise | Noise dominated (total time) | Noise dominated (detector-on time) | Marked lightcurve |
|---|---|---|---|---|---|---|---|
| A | 7690 | 6912 | 119 | 119 | 1.55% | 1.72% | 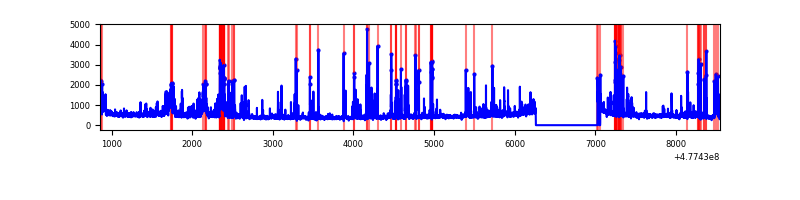 |
| B | 7690 | 6911 | 83 | 83 | 1.08% | 1.20% | 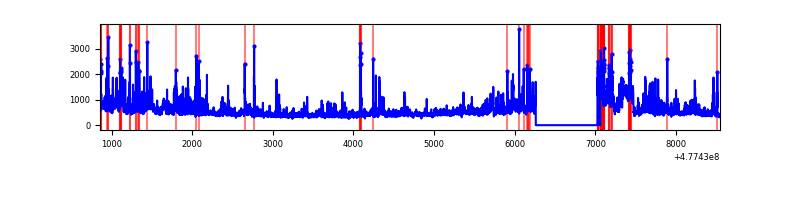 |
| C | 7689 | 6911 | 537 | 537 | 6.98% | 7.77% | 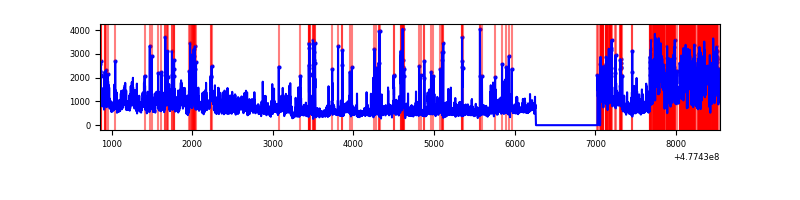 |
| D | 7689 | 6911 | 613 | 613 | 7.97% | 8.87% | 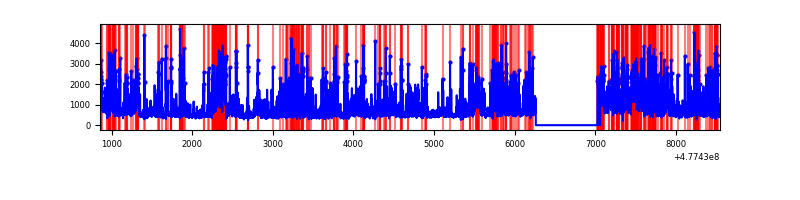 |
Top three noisy pixels from each quadrant. If the there are fewer than three noisy pixels in the level2.evt file, extra rows are filled as -1
| Pixel properties | Quadrant properties | ||||||
|---|---|---|---|---|---|---|---|
| Quadrant | DetID | PixID | Counts | Sigma | Mean | Median | Sigma |
| A | 3 | 114 | 303347 | 1681.48 | 723 | 708 | 180.0 |
| A | 12 | 80 | 251417 | 1392.96 | 723 | 708 | 180.0 |
| A | 8 | 38 | 83473 | 459.85 | 723 | 708 | 180.0 |
| B | 4 | 170 | 470243 | 3063.13 | 722 | 697 | 153.3 |
| B | 7 | 0 | 180720 | 1174.4 | 722 | 697 | 153.3 |
| B | 5 | 172 | 177329 | 1152.28 | 722 | 697 | 153.3 |
| C | 5 | 10 | 2779648 | 14556.69 | 697 | 690 | 190.9 |
| C | 12 | 2 | 231153 | 1207.21 | 697 | 690 | 190.9 |
| C | 12 | 252 | 125206 | 652.24 | 697 | 690 | 190.9 |
| D | 2 | 216 | 1416037 | 7516.71 | 673 | 650 | 188.3 |
| D | 7 | 96 | 476173 | 2525.37 | 673 | 650 | 188.3 |
| D | 2 | 249 | 347312 | 1841.02 | 673 | 650 | 188.3 |
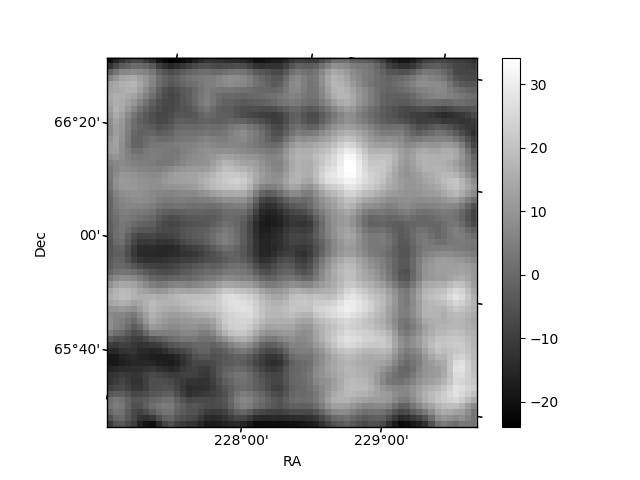
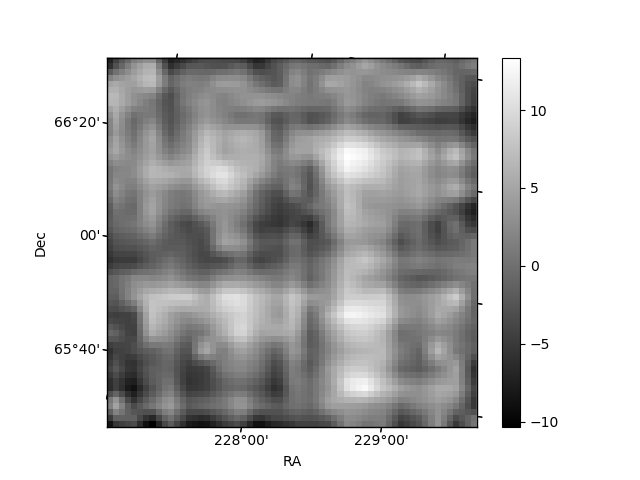
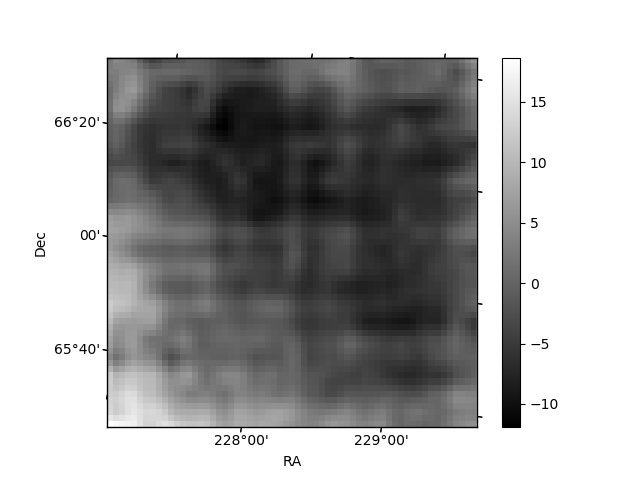
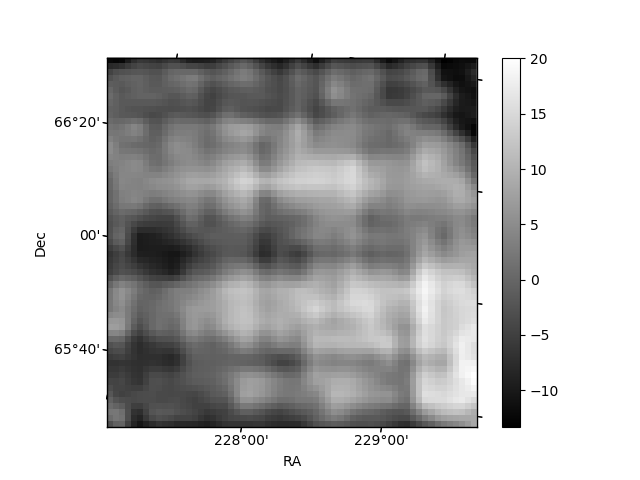
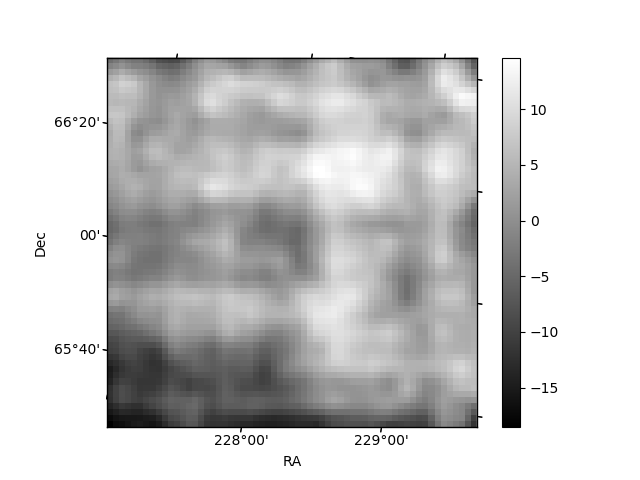
Histogram calculated using DETX and DETY for each event in the final _common_clean file
| Quadrant A | 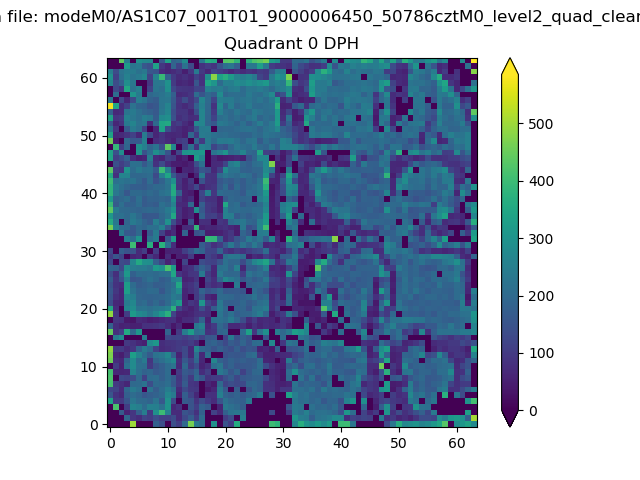 |
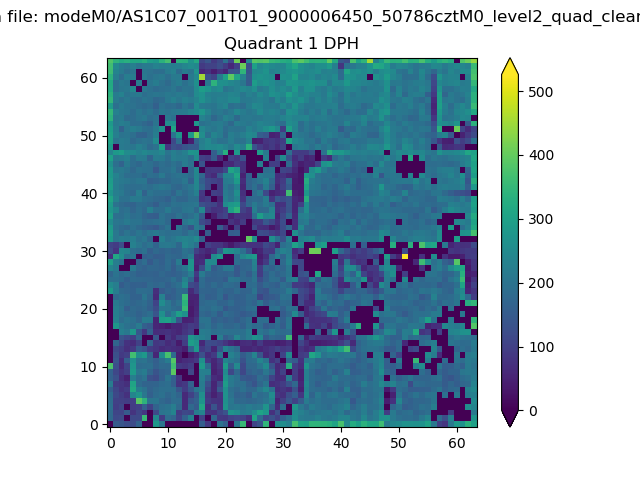 |
Quadrant B |
|---|---|---|---|
| Quadrant D | 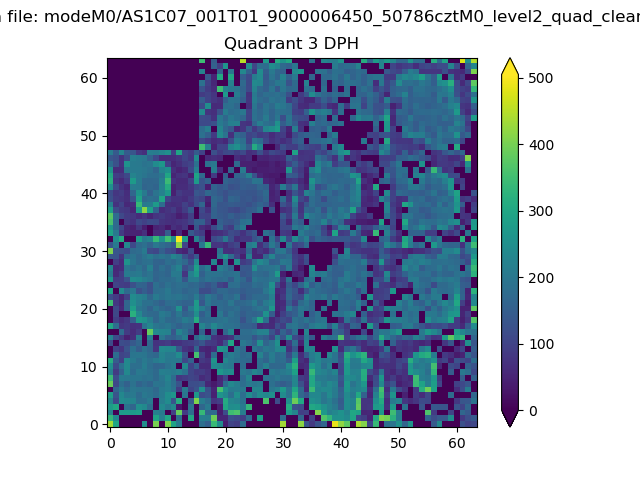 |
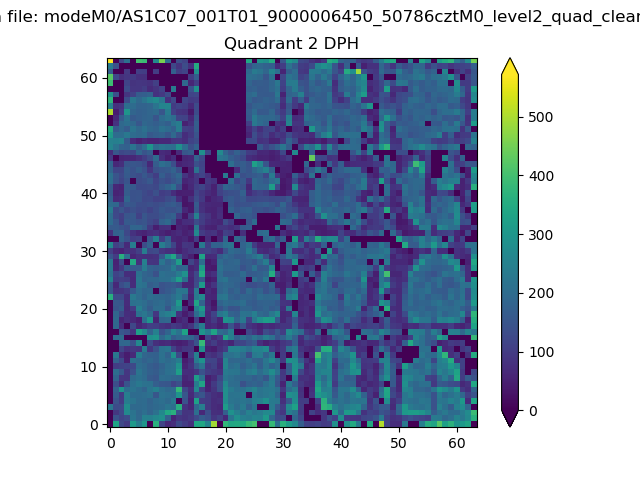 |
Quadrant C |
| Plot type | Count rate plots | Images |
|---|---|---|
| Comparison with Poisson distribution Blue bars denote a histogram of data divided into 1 sec bins. Red curve is a Poisson curve with rate = median count rate of data. |
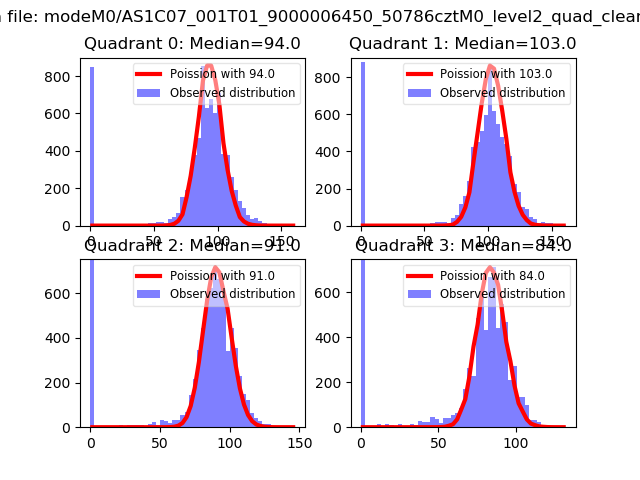 |
 |
| Quadrant-wise count rates Data is divided into 100 sec bins |
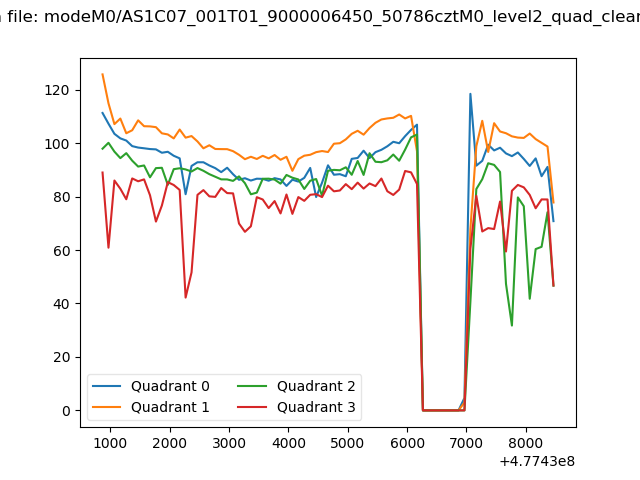 |
|
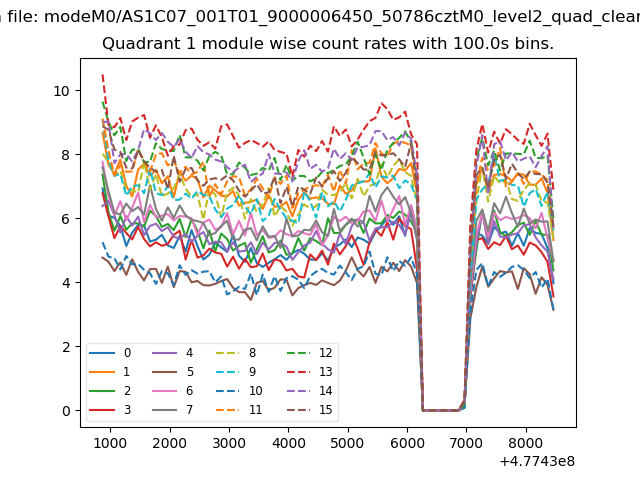
| Module-wise count rates for Quadrant A Data is divided into 100 sec bins |
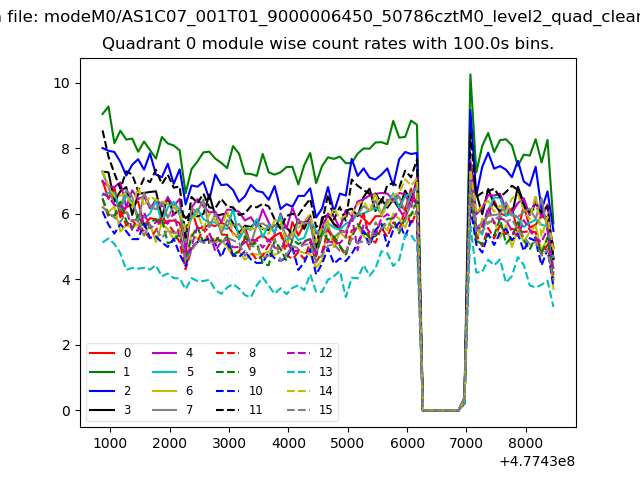 |
 |
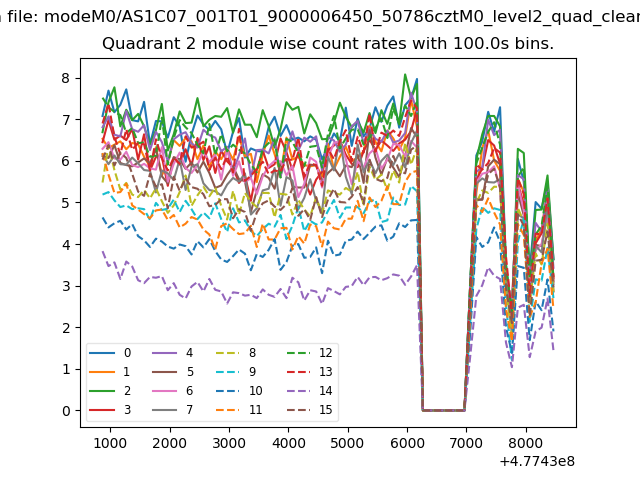
| Module-wise count rates for Quadrant B Data is divided into 100 sec bins |
 |
 |
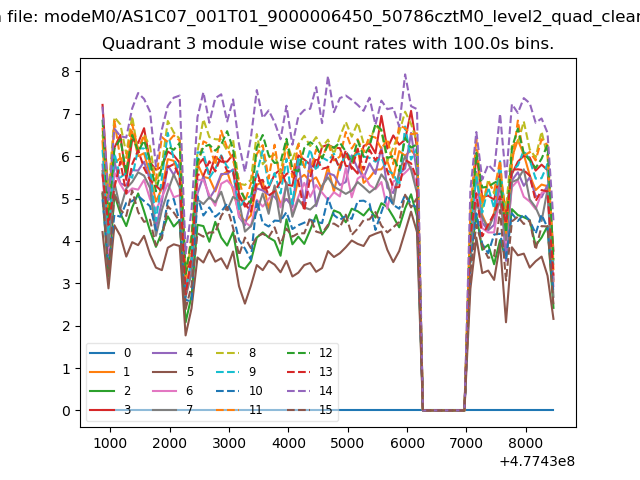
| Module-wise count rates for Quadrant C Data is divided into 100 sec bins |
 |
 |
| Module-wise count rates for Quadrant D Data is divided into 100 sec bins |
 |
 |
| Parameter | Plot |
|---|---|
| CZT HV Monitor | 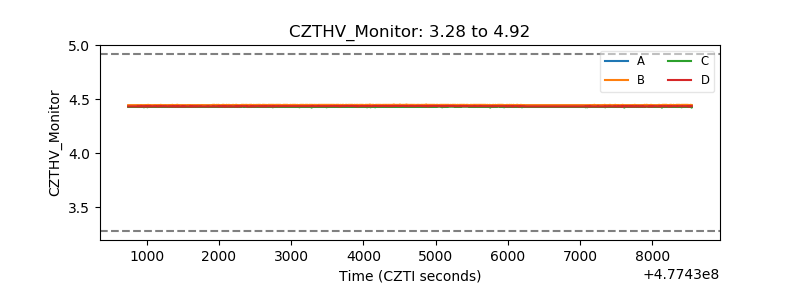 |
| D_VDD | 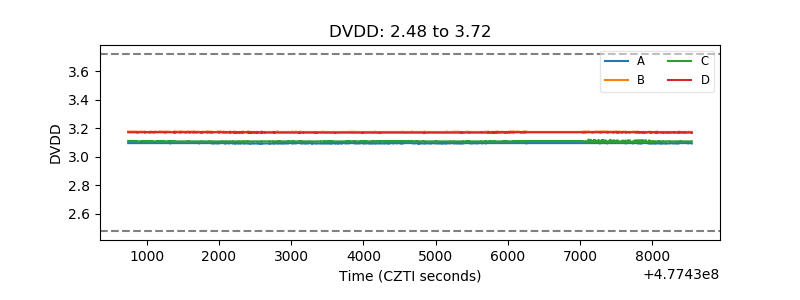 |
| Temperature 1 | 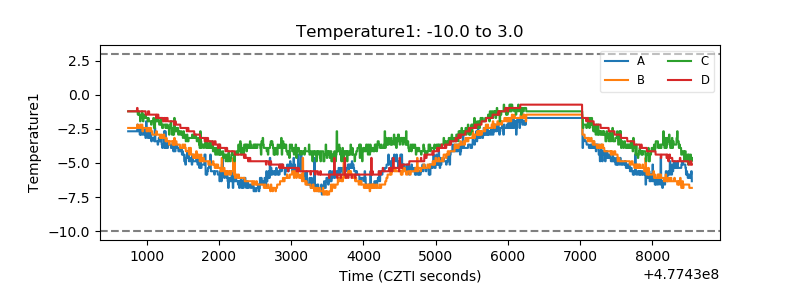 |
| Veto HV Monitor | 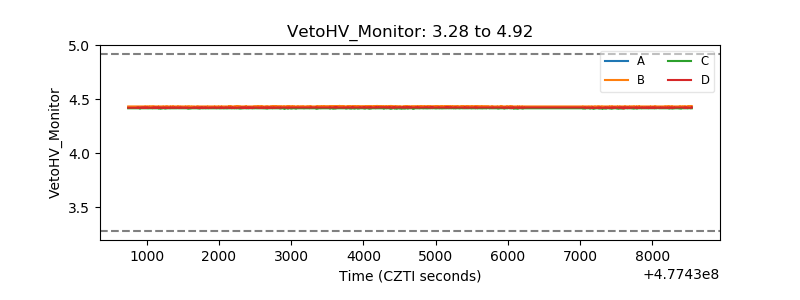 |
| Veto LLD | 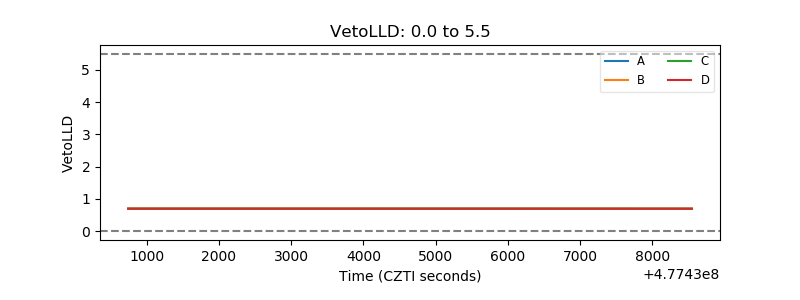 |
| Alpha Counter | 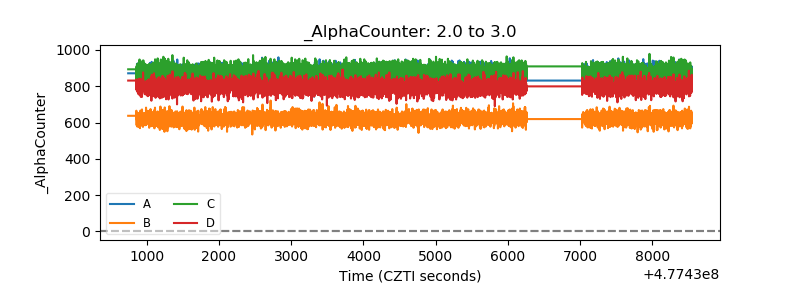 |
| _CPM_Rate | 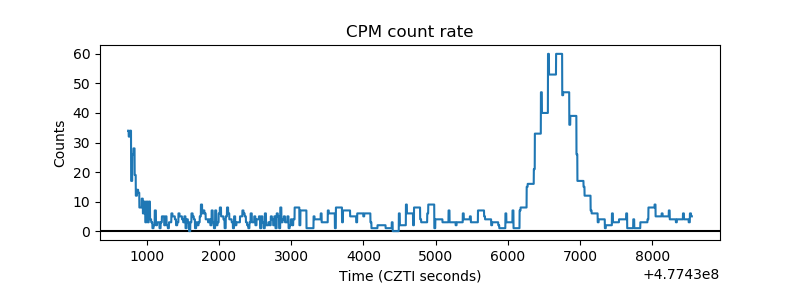 |
| CZT Counter | 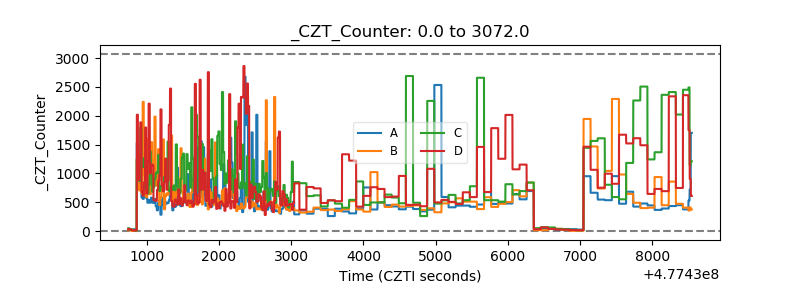 |
| +2.5 Volts monitor | 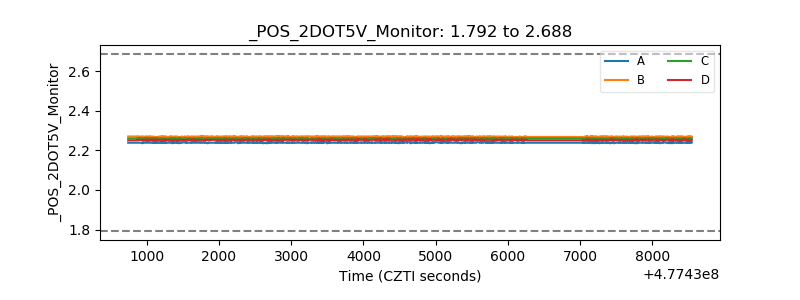 |
| +5 Volts monitor |  |
| _ROLL_ROT | 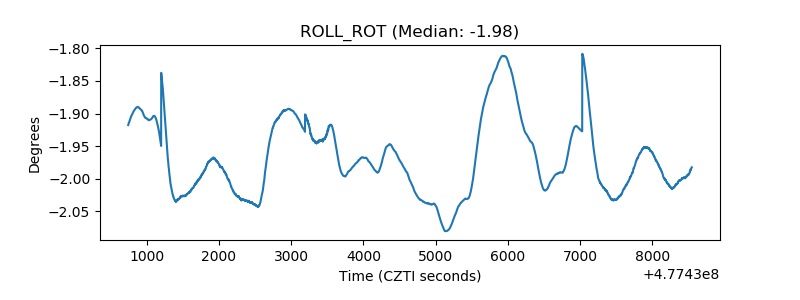 |
| _Roll_DEC | 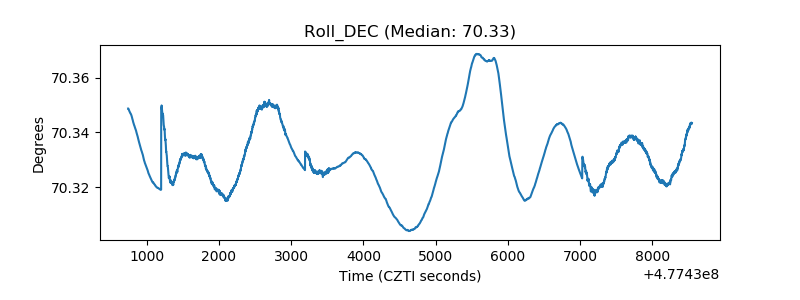 |
| _Roll_RA | 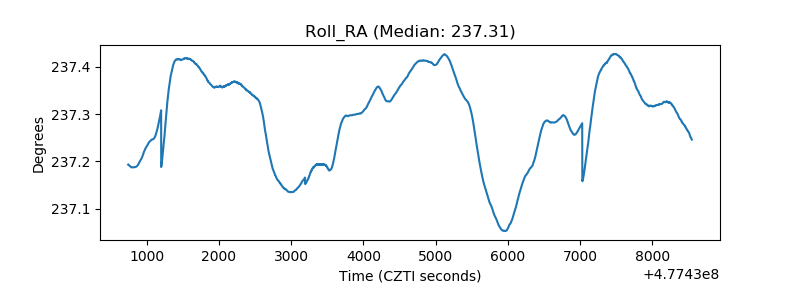 |
| Veto Counter | 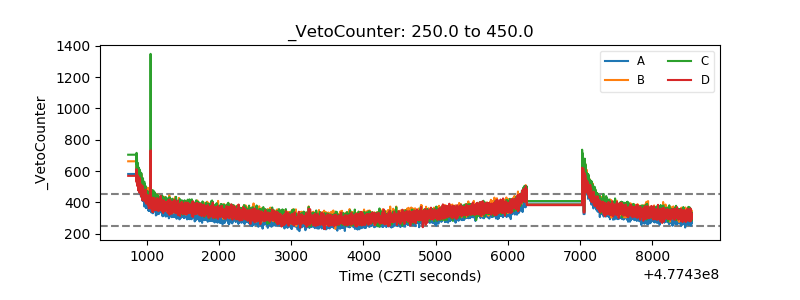 |