| Param | Original file | Final file |
|---|---|---|
| Filename | modeM0/AS1C07_001T01_9000006450_50787cztM0_level2.fits | modeM0/AS1C07_001T01_9000006450_50787cztM0_level2_quad_clean.evt |
| Size (bytes) | 831,358,080 | 96,485,760 |
| Size | 792.8 MB | 92.0 MB |
| Events in quadrant A | 3,971,926 | 701,722 |
| Events in quadrant B | 4,370,306 | 754,373 |
| Events in quadrant C | 14,993,926 | 353,982 |
| Events in quadrant D | 6,855,177 | 587,359 |
| Mode SS | |||
|---|---|---|---|
| Quadrant | BADHDUFLAG | Total packets | Discarded packets |
| A | 0 | 154 | 0 |
| B | 0 | 154 | 0 |
| C | 0 | 154 | 0 |
| D | 0 | 154 | 0 |
| Mode M0 | |||
|---|---|---|---|
| Quadrant | BADHDUFLAG | Total packets | Discarded packets |
| A | 0 | 17230 | 3 |
| B | 0 | 18378 | 3 |
| C | 0 | 49710 | 3 |
| D | 0 | 25643 | 3 |
| Mode M9 | |||
|---|---|---|---|
| Quadrant | BADHDUFLAG | Total packets | Discarded packets |
| A | 0 | 3 | 0 |
| B | 0 | 4 | 0 |
| C | 0 | 4 | 0 |
| D | 0 | 4 | 0 |
| Quadrant | Total seconds | Saturated seconds | Saturation percentage |
|---|---|---|---|
| A | 7528 | 151 | 2.005845% |
| B | 7528 | 249 | 3.307651% |
| C | 7527 | 4141 | 55.015278% |
| D | 7527 | 782 | 10.389265% |
Noise dominated data is calculated using 1-second bins in cleaned event files. If a bin has >2000 counts, and if more than 50% of those come from <1% of pixels, then it is considered to be noise-dominated and hence unusable.
| Quadrant | # 1 sec bins | Bins with >0 counts | Bins with >2000 counts | High rate bins dominated by noise | Noise dominated (total time) | Noise dominated (detector-on time) | Marked lightcurve |
|---|---|---|---|---|---|---|---|
| A | 7778 | 7532 | 71 | 71 | 0.91% | 0.94% | 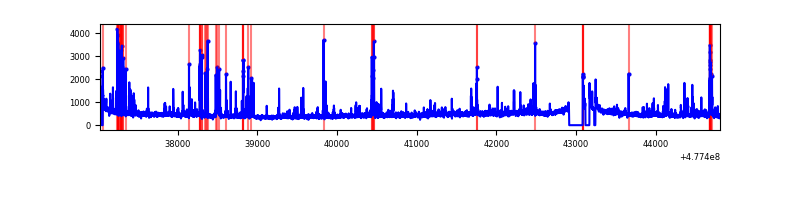 |
| B | 7778 | 7531 | 63 | 63 | 0.81% | 0.84% | 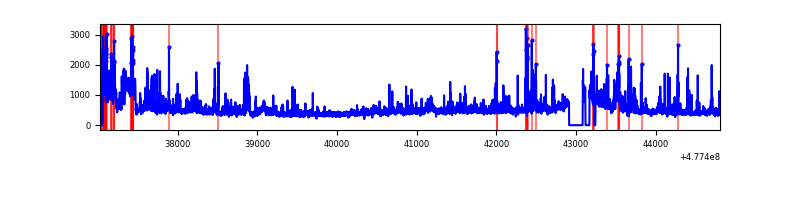 |
| C | 7776 | 7529 | 3776 | 3776 | 48.56% | 50.15% | 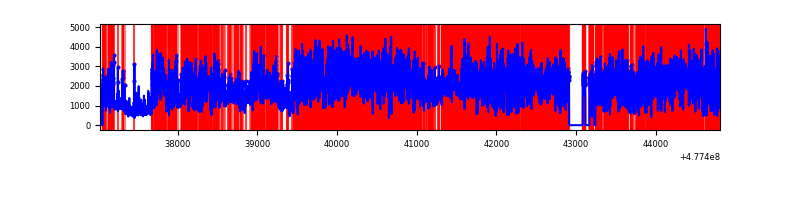 |
| D | 7777 | 7530 | 616 | 616 | 7.92% | 8.18% | 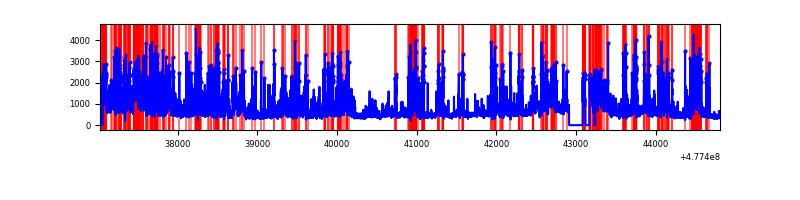 |
Top three noisy pixels from each quadrant. If the there are fewer than three noisy pixels in the level2.evt file, extra rows are filled as -1
| Pixel properties | Quadrant properties | ||||||
|---|---|---|---|---|---|---|---|
| Quadrant | DetID | PixID | Counts | Sigma | Mean | Median | Sigma |
| A | 3 | 114 | 170491 | 846.49 | 800 | 780 | 200.5 |
| A | 4 | 3 | 92642 | 458.19 | 800 | 780 | 200.5 |
| A | 11 | 3 | 77126 | 380.8 | 800 | 780 | 200.5 |
| B | 7 | 0 | 373485 | 2211.19 | 796 | 768 | 168.6 |
| B | 4 | 170 | 203814 | 1204.59 | 796 | 768 | 168.6 |
| B | 5 | 172 | 149436 | 881.99 | 796 | 768 | 168.6 |
| C | 5 | 10 | 10615450 | 60803.9 | 632 | 627 | 174.6 |
| C | 4 | 5 | 926954 | 5306.19 | 632 | 627 | 174.6 |
| C | 12 | 2 | 110524 | 629.51 | 632 | 627 | 174.6 |
| D | 2 | 216 | 1536998 | 7253.83 | 746 | 718 | 211.8 |
| D | 2 | 249 | 679419 | 3204.61 | 746 | 718 | 211.8 |
| D | 10 | 24 | 305579 | 1439.46 | 746 | 718 | 211.8 |
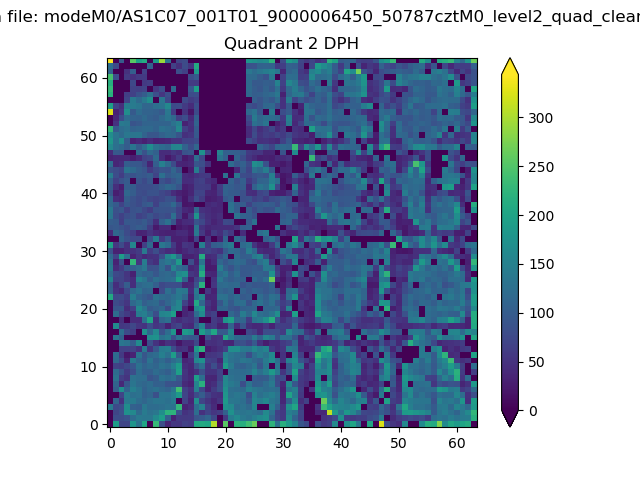
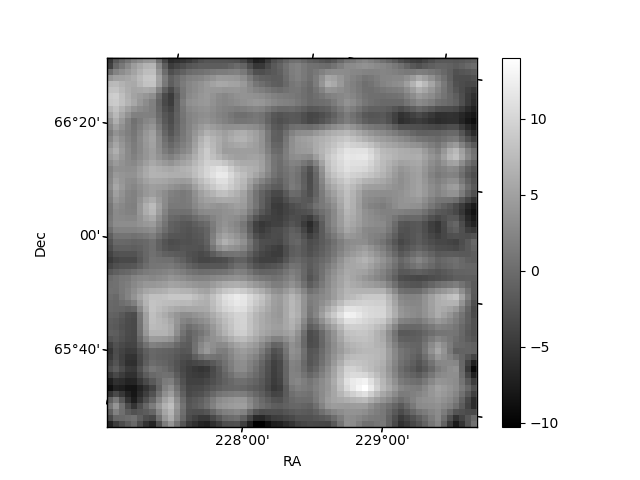
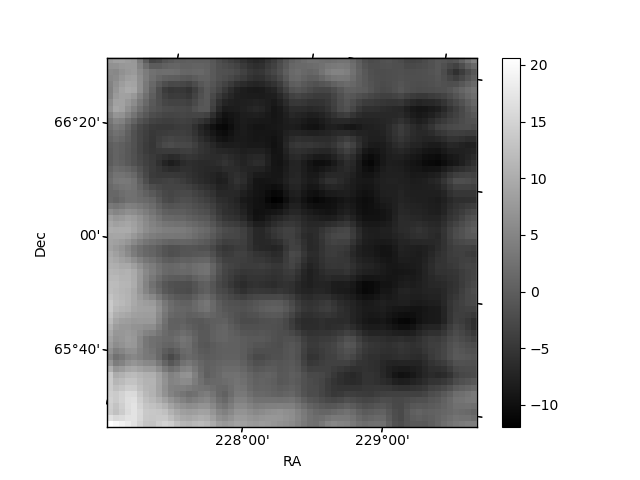
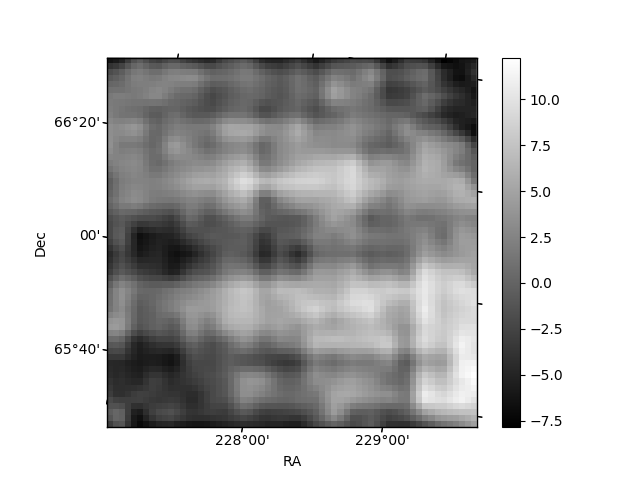
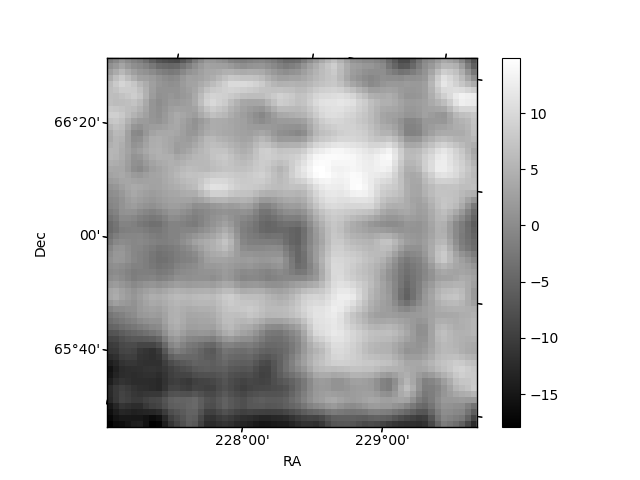
Histogram calculated using DETX and DETY for each event in the final _common_clean file
| Quadrant A | 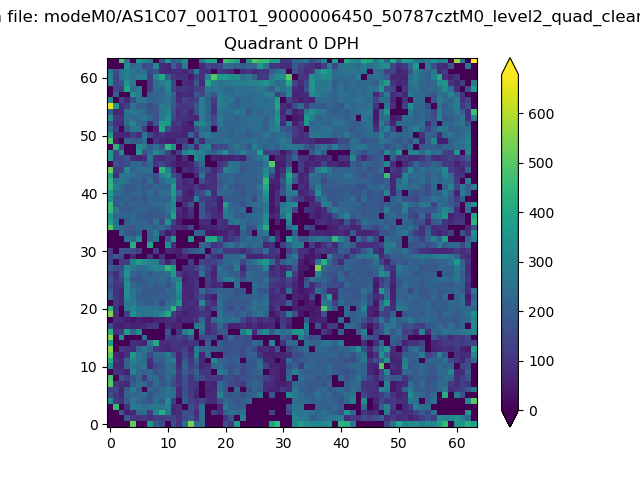 |
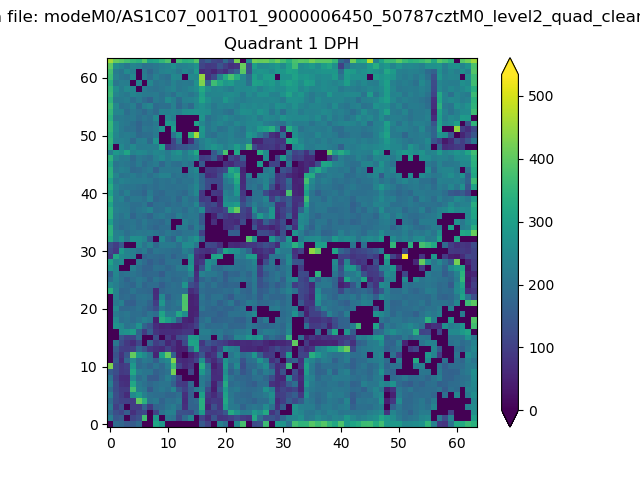 |
Quadrant B |
|---|---|---|---|
| Quadrant D | 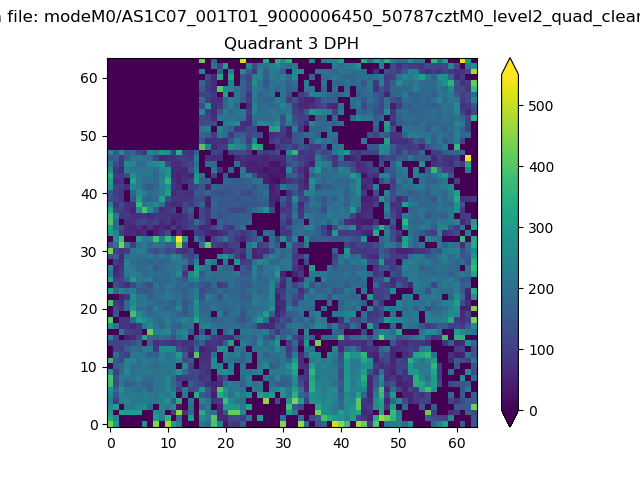 |
 |
Quadrant C |
| Plot type | Count rate plots | Images |
|---|---|---|
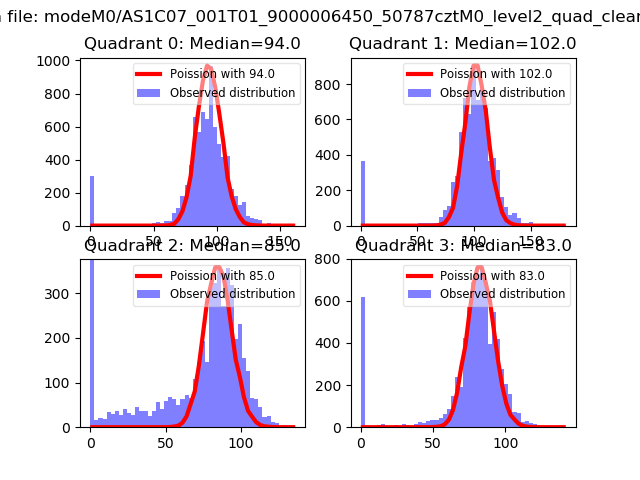
| Comparison with Poisson distribution Blue bars denote a histogram of data divided into 1 sec bins. Red curve is a Poisson curve with rate = median count rate of data. |
 |
 |
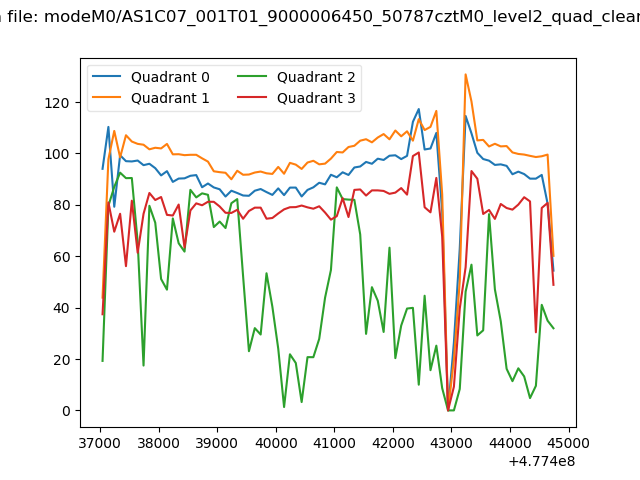
| Quadrant-wise count rates Data is divided into 100 sec bins |
 |
|
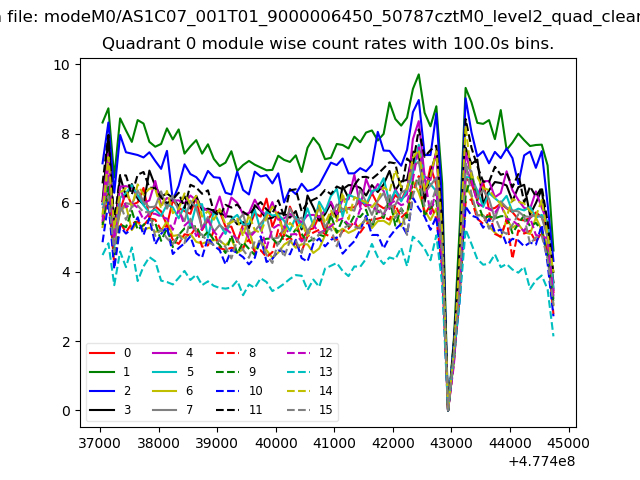
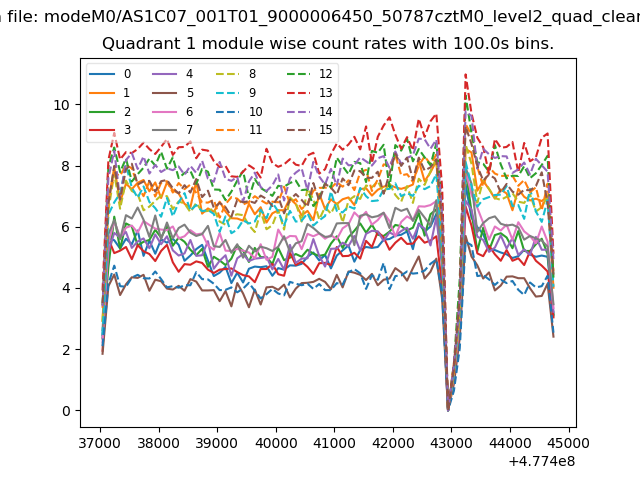
| Module-wise count rates for Quadrant A Data is divided into 100 sec bins |
 |
 |
| Module-wise count rates for Quadrant B Data is divided into 100 sec bins |
 |
 |
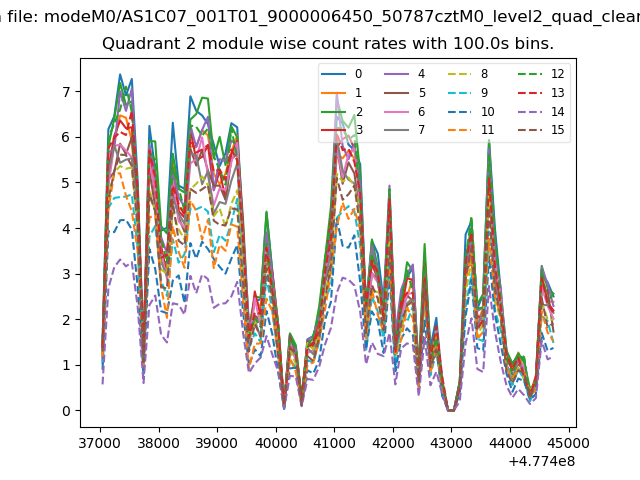
| Module-wise count rates for Quadrant C Data is divided into 100 sec bins |
 |
 |
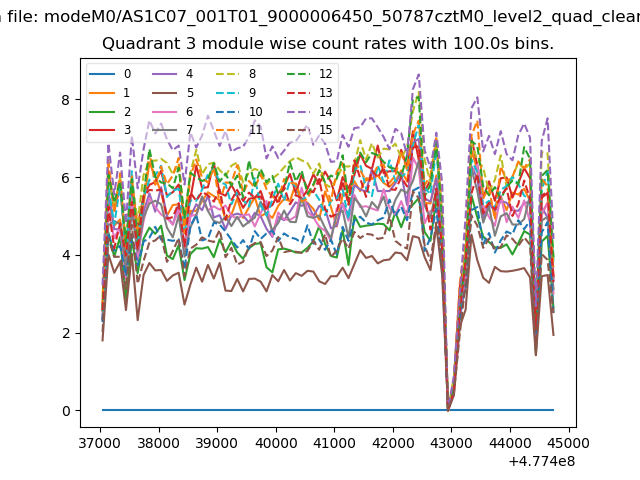
| Module-wise count rates for Quadrant D Data is divided into 100 sec bins |
 |
 |
| Parameter | Plot |
|---|---|
| CZT HV Monitor | 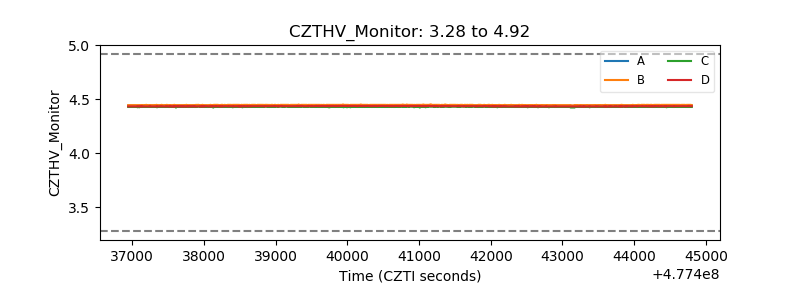 |
| D_VDD | 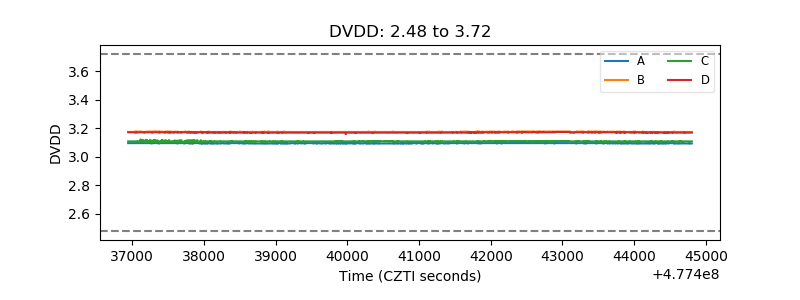 |
| Temperature 1 | 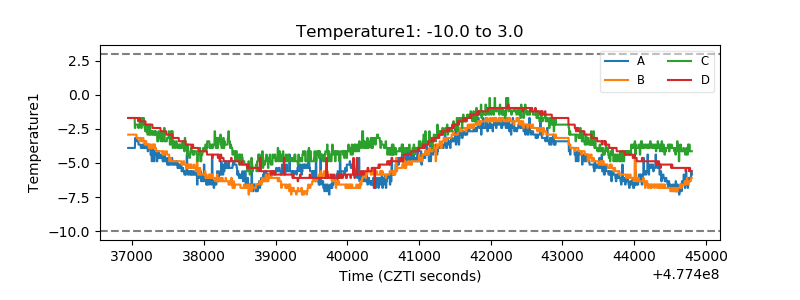 |
| Veto HV Monitor | 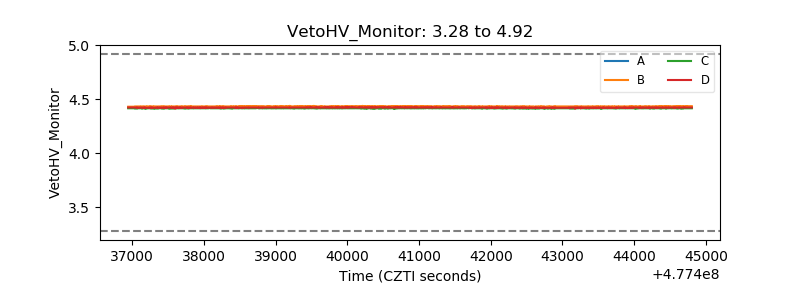 |
| Veto LLD | 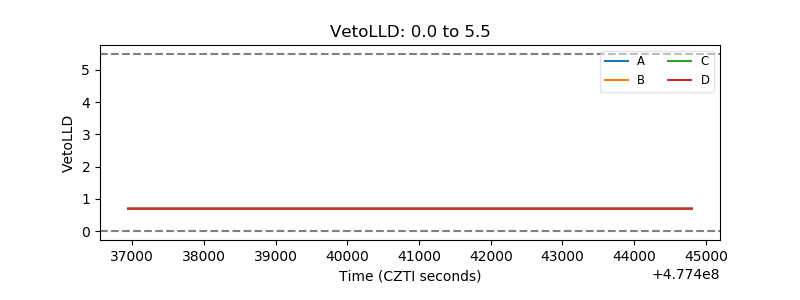 |
| Alpha Counter | 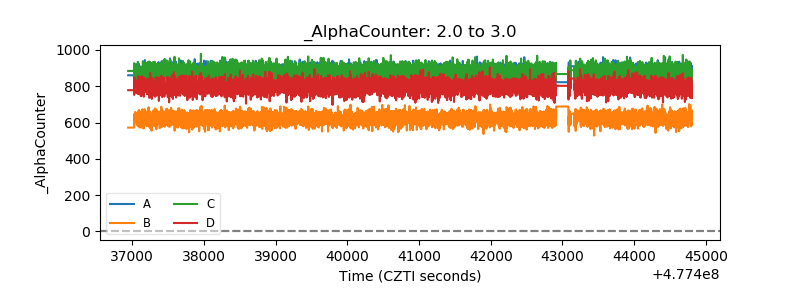 |
| _CPM_Rate | 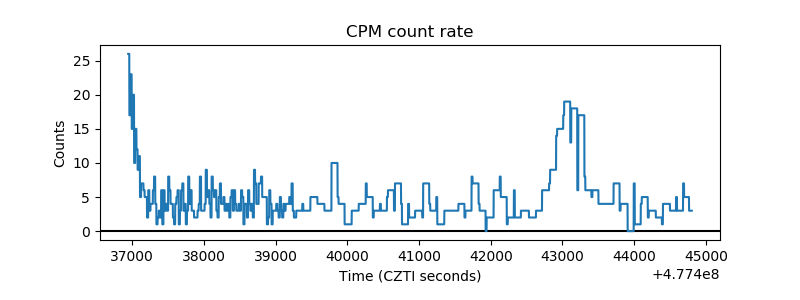 |
| CZT Counter | 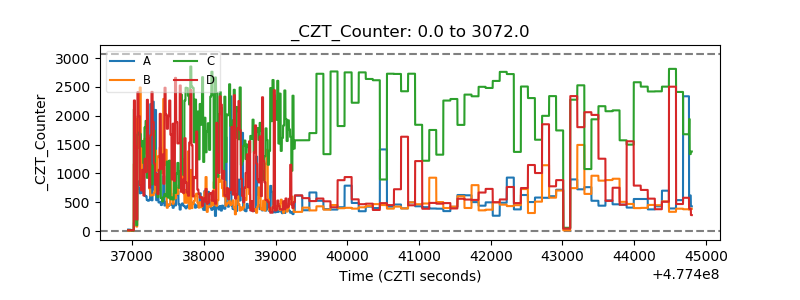 |
| +2.5 Volts monitor | 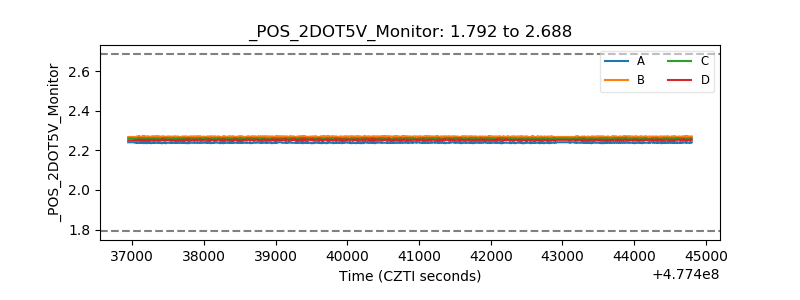 |
| +5 Volts monitor | 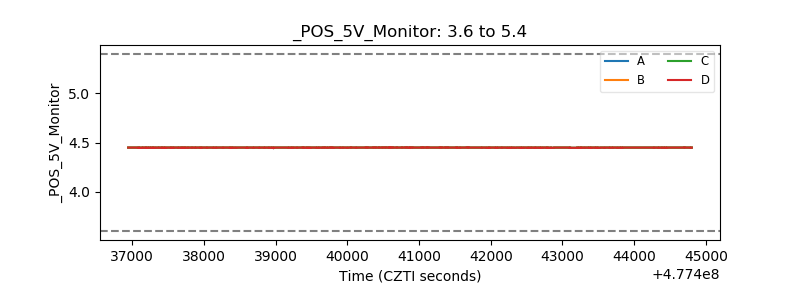 |
| _ROLL_ROT | 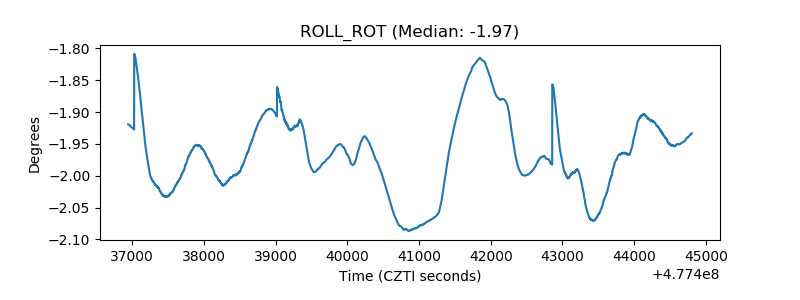 |
| _Roll_DEC | 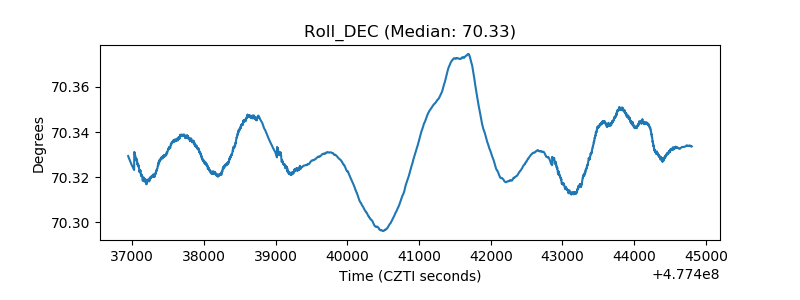 |
| _Roll_RA | 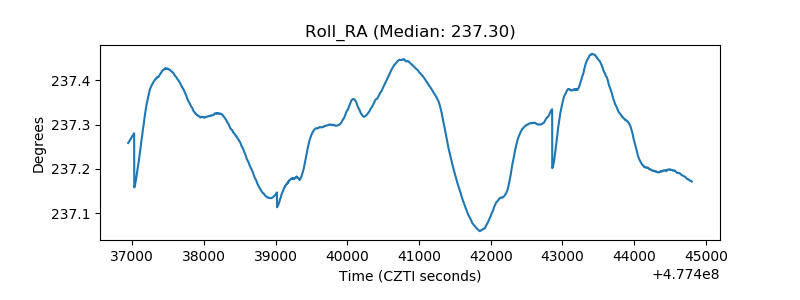 |
| Veto Counter | 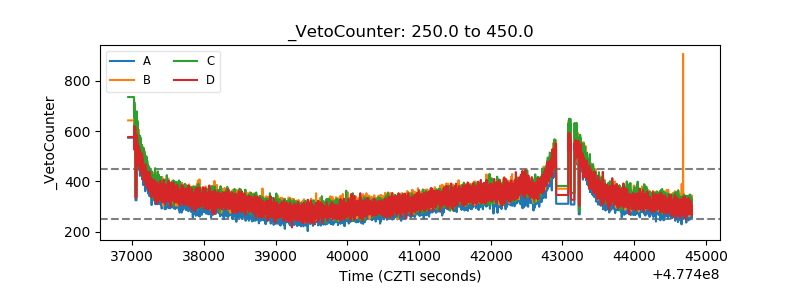 |